Interactive Maps
The Illinois Water Budget Vista (IWBV)
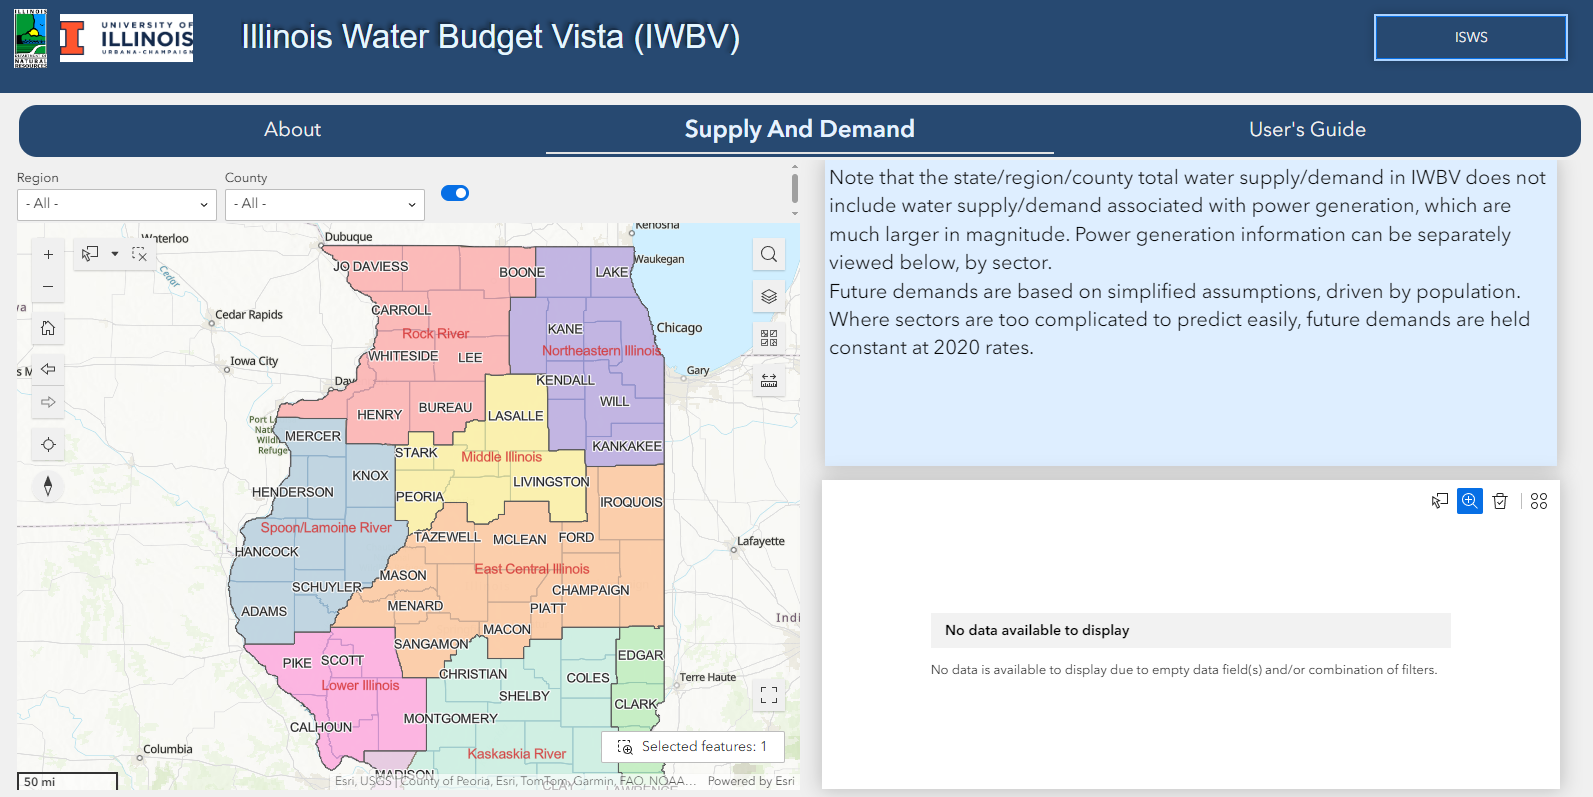
Economic expansion and population growth in certain areas of Illinois have increased the demand for water resources. However, despite the state's abundant water resources, this heightened demand, coupled with unsustainable usage practices, may lead to water scarcity issues in some regions. To address these challenges, Illinois updated the State Water Plan in 2022, with the following mission: “For state agencies to develop a concise plan for addressing the water issues facing the state in an efficient and unified front” (Illinois State Water Plan Task Force 2022). As part of this, the Illinois Department of Natural Resources- Office of Water Resources (IDNR-OWR) has teamed with the Illinois State Water Survey (ISWS) in water supply planning efforts to “ensure Illinois has a sustainable water supply for all communities and users.” The Illinois Water Budget Vista (IWBV) application provides supply and demand estimates throughout the state, as well as future water needs and usage patterns throughout regions and counties.
For questions or comments please contact Devin Mannix by email mannix@illinois.edu
Last Updated: 6/28/2024
Illinois Center Pivot Irrigation
The Irrigation Water Use and Withdrawals collections portion of the Illinois Water Inventory Program (IWIP) continues to grow. IWIP staff work closely with Illinois Farm Bureau (IFB) staff members to standardize a timeline for reporting and registering both individual and aggregate county reports, as well as market and raise awareness for the IWIP reporting process and requirements. Representative irrigation totals are calculated from either individually reported data, field data, or another ground tested method for each county/irrigation area in Illinois. The representative acre-inches are applied over the county/area totals to calculate county estimates, to make up for non-reporting data.
For questions or comments please contact Vlad Iordache by email at: iordach1@illinois.edu.
Last Updated: 12/9/2021
Public Water Supply Reporting (through 2019)
The Illinois Water Inventory Program (IWIP) database serves as the repository for annual water use and withdrawals data, as well as a register of all high-capacity well and intake attribute and location data. Water use listed in the pop-up boxes and in the attribute tables are in gallons/year and millions of gallons per day (MGD) as reported through the Illinois Water Inventory Program. The map displays reported withdrawals from deep and shallow groundwater sources, as well as surface waters aggregated by the reporting facility.
For questions or comments please contact Vlad Iordache by email at: iordach1@illinois.edu.
Last updated 12/9/2021
Statewide Municipal Water Use and Water Purchase Interactive Map

This interactive map depicts the water supply source for over 1,300 communities throughout Illinois. Communities either extract water from their own wells or intakes (self-supplied water), buy water from another community or public water distributor (purchased water), or may have a combination of self-supplied and purchased water. Water use listed in the pop-up boxes and in the attribute tables are in gallons/year and millions of gallons per day (MGD) as reported through the Illinois Water Inventory Program. The amounts of self-supplied and purchased water are for the year 2012 and will be updated as data sets are completed. Users should note that not all communities and public water distributors have reported in the year 2012. Users can also export data found in the attribute tables as a CSV file and can output maps in various formats for printing. Data sets are also available for download.
For questions or comments please contact Daniel Hadley by email drhadley@illinois.edu or phone, 217-300-0402.
Last updated 2/22/2017
Cambrian-Ordovician Sandstone Aquifer System of Illinois

This webmap is a repository for the latest data and model results for the Cambrian-Ordovician Aquifer System of Illinois, which includes three major aquifers: the St. Peter Sandstone, Ironton-Galesville Sandstone, and Mt. Simon Sandstone, along with one minor aquifer: the New Richmond Sandstone, primarily utilized where the St. Peter Sandstone is absent. Data and model results will be updated as newer data becomes available and are subject to change. Results outside of Illinois have not been verified for accuracy.
For questions or comments please contact Devin Mannix by email mannix@illinois.edu or phone, 217-244-2419.
Last updated 6/21/2018
Illinois Groundwater Resources

Illinois has an abundance of groundwater resources that supply millions of gallons of water per day to public, irrigation, and commercial/industrial systems. Groundwater resources are unevenly distributed throughout Illinois due to the state’s complex bedrock and glacial geology. This interactive map depicts the three major aquifer systems in Illinois and the public water supply (PWS) wells that extract groundwater from them. Withdrawals are reported in gallons/year through the Illinois Water Inventory Program. The latest complete dataset available for public water supplies is from 2013 and will be updated as they are finalized. Aquifer maps were developed by the Illinois State Geological Survey are available for download. Major aquifers are considered to be at least 50 square miles in area and are capable of yielding at least 70 gallons per minute to wells.
For questions or comments please contact Daniel Hadley by email drhadley@illinois.edu or phone, 217-300-0402.
Last updated 8/29/2016
Northeastern Illinois Shallow Bedrock Aquifer Interactive Map

Prior to glaciation episodes in Illinois, the predominately carbonate bedrock exposed at the land surface in northeastern Illinois was subjected to weathering and dissolution. This resulted in the development of significant secondary porosity creating a productive aquifer known as the shallow bedrock carbonate aquifer. This interactive map depicts the potentiometric surface for the shallow bedrock carbonate aquifer. It was developed using over 1,400 water level measurements taken between 1990 and 2006 as part of various Illinois State Water Survey (ISWS) studies, and an additional 231 surface water elevations along rivers and creeks where there is a hydraulic connection with the shallow bedrock aquifer. Data sets are also available for download.
For questions or comments please contact Daniel Hadley by email drhadley@illinois.edu or phone, 217-300-0402.
Last updated 10/19/2016