Illinois State Water Survey - University of Illinois at Urbana-Champaign
State Climatologist Office for Illinois
Climate Change in Illinois
Dr. Jim Angel, State Climatologist
Climate change has become a major issue will have direct and indirect impacts on Illinois. We know the climate in Illinois has changed in the past due to natural forces such as changes in the amount of solar radiation, ocean circulation, volcanoes, etc. However, humans can impact climate on a local, regional, and global scale, through increases in greenhouse gasses, changing aerosols (small particles in the air such as dust or sulfates from coal burning), and land use changes (change from prairie to agriculture to cities). Therefore, climate change is the result of complex interactions between natural and human-induced forces and remains a challenge for planning and adapting to future climate change.
Climate Assessment Summary for Illinois
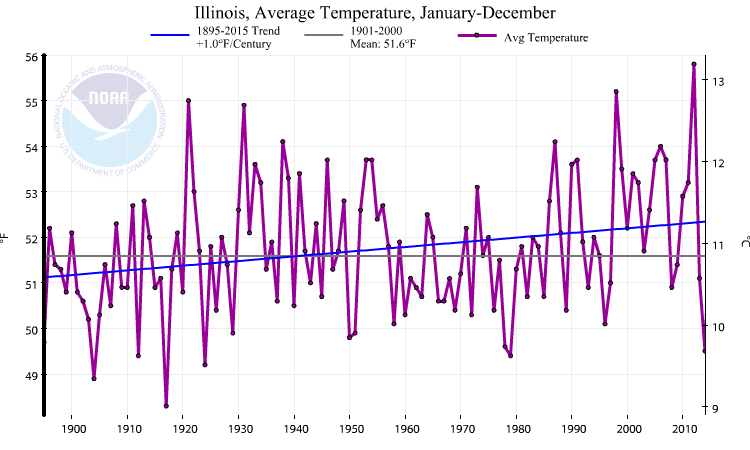
- Average annual temperature has increased by about 1°F since the beginning of the 20th century. There has been seasonal variation in this warming, with average spring temperature increasing by about 2°F and average summer temperature increasing very little. Under a higher emissions pathway, historically unprecedented warming is projected by the end of the 21st century.
- Precipitation in spring and summer has generally been above average over the past two decades, affecting agriculture in both positive (adequate soil moisture) and negative (delays in spring planting) ways. Precipitation in winter and spring is projected to increase, which poses a continuing risk of spring planting delays.
- Severe flooding and drought have occurred periodically in recent years. Future increases in extreme precipitation events and in evaporation rates may increase the intensity of both floods and droughts.

National Climate Assessment: Midwest Region
The 2014 National Climate Assessment reviewed climate trends across the Midwest, including Illinois, in this chapter report. Extreme heat, heavy downpours, and flooding will affect infrastructure, health, agriculture, forestry, transportation, air and water quality, and more. Climate change will also exacerbate a range of risks to the Great Lakes. Explore how climate change is affecting the Midwest. The report also has chapters by sectors such as water, agriculture, transportation, forestry, and human health. In addition, there are response strategies presented mitigate or adapt to the current and expected trends. The full report can be found at the National Climate Assessment website. The next National Climate Assessment is currently underway and is expected to be released by the end of 2018.
Illinois
Here are the annual temperature and precipitation trends for Illinois. A more detailed analysis, including tentative conclusions of the 1800s, can be found on the Illinois Trends page
Temperature
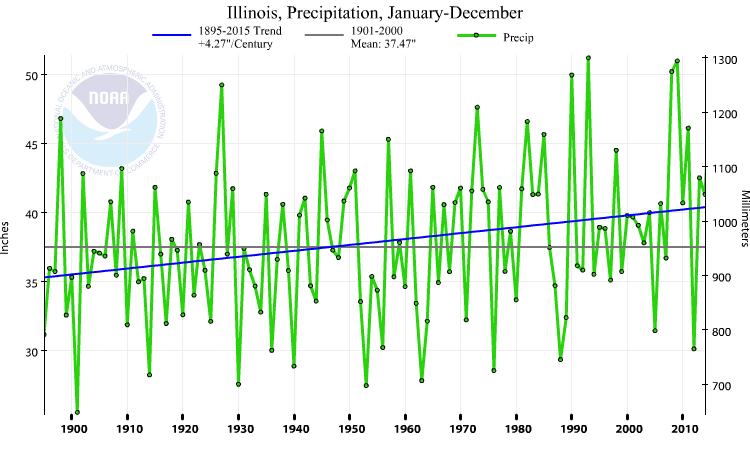
Precipitation
- Seasonal temperature and precipitation trends
- Snowfall trend
- Drought trend
- Tornado frequency trend
- Precipitation trends in northeast Illinois
- Ten warmest years on record for Illinois
Here are two great interactive resources for plotting time series of temperature and precipitation for Illinois or elsewhere
United States
The National Climatic Data Center tracks US temperature and precipitation trends at NCEI Climate at a Glance. Here are the US trends in annual temperature and precipitation through 2015.


World
Calculating the Earth’s temperature is very challenging. Changes in sites, exposure, instruments, procedures, and observers can introduce errors and biases into the data. Observations before 1900 were more sparse and were concentrated in the land areas of the northern hemisphere. However, extensive research has gone into accounting for these issues.
While no data set is perfect, several groups applying different techniques have reached similar conclusions. Furthermore, other kinds of observations support the evidence of warming. These include the observed reduction of glaciers in every continent, reductions in snow cover, shorter ice season on many lakes and rivers, and changes in the oceans.
Groups who have calculated global temperatures include NASA’s Goddard Institute for Space Studies (GIS), the U.S. National Climatic Data Center.
 These data are updated frequently at the NCEI global temperature page.
Outside Resources
- Intergovernmental Panel on Climate Change (IPCC)
- U.S. Carbon Dioxide Information Analysis Center
- U.S. Climate Change Science Program
- U.S. Department of Agriculture (USDA) Global Climate Change
- U.S. Geological Survey (USGS) Climate and Land Use Change
- U.S. National Oceanic and Atmospheric Administration (NOAA)
- U.S. National Aeronautics and Space Administration (NASA)
These external links do no imply an official endorsement by the Water Survey and may not reflect the views of the Illinois State Water Survey, University of Illinois, or the State of Illinois. See this disclaimer for our full policy on external links.