Climate Change in Illinois - Temperature and Precipitation
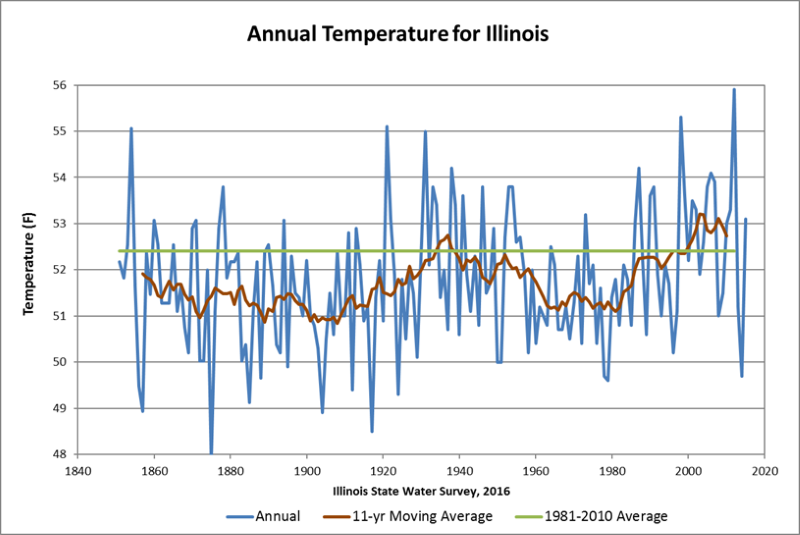
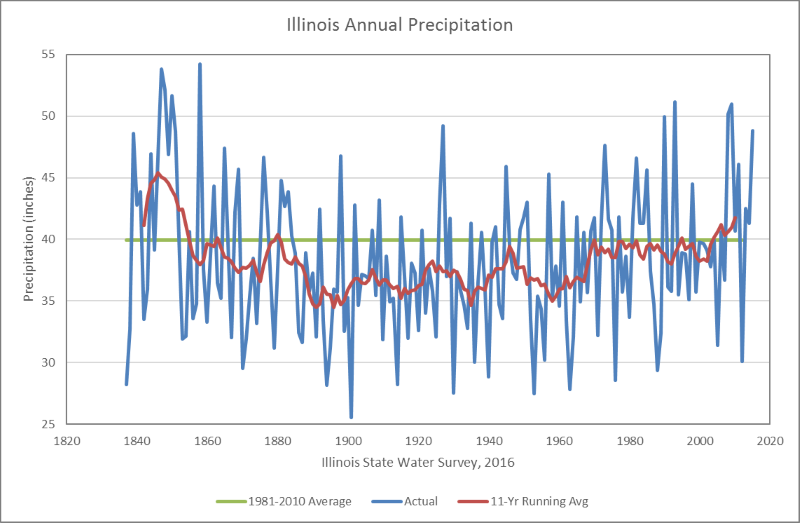
These two figures are our best estimates of annual temperatures and precipitation in the last 185 years in Illinois.
Temperature: the 1800s were considerably cooler with a remarkable warming trend through about 1940, followed by a cooling trend through the early 1980s. Temperatures have been warming in Illinois since the 1980s. The warmest year on record was 2012, followed by 1998. In recent decades, cold years have become much less common. While 2014 will be remembered for the cold winter, it was mild in comparison to years in the 1800s and early 1900s.
Precipitation: the mid 1800s were considerably wetter than today. This was followed by a trend towards drier conditions that ended around 1900. Precipitation remained low until a rapid increase occurred in the 1960s. This period of wetter conditions remains today.
Caveats
The number of stations available in the 19th century was considerably less than today. For example, during the period from 1875 to 1895, only 10 to 30 stations were available for the statewide average. Very few stations were available before 1875. In most cases, the early, continuous records are only available at major cities such as Chicago and St. Louis.
Besides fewer stations, the observation practices and the location of the instruments in 1800s were different than today. For example, in major cities the early thermometers and rain gages were sometimes located on the roof tops in the downtown portion of the city. In rural areas, thermometers were often located on the north porch of the observer's house. As a result of fewer stations and different observing practices, the level of uncertainty in the 19th century numbers is higher. On the other hand, the observed wet conditions in the 19th century is supported by higher flows on the Mississippi and Illinois Rivers and higher lake levels on Lake Michigan. There are numerous accounts of cold winters and problems with frost damaging crops as well during that period.
An 11-year, moving average was included to smooth out some of the year-to-year variability in the records. The green line denotes the 1981-2010 average or normal.