Tornado Trends in Illinois
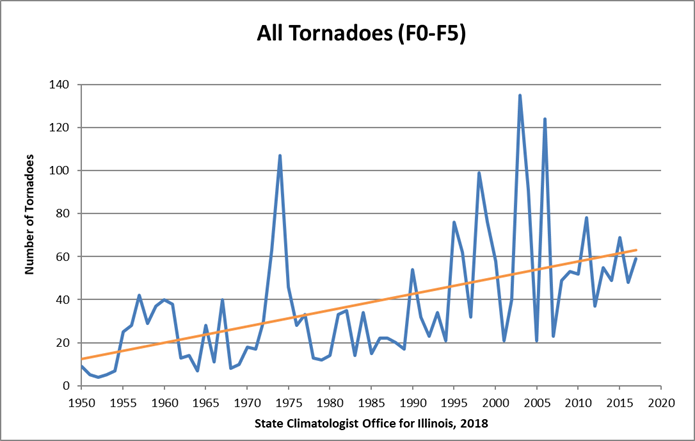
Here is an example of how the method for collecting data changes over time, causing a signal that looks like climate change. The first figure shows the annual number of tornadoes per year in Illinois since 1950, regardless of strength. Beginning in the 1990s, the number of tornadoes has increased dramatically with wider variations from year to year.
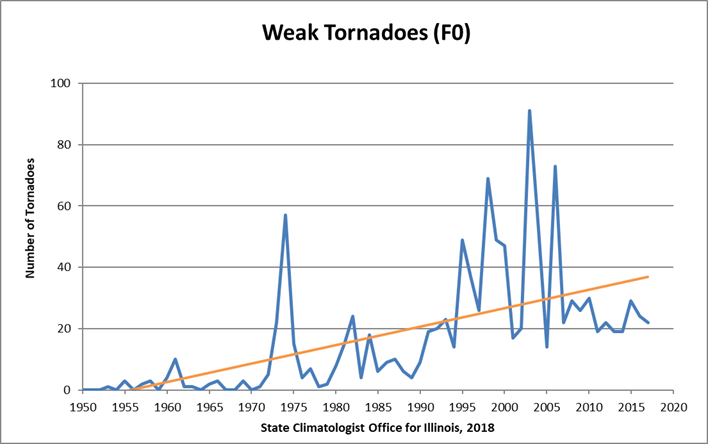
The second figure shows the upward trend in the number of the weakest F0 (EF0) tornadoes. These rarely cause any damage and traditionally were ignored. The upward trend in recent years is the result of better radar systems, better spotter networks, and increased awareness and interest by the public. Combined these factors have allowed for a better documentation of the weaker events over time.
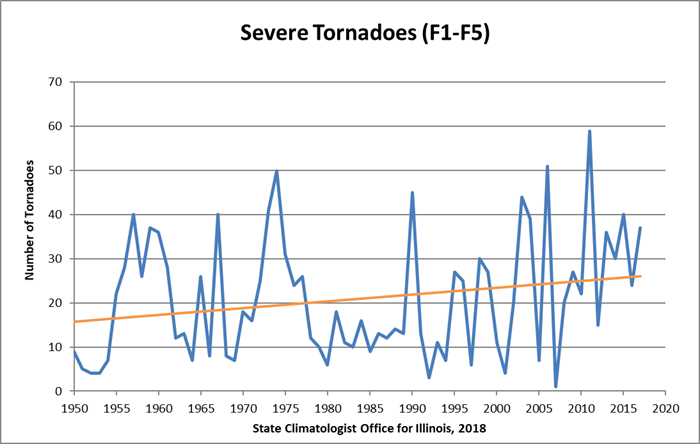
The third figure shows a much weaker trend in the stronger tornado events - those classified as F1 to F5 in the original Fujita Scale, and EF1 to EF5 in the Enhanced Fujita Scale. These represent the tornadoes that cause at least moderate damage, are well documented, and perhaps less sensitive to data collection methods.
More information on Illinois tornadoes and the F-scale can be found here