Rainfall Trends in Northeast Illinois
Like the rest of Illinois, northeast Illinois has experienced a wetter climate in recent decades with more heavy rain events. These trends are examined here in more detail. The northeast Illinois region includes the counties of Boone, McHenry, Lake, DeKalb, Kane, DuPage, Cook, LaSalle, Kendall, Grundy, and Will.
Northeast Illinois annual precipitation (Fig. 1) averages 36.83 inches (1981-2010 normal). However, the year-to-year variations can be quite large. Past annual values have ranged from 23.9 inches in 1956 to 46.9 inches in 2008. Around 1970, the region became noticeably wetter and this continued into the 1990s. Between 1995 and 2005 the region was somewhat drier, highlighted by the drought year of 2005. Precipitation since 2005 has been much above normal every year except 2012. Overall, precipitation has increased by about 5 inches over the period of record.
Winter precipitation (Fig. 2) has increased by less than an inch over the period of record. The 1920s, 1930s, and 1940s were a period of somewhat lower winter precipitation. Of the four seasons, winter is typically the driest with much of its precipitation falling as snow rather than rain. Winter is defined here as the months of December, January, and February.
Spring precipitation (Fig. 3) was quite high in the late 1940s and early 1970s and very low in some years of the 1930s. Overall, precipitation has increased by just over an inch over the period of record. Spring is defined as the months of March, April, and May.
Summer precipitation (Fig. 4) has generally been higher since the late 1950s than prior to that time. Also, the year-to-year variations have been higher since about 1970. In fact, the wettest 4 summers and the driest summer have all occurred since 1970. Overall, precipitation has increased by just over two inches over the period of record. Summer is defined as the months of June, July, and August.
Fall precipitation (Fig. 5) is notable for the very large year-to-year variations, much larger than any other season. Fall is defined as the months of September, October, and November.
Trends at Selected Sites
Three better-quality climate stations in the Chicago area were selected for further examination of trends in annual precipitation. Chicago O’Hare airport is probably the best-known station with complete annual records going back to 1959 (Fig. 6). Precipitation has increased by about 5 inches since the late 1950s. The effects of the 2005 and 2012 droughts can be seen clearly.
Chicago Midway airport was established before O’Hare and has a climate record that extends back to 1928 (Fig. 7). While O’Hare is on the western edge of Chicago metropolitan area, Midway is in a more urban environment and closer to Lake Michigan. Overall, there has bee a strong upward trend in precipitation with increases on the order of 9 inches from 1928 to 2015.
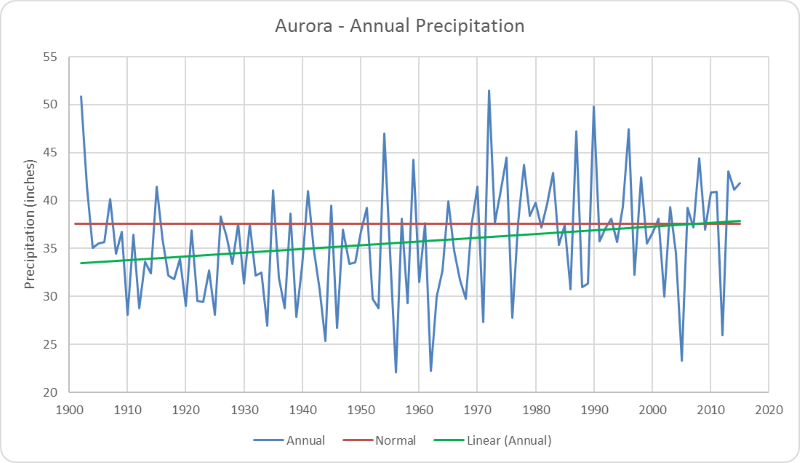
Aurora has one of the longest and most complete climate records in the greater Chicago area (Fig. 8). Generally, the first half of the 20th century was drier than today with a noticable shift towards wetter conditions occuring in the 1960s and 1970s, just like O’Hare. Annual rainfall in Aurora has exceeded 45 inches on four occasions (1972, 1987, 1990, and 1992) since 1970 and only twice in the previous 70 years (1902 and 1954).
Taken together, these three sites suggest that the region has gotten wetter over time. Even so, the region is still at risk for drought, as seen in 2005 and 2012.
Causes of Fluctuations
The most recent National Climate Assessment examined the pattern of increased rainfall across the Midwest. They state that Key Message #5 that "Extreme rainfall events and flooding have increased during the last century, and these trends are expected to continue, causing erosion, decline water quality, and negative impacts on transporation, agriculture, human health, and infrastructure." The report provides an extensive list of evidence to support this position.
Summary
Precipitation in northeast Illinois has increased over time. Much of that increase is the result of increases in precipitation in summer and fall. These changes can be seen at individual sites as well as the region as a whole.
The Illinois Department of Natural Resources (IDNR) has released a new report examining the prevalence and costs associated with urban flooding in Illinois, along with strategies and recommendations for minimizing damage to property from this flooding. The Illinois General Assembly called upon IDNR to prepare the report in collaboration with several state agencies.
Figure 1. Northeast Illinois annual precipitation in blue, 1981-2010 normal in red, and linear trend in green. The normal annual precipitation for northeast Illinois is 36.83 inches.
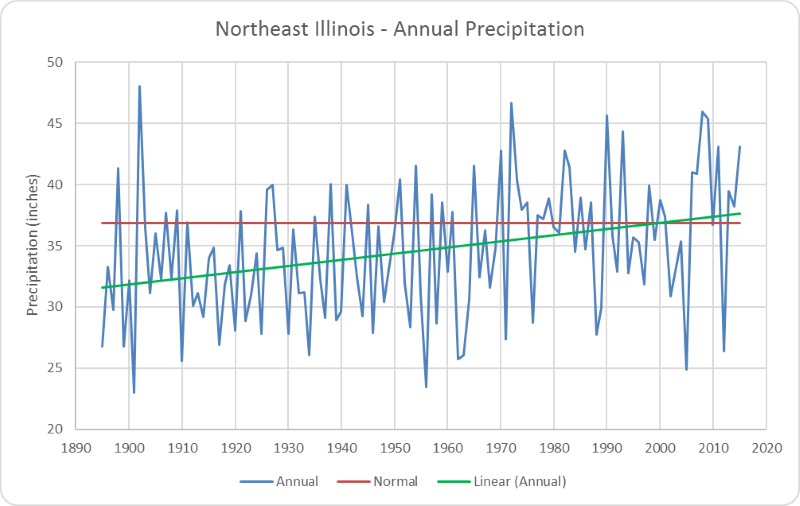
Figure 2. Northeast Illinois winter precipitation - no strong trend. The normal winter precipitation for northeast Illinois is 5.50 inches.
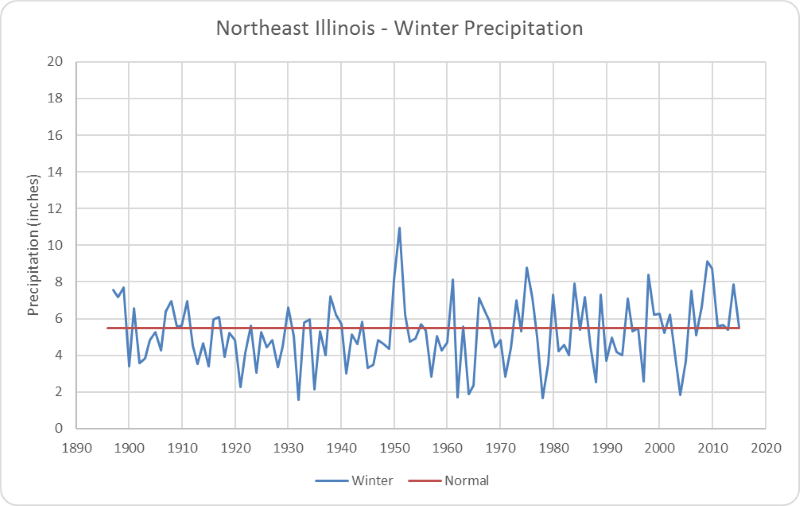
Figure 3. Northeast Illinois spring precipitation - no strong trend. The normal spring precipitation for northeast Illinois is 9.92 inches.
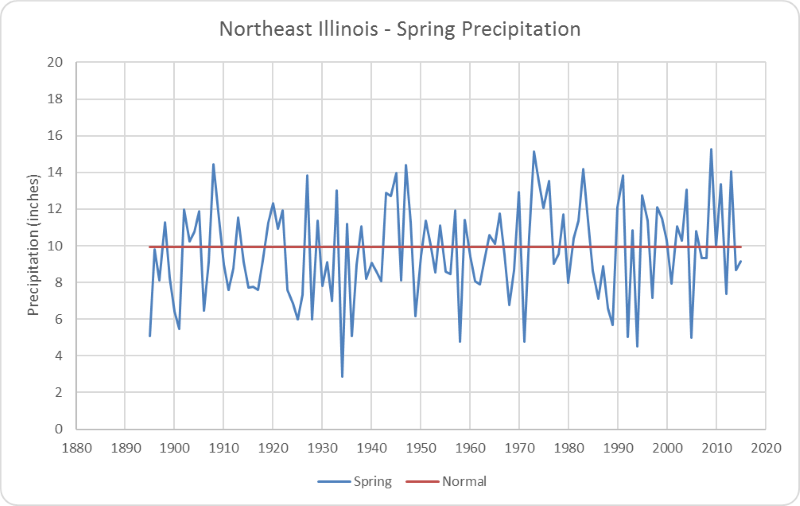
Figure 4. Northeast Illinois summer precipitation - strong upward trend. The normal summer precipitation for northeast Illinois is 12.13 inches.
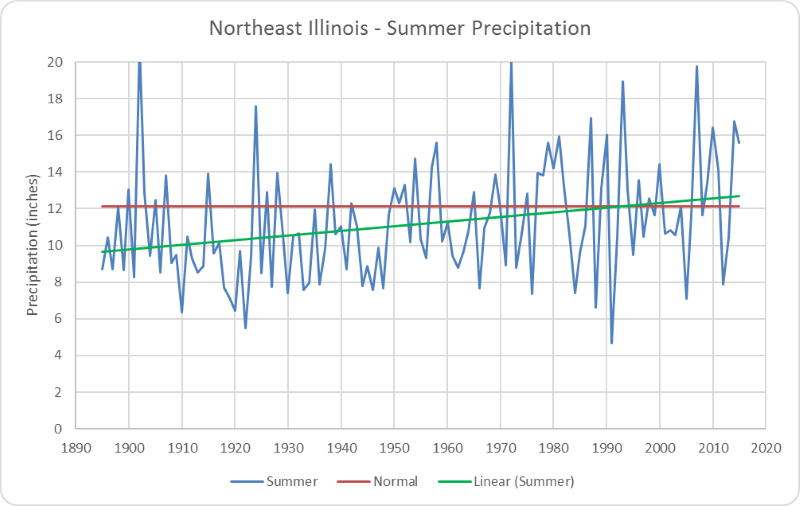
Figure 5. Northeast Illinois fall precipitation. The normal fall precipitation for northeast Illinois is 9.29 inches.
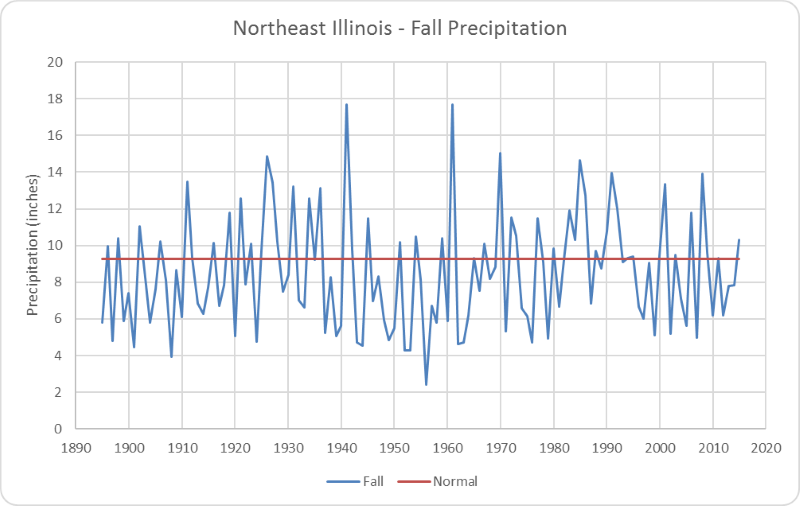
Figure 6. Chicago O'Hare Airport annual precipitation. The normal annual precipitation for Chicago O'Hare is 36.89 inches. The green line shows the linear trend towards wetter conditions.
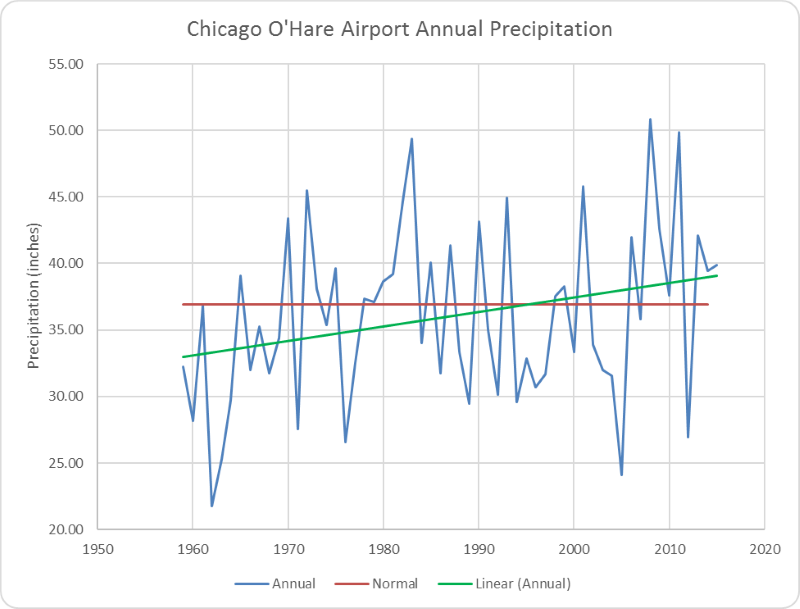
Figure 7. Chicago Midway Airport annual precipitation. The normal annual precipitation for Chicago Midway is 39.05 inches. The green line shows the linear trend towards wetter conditions.
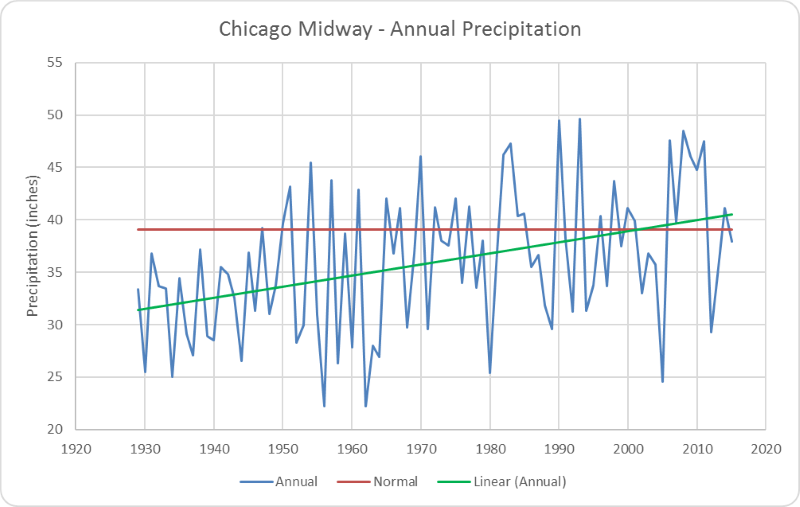
Figure 8. Aurora annual precipitation. The normal annual precipitation for Aurora is 37.57 inches. The green line shows the linear trend towards wetter conditions.