Statewide Maps
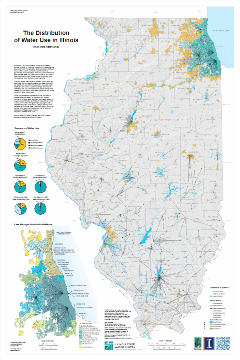
The Distribution of Water Use in Illinois
 More than 1,300 communities in Illinois rely on different sources of water
for municipal, industrial, and residential use. Sources of water throughout
the state include Lake Michigan, inland surface waters such as rivers and
reservoirs, groundwater, or a combination of sources. Communities may also
purchase water from other communities or from public water distributors, which
include private companies, water commissions, water districts, or water
agencies.
This map depicts the complexity of where communities get their water and the network of water purchases throughout the state for the year 2012. Municipalities and public water distributors are colored-coded according to the source of water they use. The purchase network depicts transactions between communities or public water distributors with arrows going from seller to purchaser.
Some communities extract water from their own wells or intakes (withdrawn water), or buy water from another community or public water distributor (purchased water), or may have a combination of withdrawn and purchased water. In 2012, over 1,510 million gallons per day (mgd) were withdrawn for public consumption. Data for this map were gathered by the Illinois Water Inventory Program, which has tracked water use at high-capacity community wells and intakes (over 70 gallons per minute) throughout the state since 1979.
The Distribution of Water Use in Illinois map is available online as a 36" x 54" PDF file (7.2MB). An interactive map of this water use data is available online.
Center Pivot Irrigation in Illinois 2012 and 2014
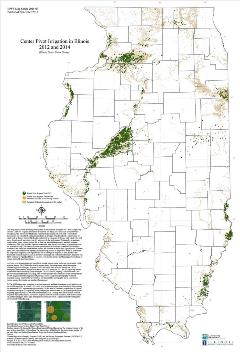
This map displays center pivot irrigation systems in use in Illinois during the 2012 and 2014 growing seasons. There was a significant increase in irrigation use during 2013 and 2014, likely due to the drought in 2012. The saturated hydraulic conductivity layer represents soils with a value of ≥10 micrometers per second (3.6 centimeters per hour) in the upper 30 inches of soil, a value typical of sandy soils in Illinois. Saturated hydraulic conductivity is a measure of the ease with which water will move through a soil, and values typically increase with the sand content. Traditionally, irrigation is needed where sandy soils are present due to their low water-holding capacity and high hydraulic conductivity. This layer provides a general location for areas that are more likely to require irrigation for a successful crop. The majority of center pivot systems in Illinois are located in alluvial valleys where soils are sandy and where shallow aquifers are available to sustain high capacity wells. In recent years, seed corn contracts that require a guaranteed crop, as well as the positive return on investment for crops under irrigation, have expanded the use of center pivot irrigation.
The map of Center Pivot Irrigation in Illinois 2012 and 2014is available online as a 25.5" x 37.5" PDF file (16.5MB).
Countywide Vertical Datum Conversion Factors in Illinois
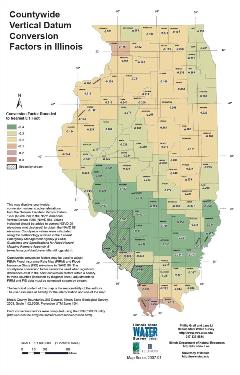 This map displays countywide, conversion values to adjust elevations from the
National Geodetic Vertical Datum 1929 (NGVD 29) to the North American Vertical
Datum 1988 (NAVD 88). Values indicated should be added to current NGVD 29
elevations (not displayed) to obtain the NAVD 88 elevation. Countywide values
were calculated using the methodology outlined in the Federal Emergency
Management Agency (FEMA) Guidelines and Specifications for Flood Hazard
Mapping Partners Appendix B.
Point conversion factors were computed using the CORPSCON utility.
The Countywide Vertical Datum Conversion Factors map is available online as a 11" x 17" PDF file (450k).
Community Surface Water Supplies Year 2000
Community Surface Water Supplies Year 2000 - Community water supplies provide nearly 90% of Illinois’ citizens with water for residential use. The Illinois Environmental Protection Agency (IEPA) defines a “community water supply” as a public water supply that provides potable water to a minimum of 15 service connections used by year-round residents or regularly serves at least 25 year-round residents. The IEPA issues permits for operation of water supplies serving the public. Data from the Illinois Water Inventory Program (IWIP) show that 1998 total withdrawals by all public water supply systems exceeded 1,700 million gallons per day (mgd). Community systems withdrawing surface water accounted for 84% of those withdrawals, with Lake Michigan withdrawals exceeding 1,000 mgd. Other surface water sources include interstate rivers (Mississippi and Ohio), intrastate rivers (Fox, Illinois, Kankakee, Kaskaskia, and Little Wabash), and 96 reservoirs.
Due to Homeland Security issues, we can not freely distribute this map through our website. For a copy, please send a Letter of Intent on your company’s letterhead stating why you would like a copy of this map. This map is prohibited from being displayed publicly. Please include contact information, as we may call to verify the information. Upon receipt of the letter, it will be forwarded to the Survey Director for approval. You may fax it to 217-333-4983 (please include the web address/URL of this page on the FAX cover sheet) or mail it to:
Illinois State Water Survey
2204 Griffith Drive
Champaign, IL 61820-7495
Major Watersheds of Illinois
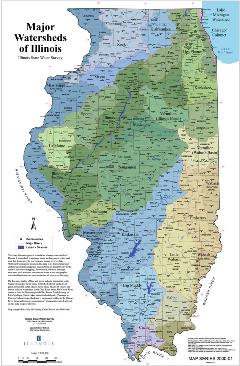 This map illustrates general boundaries of major watersheds of Illinois.
Shades of blue and green indicate watersheds in the Mississippi River basin.
Watersheds with shades of green are located in the Illinois River basin.
Shades of yellow and brown indicate watersheds in the Ohio River basin. The
Cache River drains to both the Mississippi and Ohio Rivers. Drainage to Lake
Michigan is in the Great Lakes basin. Its watershed is shaded pink. A
watershed is often considered synonymous with drainage basin, and in this
context it is the land area that directly drains to a common stream, river, or
lake. Watershed boundaries follow topographic highs. Artificial drainage
structures such as canals may convey water across topographic watershed
boundaries in some areas shown. Features shown on this map are accurate to the
scale at which they were originally developed. Communities are displayed as
space allowed.
LaMBert Conformal Conic projection based on standard parallels 30° and 45°.
The Major Watersheds of Illinois map is available online as a 26" x 38" PDF file (2.1MB).
Illinois Community Water Supply Wells
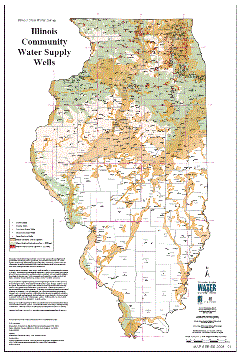 Illinois has abundant buried groundwater reserves that supply millions of gallons of groundwater per day for public, agricultural, and industrial/commercial use. These aquifers are unevenly distributed throughout the state. Fortunately, surface water or a coMBination of groundwater and surface water is available to meet required needs in most cases where groundwater resources are marginal.
This map depicts community water supply wells in relation to the major aquifer systems in Illinois. A community water supply is defined as “a public water system which serves at least 15 service connections used by residents or regularly serves at least 25 residents for at least 60 days per year.” Only community wells classified as active in the ISWS Public-Industrial-Commercial Survey database for the Year 2003 are shown.
The Illinois Community Water Supply Wells map is available online as a 28" x 40" PDF file (3.9MB).
Illinois River Watershed
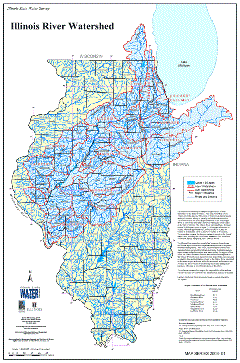
The Illinois River watershed (shaded in light blue) is of vital importance to the state of Illinois. This large watershed covers 44 percent of the state and 90 percent of Illinois’ population resides within 55 counties wholly or partially included in the watershed. The Illinois River, one of the major tributaries of the Mississippi River, is part of the only inland waterway linking the Great Lakes to the Gulf of Mexico. The Illinois River watershed has a drainage area of 28,906 square miles or sq mi (75,156 square kilometers or sq km), of which approximately 3,058 sq mi (4,920 sq km) are located in Indiana and 1,070 sq mi (1,722 sq km) in Wisconsin. The watershed contains the drainage basins of several of the Illinois’ major rivers including the Des Plaines, Kankakee, Fox, Vermilion, Mackinaw, Spoon, Sangamon, and La Moine Rivers.
The Illinois River Watershed map is available online as a 26" x 38" PDF file (6.2MB).
County-Level Maps
2012 Center Pivot Irrigation in Lee County, Illinois
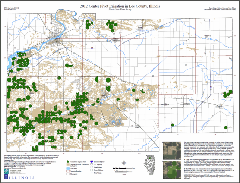
This map displays the center pivot irrigation systems in use in Lee County, Illinois during the 2012 growing season. Sandy soils are common in Lee County and are either sand and gravels deposited as glacial outwash or dune sands formed by the wind. The saturated hydraulic conductivity layer represents soils with a value of ≥ 10 micrometers per second in the upper 30 inches of soil, a value typical of sandy soils in Illinois. Saturated hydraulic conductivity is a measure of the ease with which water will move through a soil, and values typically increase with the sand content. Traditionally, irrigation is needed where sandy soils are present due to their low water-holding capacity and high hydraulic conductivity. This layer provides a general location for areas that are more likely to require irrigation for a successful crop.
The USDA collects aerial images during the crop growing season through the National Agricultural Imagery Program (NAIP) and makes them available through the USDA Geospatial Data Gateway. The NAIP images were examined for circular irrigation patterns, and field boundaries were traced to create a map layer. A total of 283 center pivot systems were identified in Lee County during the summer of 2012, representing 26,476 acres of farmland. USDA (2007 NASS Census) reported 395,624 total acres of farmland in Lee County, suggesting that center pivot irrigation is used in approximately 7 percent of all farmland in this county.
This map of Center Pivot Irrigation in Lee County, Illinois is available online as a 34" x 26" PDF file (5.1MB).
Center Pivot Irrigation in Mason County, Illinois
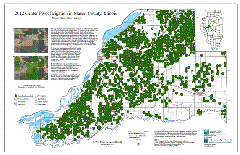
Mason County has the most irrigated acreage in the state, nearly double that of any other Illinois county. Sandy soils and annual precipitation of about 38 inches promote significant groundwater recharge. An extensive shallow aquifer provides an abundant source of water that, historically, has not led to any long-term lowering of water levels or depletion of the aquifer even as irrigation has significantly expanded. The Imperial Valley Water Authority, a local government entity that regulates non-agricultural high capacity wells in Mason County and four townships in Tazewell County, estimated groundwater withdrawals for irrigation in Mason County in 2012 to be a little over 70 billion gallons, which equates to 587 million gallons a day (MGD) across a 120-day growing season.
This map displays the center pivot irrigation systems in use in Mason County, Illinois during the 2012 growing season. Center pivot irrigation imprints identifiable circular patterns on the landscape that can be visible in aerial images. The USDA collects aerial imagery (National Agricultural Imagery Program) and makes them available through the USDA Geospatial Data Gateway. The NAIP images were examined for circular irrigation patterns, and field boundaries were digitized using ArcGIS version 10.0 to create a map layer. In total, 1553 fields were identified as using center pivot systems in Mason County during the summer of 2012, representing 135,684 acres of farmland and approximately 50 percent of all farmland in Mason County.
This map of Center Pivot Irrigation in Mason County is available online as a 34" x 22" PDF file (6.1MB).
Center Pivot Irrigation in Tazewell County, Illinois
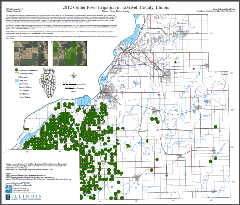
This map displays the center pivot irrigation systems in use in Tazewell County, Illinois during the 2012 growing season. An extensive shallow aquifer provides an abundant source of water that, because of adequate rainfall and subsequent recharge, historically has not led to any long-term reduction in water levels or depletion of the aquifer even as irrigation has significantly expanded. The Imperial Valley Water Authority is a local government entity that regulates non-agricultural high-capacity wells in parts of six townships in Tazewell County and all of Mason County. The IVWA estimated groundwater withdrawals for irrigation in Tazewell County in 2012 to be approximately 28 billion gallons, which equates to about 233 million gallons a day (MGD) across a 120-day growing season. Together, Mason and Tazewell Counties accounted for nearly 100 billion gallons of groundwater withdrawal for irrigation in 2012.
The USDA collects aerial imagery (National Agricultural Imagery Program) and makes them available through the USDA Geospatial Data Gateway. The NAIP images were examined for circular irrigation patterns, and field boundaries were digitized using ArcGIS version 10.0 to create a map layer. A total of 449 fields were identified as using center pivot systems in Tazewell County during the summer of 2012, representing 42,419 acres of farmland. USDA reported 337,376 total acres of farmland in Tazewell County, suggesting that center pivot irrigation systems are used to irrigate approximately 13 percent of all farmland in this county (2012, NASS Census).
This map of Center Pivot Irrigation in Tazewell County is available online as a 28" x 24" PDF file (4.1MB).
2012 Center Pivot Irrigation in Whiteside County, Illinois
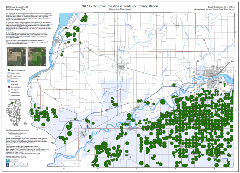
Soils in the southern part of Whiteside County are commonly sandy and require irrigation, for which the Sankoty Aquifer is the primary water source. The Sankoty Aquifer occupies the ancestral Mississippi River Valley, which underlies the southern half of Whiteside County, and can provide the amount of groundwater necessary to sustain high capacity wells that are capable of pumping well over 1,000 gallons per minute.
This map displays the center pivot irrigation systems in use in Whiteside County, Illinois, during the 2012 growing season. Center pivot irrigation imprints identifiable circular patterns on the landscape which can be visible in aerial images. The USDA collects aerial images (National Agricultural Imagery Program) and makes them available through the USDA Geospatial Data Gateway. The NAIP images were examined for circular irrigation patterns, and field boundaries were digitized using ArcGIS version 10.0 to create a map layer. In total, 606 fields were identified as using center pivot systems in Whiteside County during the summer of 2012, representing 60,122 acres of farmland and approximately 15 percent of all farmland in this county.
This map of 2012 Center Pivot Irrigation in Whiteside County is available online as a 36" x 26" PDF file (7.4MB).
Examples of Other Survey Maps
Estimated Potential Yield of Sand and Gravel Aquifers
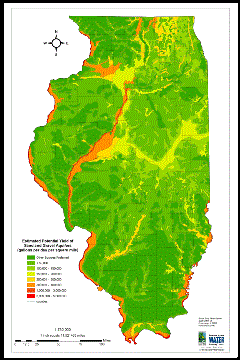
Taken from An Analysis of Groundwater Use to Aquifer Potential Yield in Illinois, Wehrmann, H. Allen, Sean V. Sinclair, and Timothy P. Bryant., 2003 Illinois State Water Survey, Champaign, IL, ISWS CR 2004-11.
Abstract Excerpt: Proper water resource planning and management requires a firm understanding of water use and water resource availability. This report summarizes a comparison of Year 2000 groundwater withdrawals against estimated aquifer potential yields. The comparison is presented as a ratio of groundwater use (withdrawals) to groundwater yield (i.e., potential aquifer yield) on a township basis. Geographical Information System (GIS) technology was used to determine township yield ratios for three aquifer types (sand-and-gravel, shallow bedrock, and deep bedrock).
This map of the Estimated Potential Yield of Sand and Gravel Aquifers is available online as a 24" x 36" PDF file (800k).
Peoria Lake Bathymetry
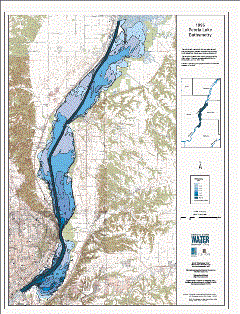
The bathymetric contours in this map were derived from a triangulated irregular network (TIN) built using the Z values from the surveyed cross-section points. LaMBert Conformal Conic projection based on standard parallels 30° and 45°.
This map of 1996 Peoria Lake Bathymetry is available online as a 35" x 46" PDF file (3.1MB).