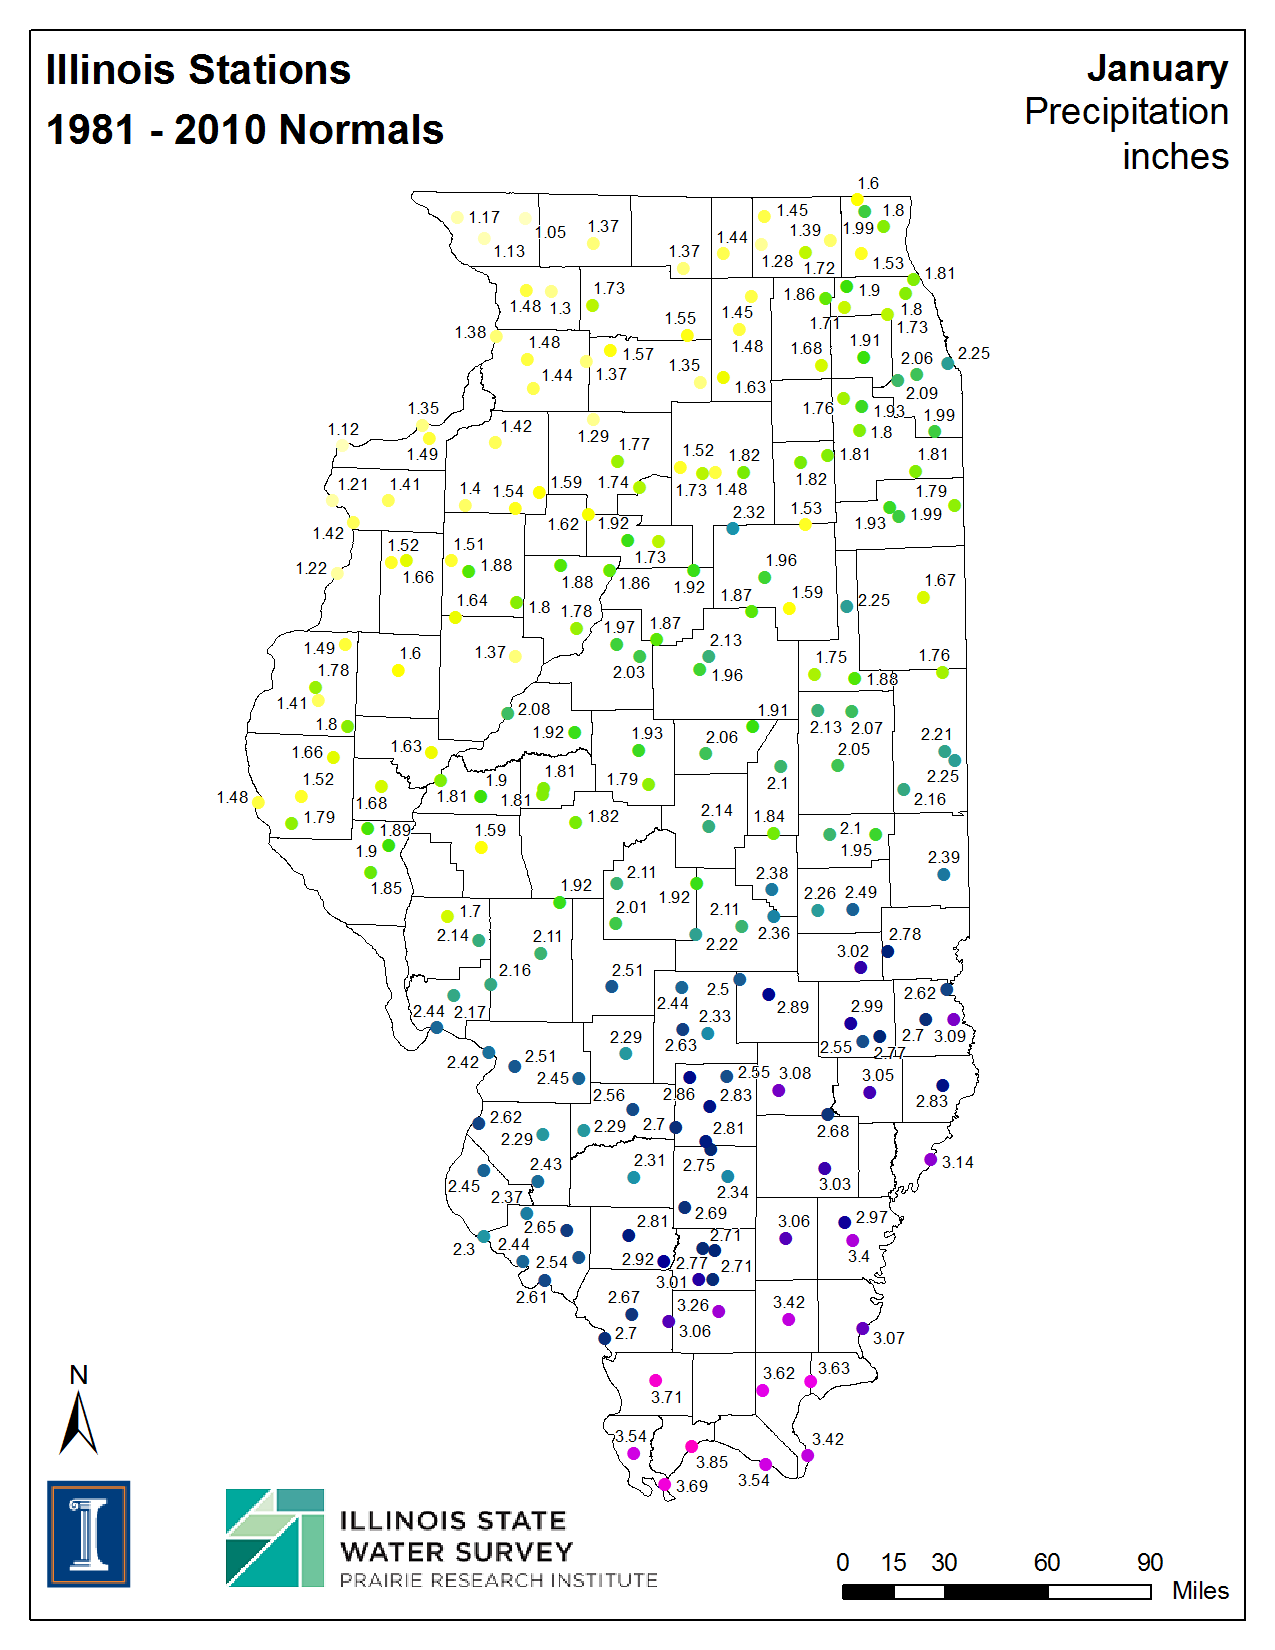
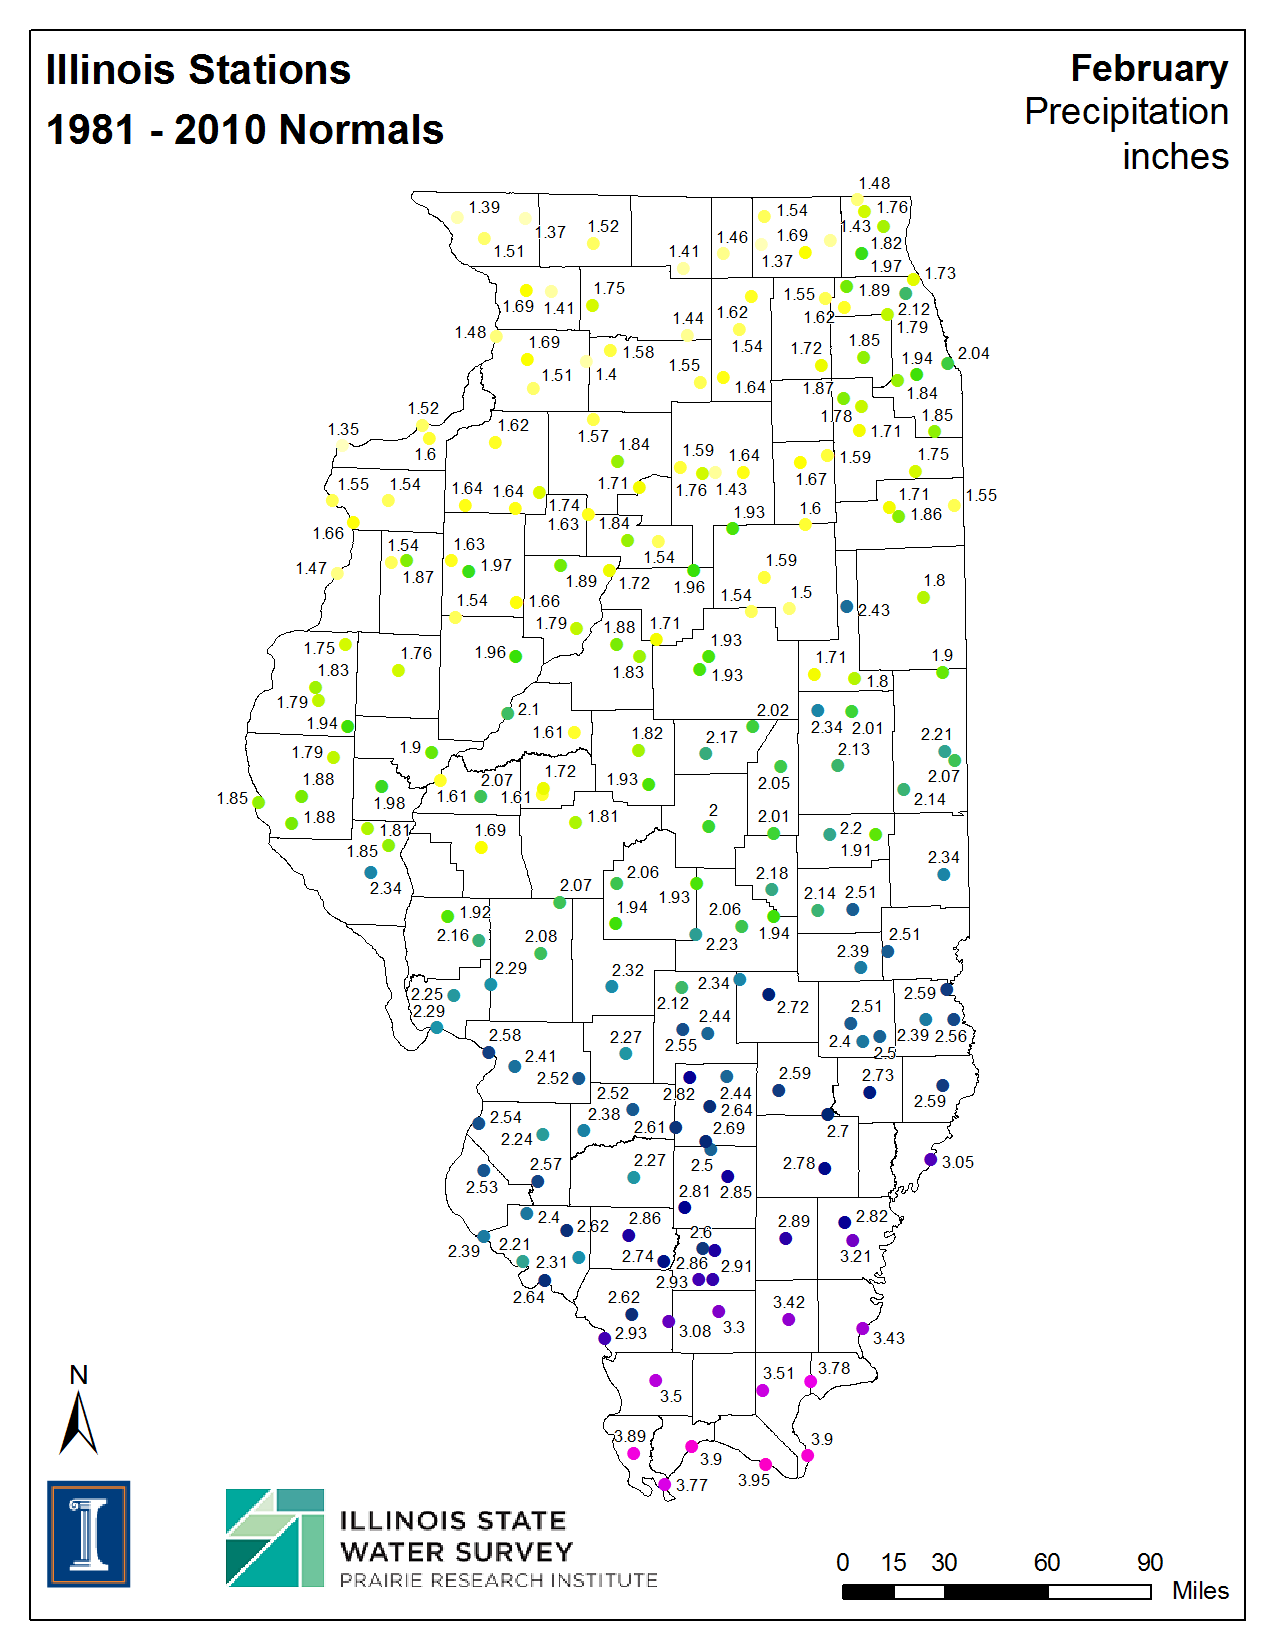
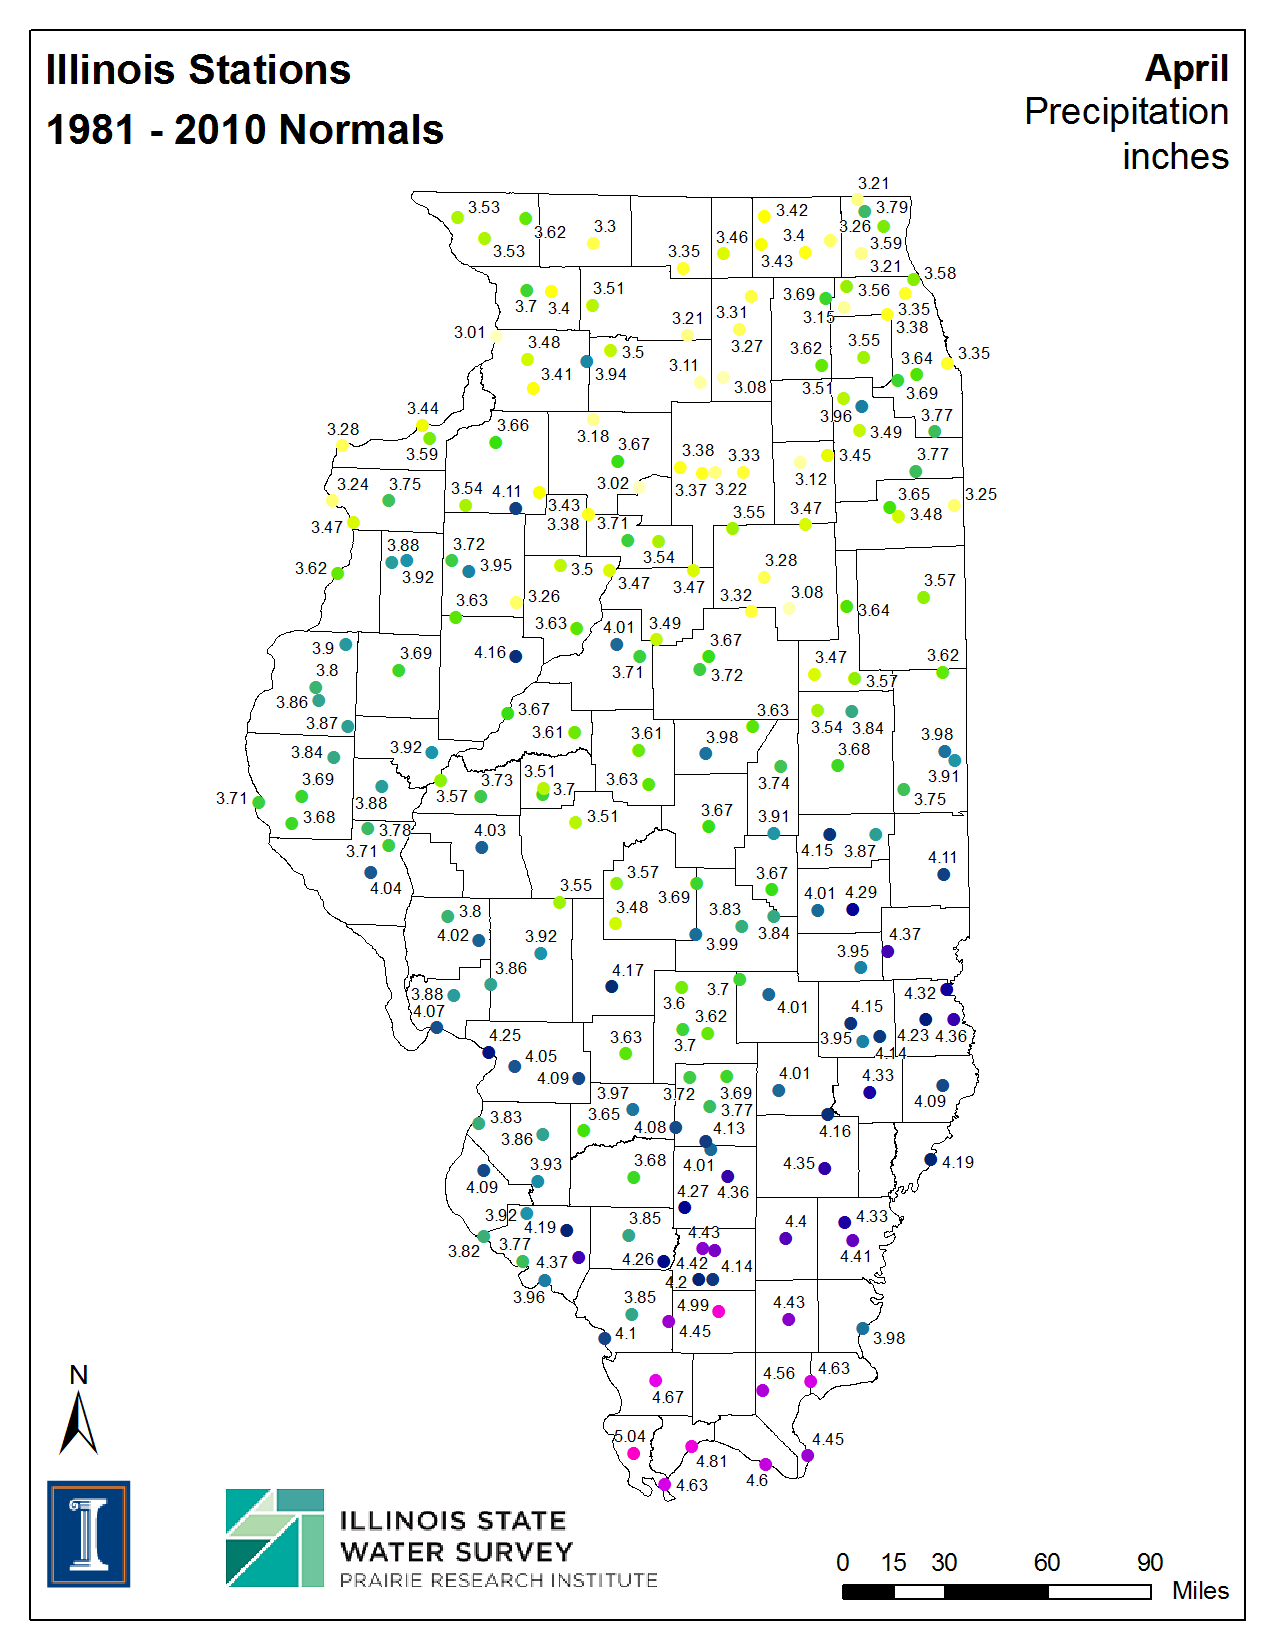
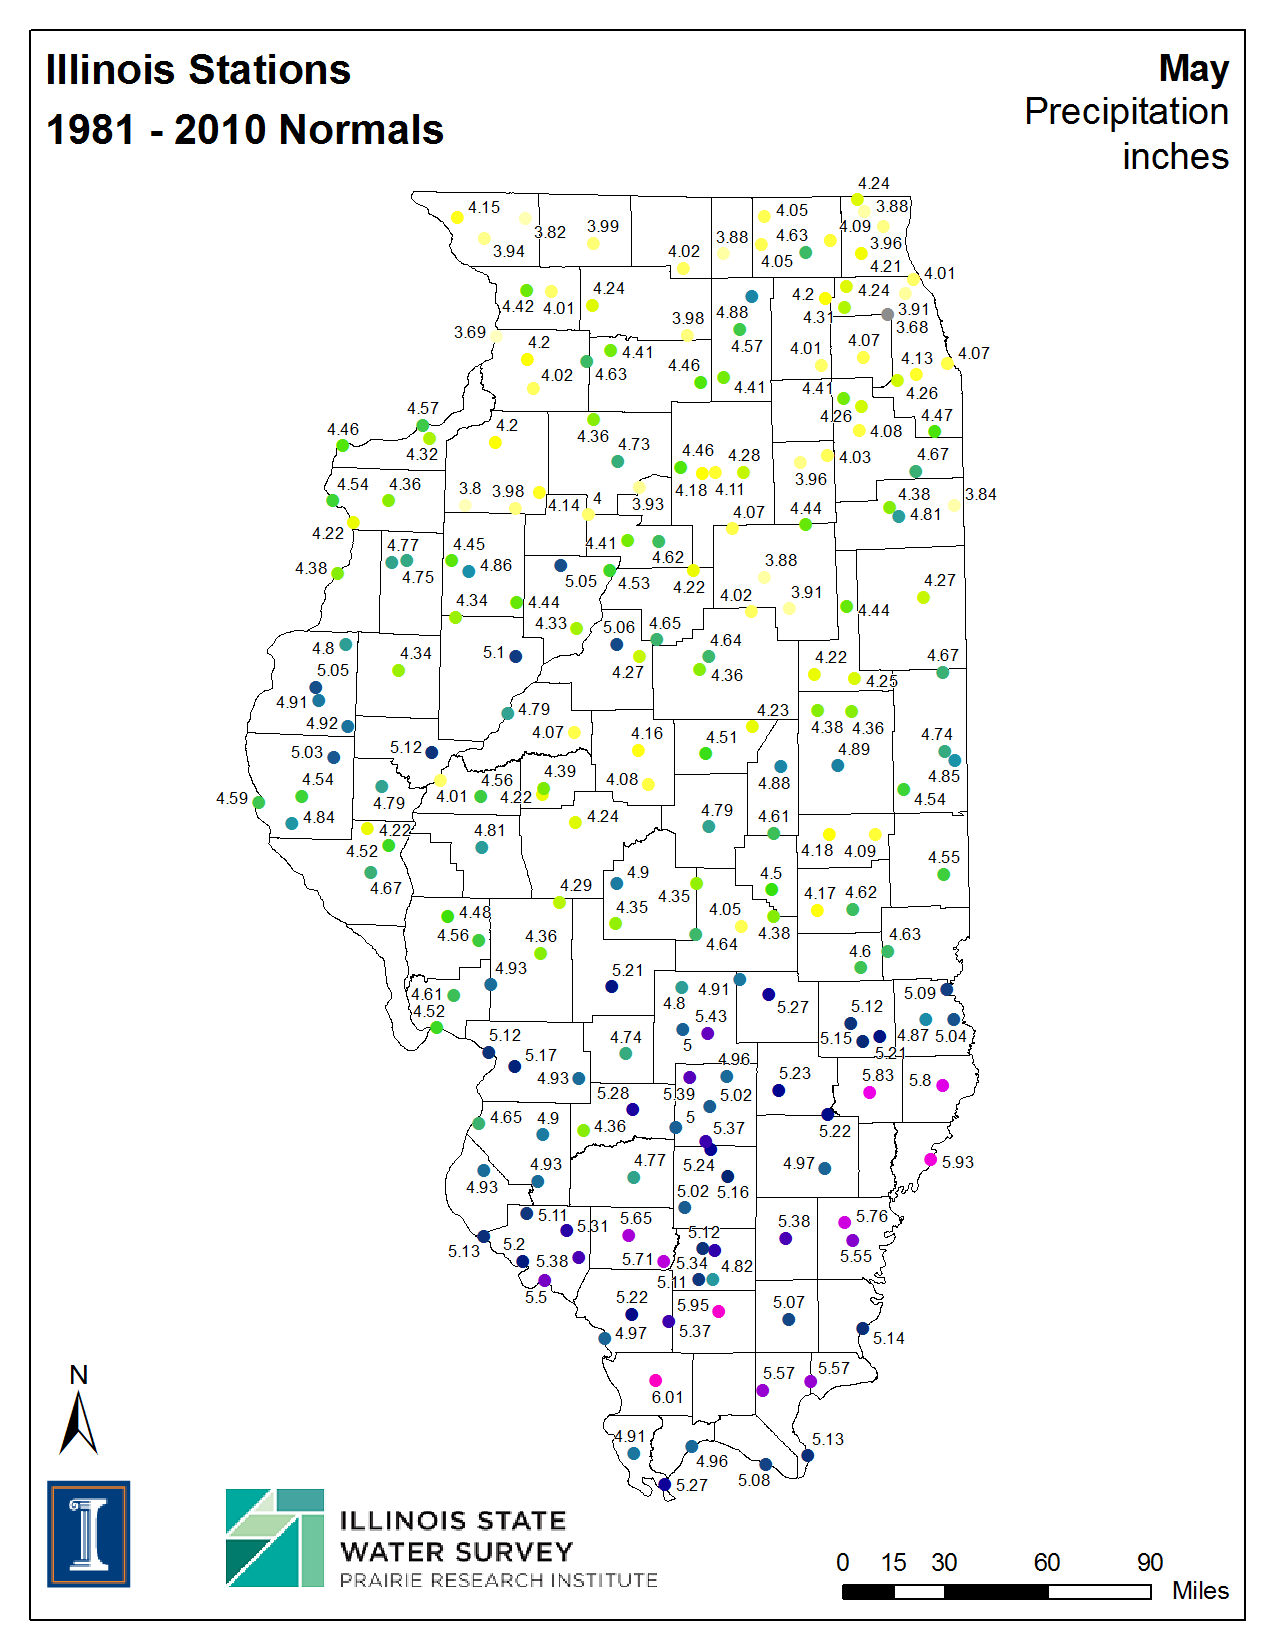
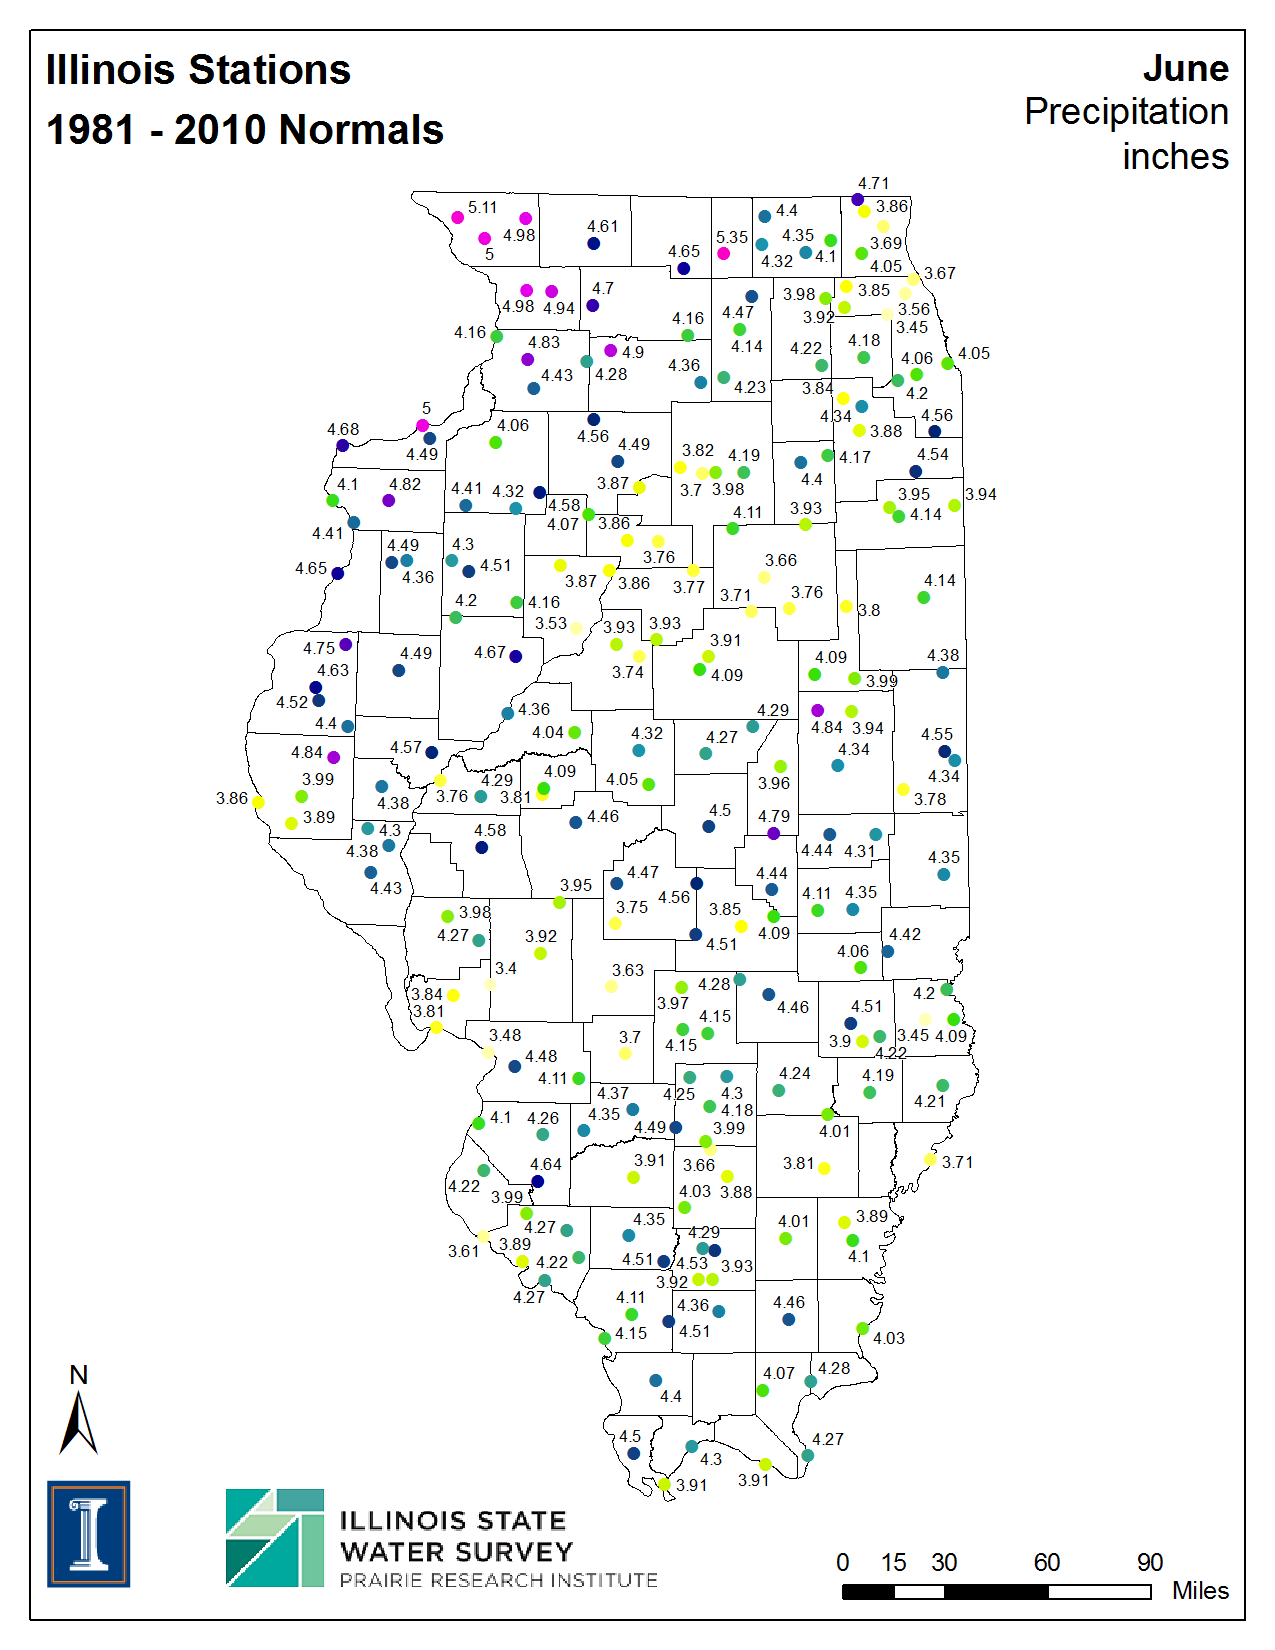
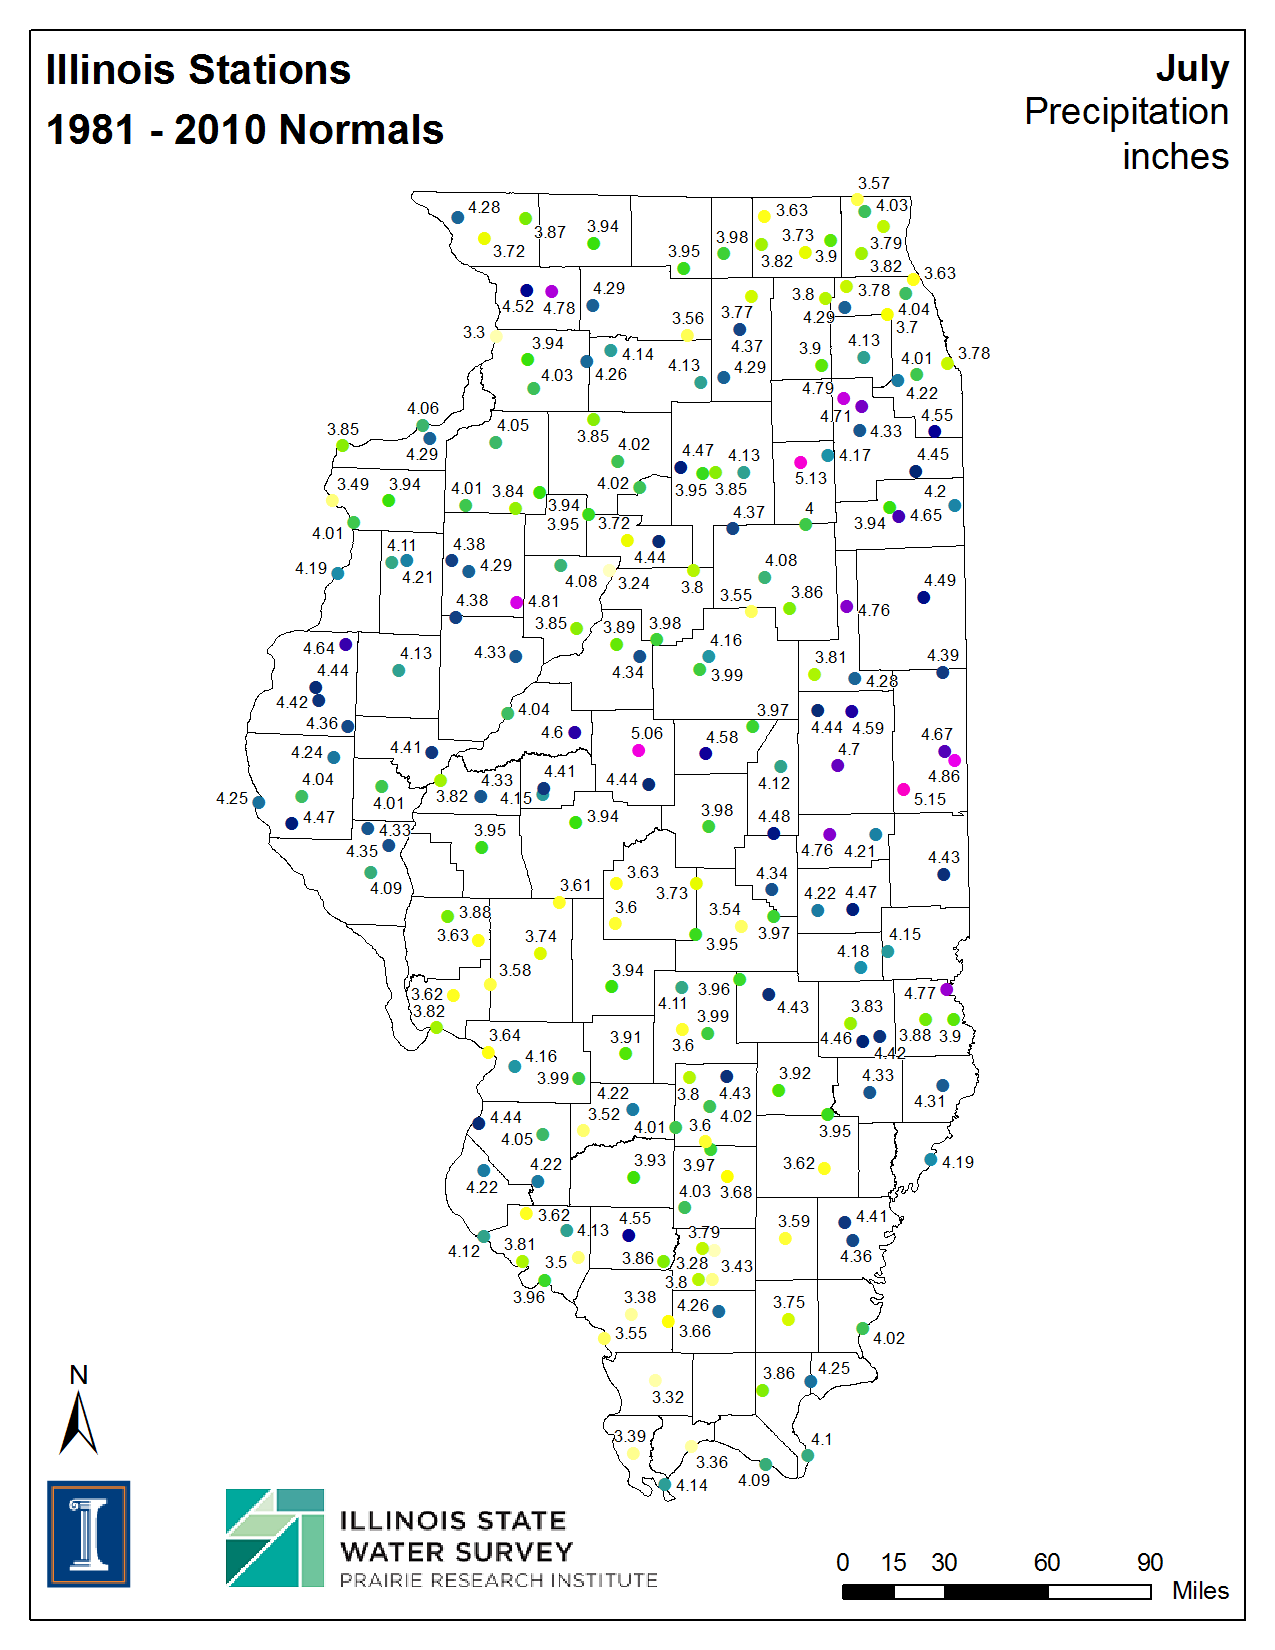
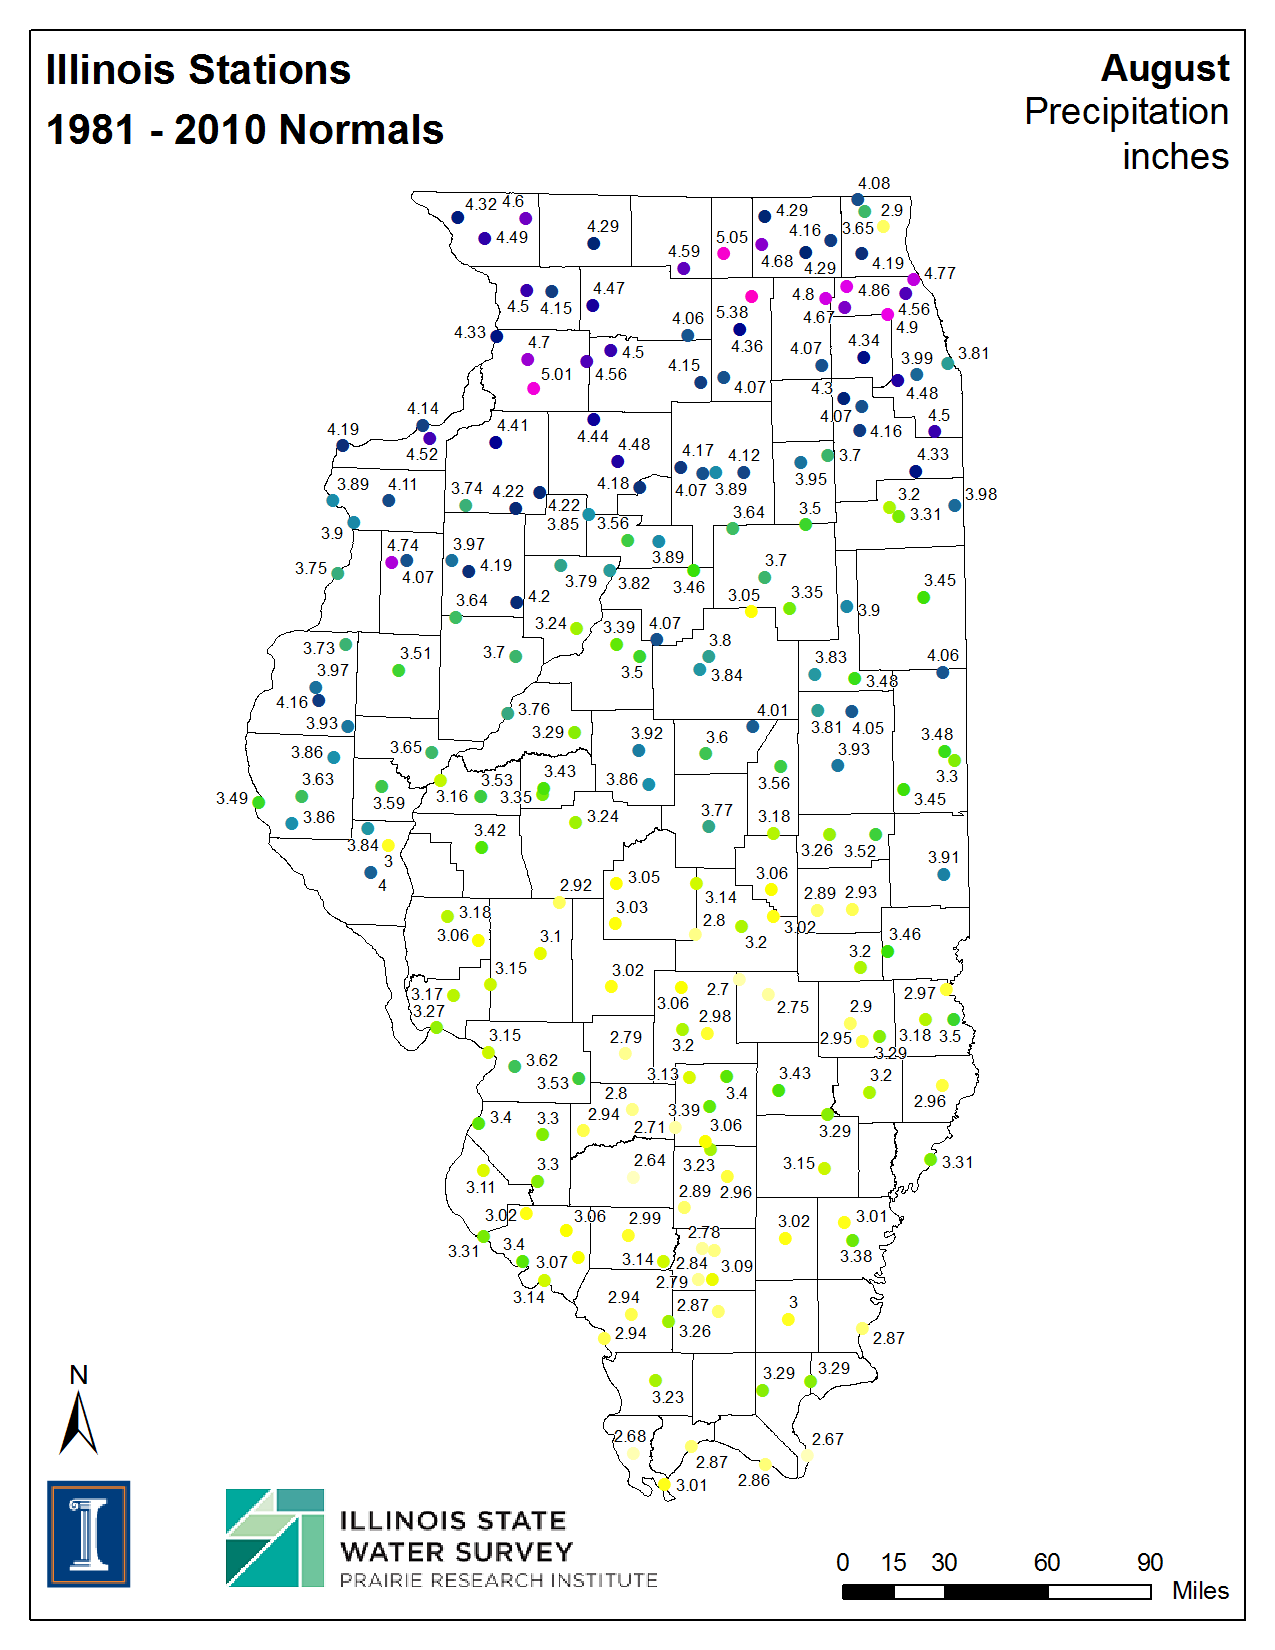
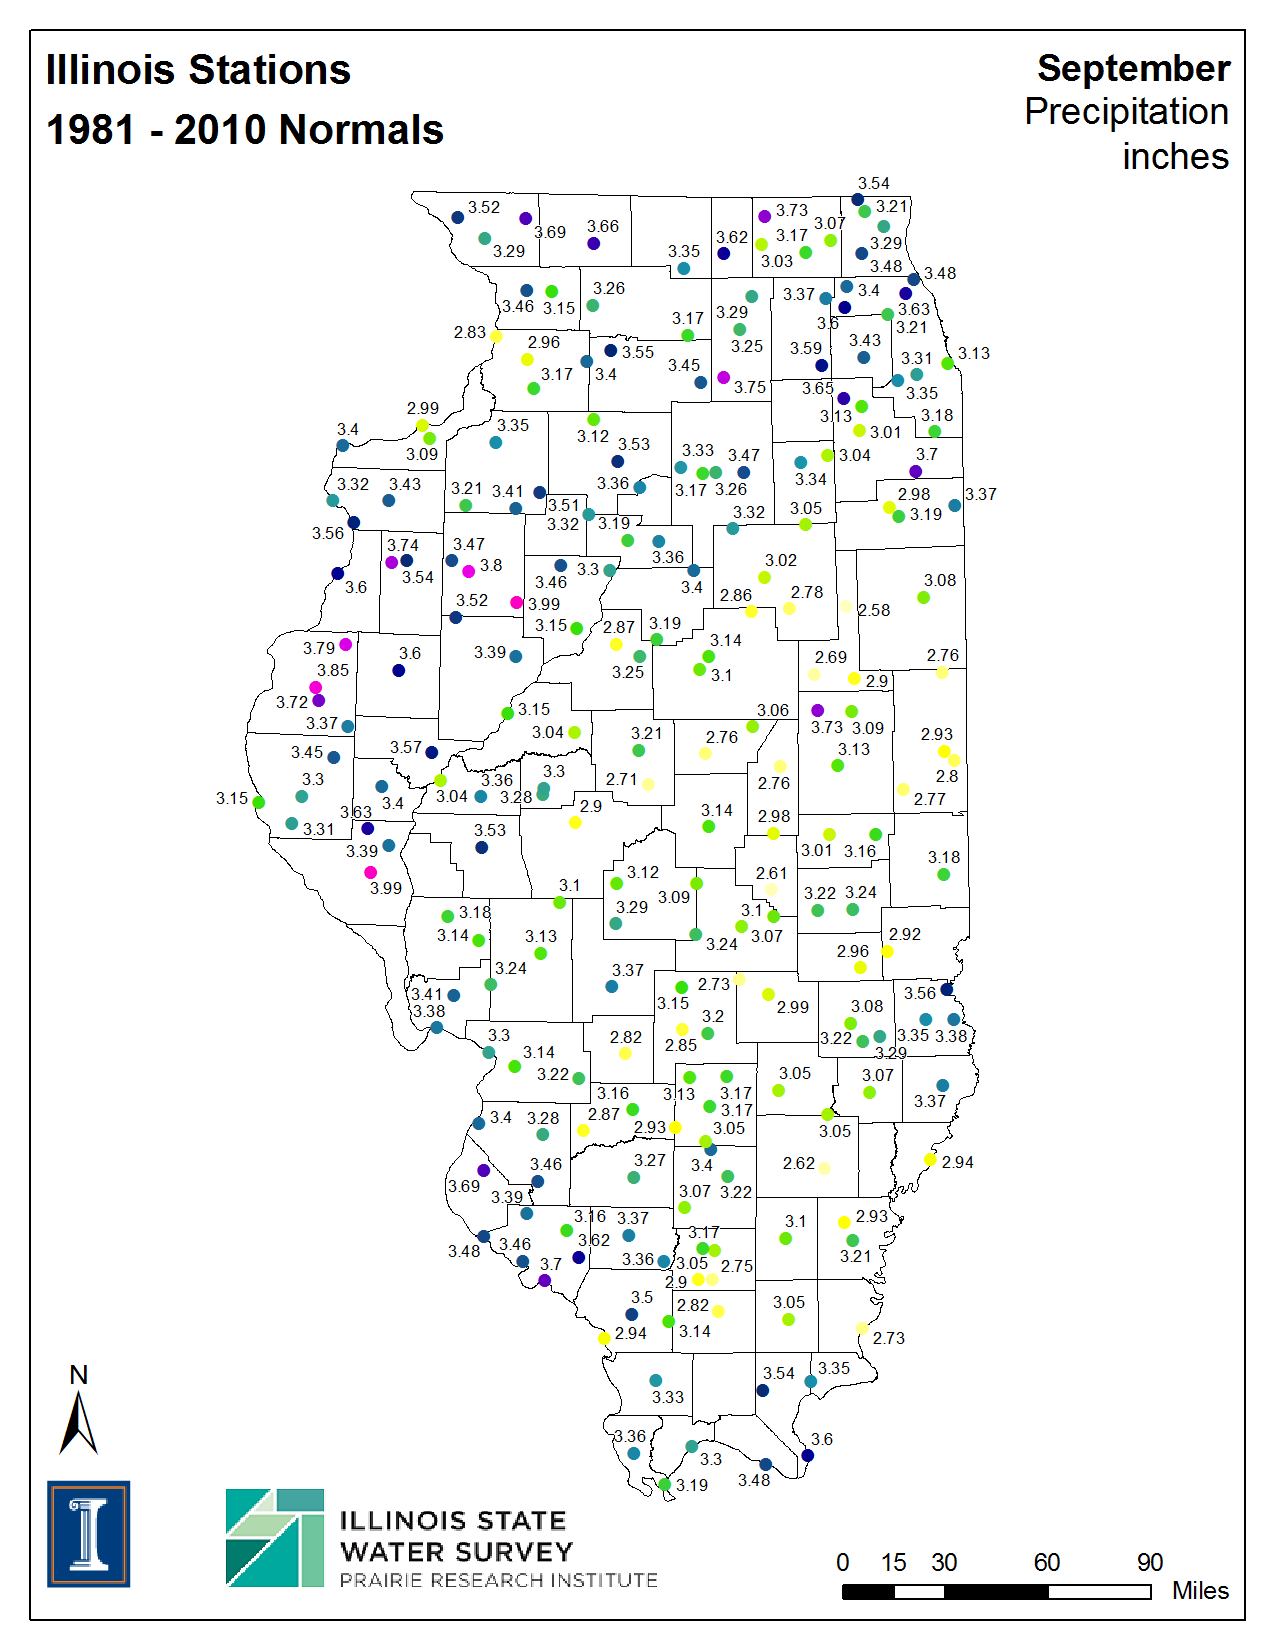
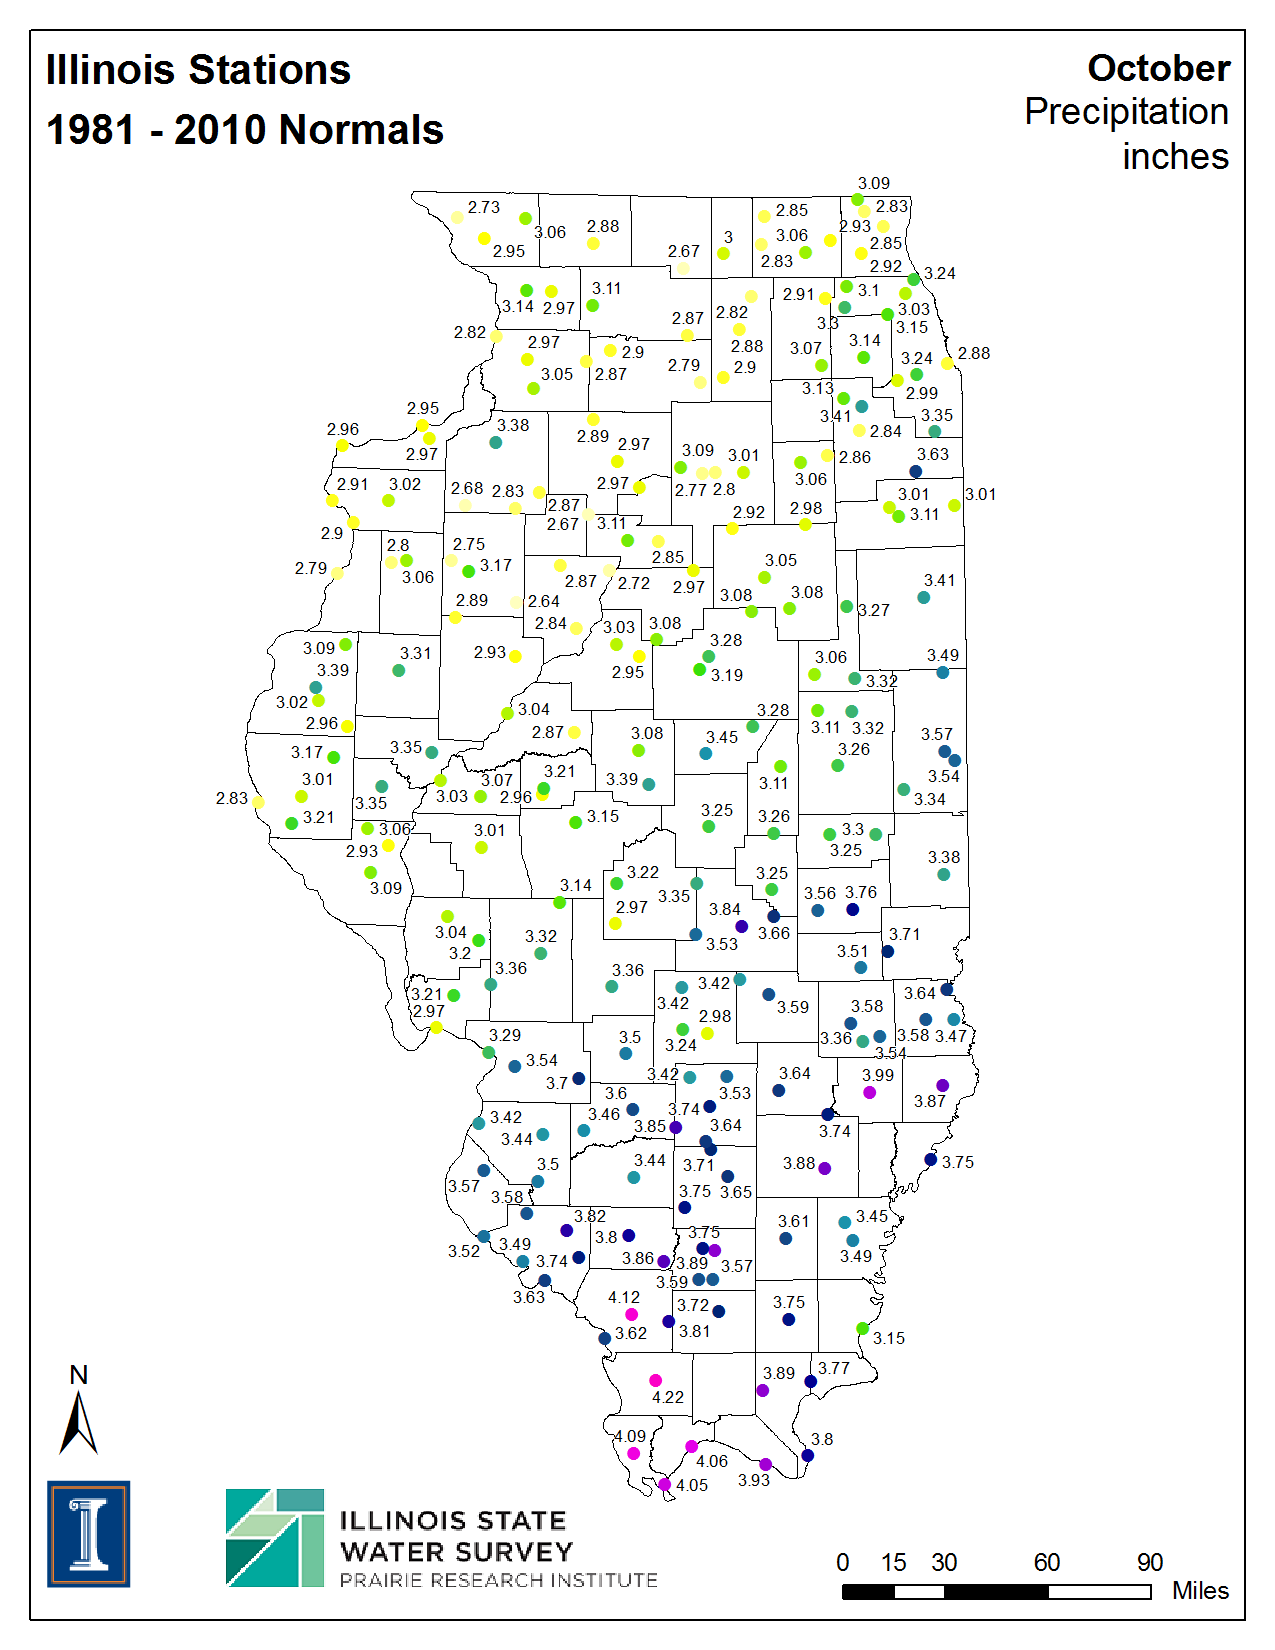
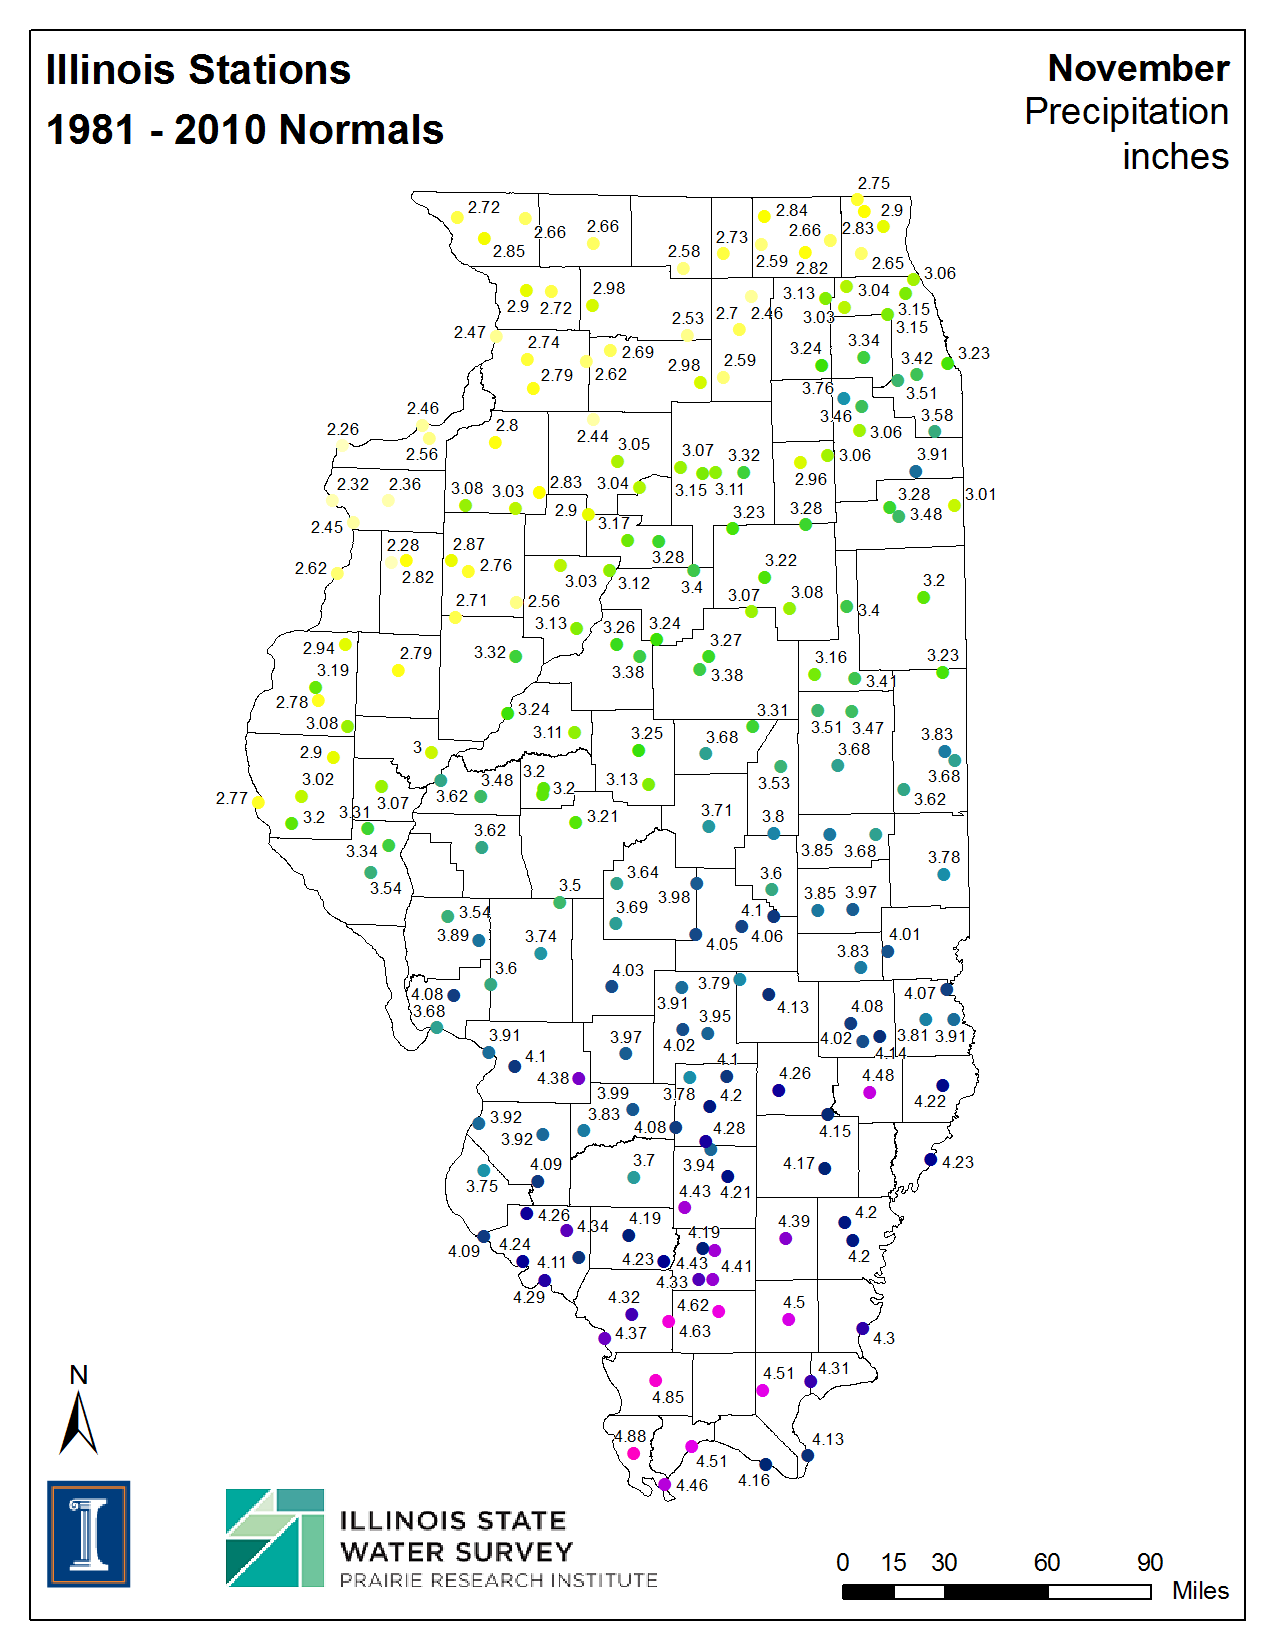
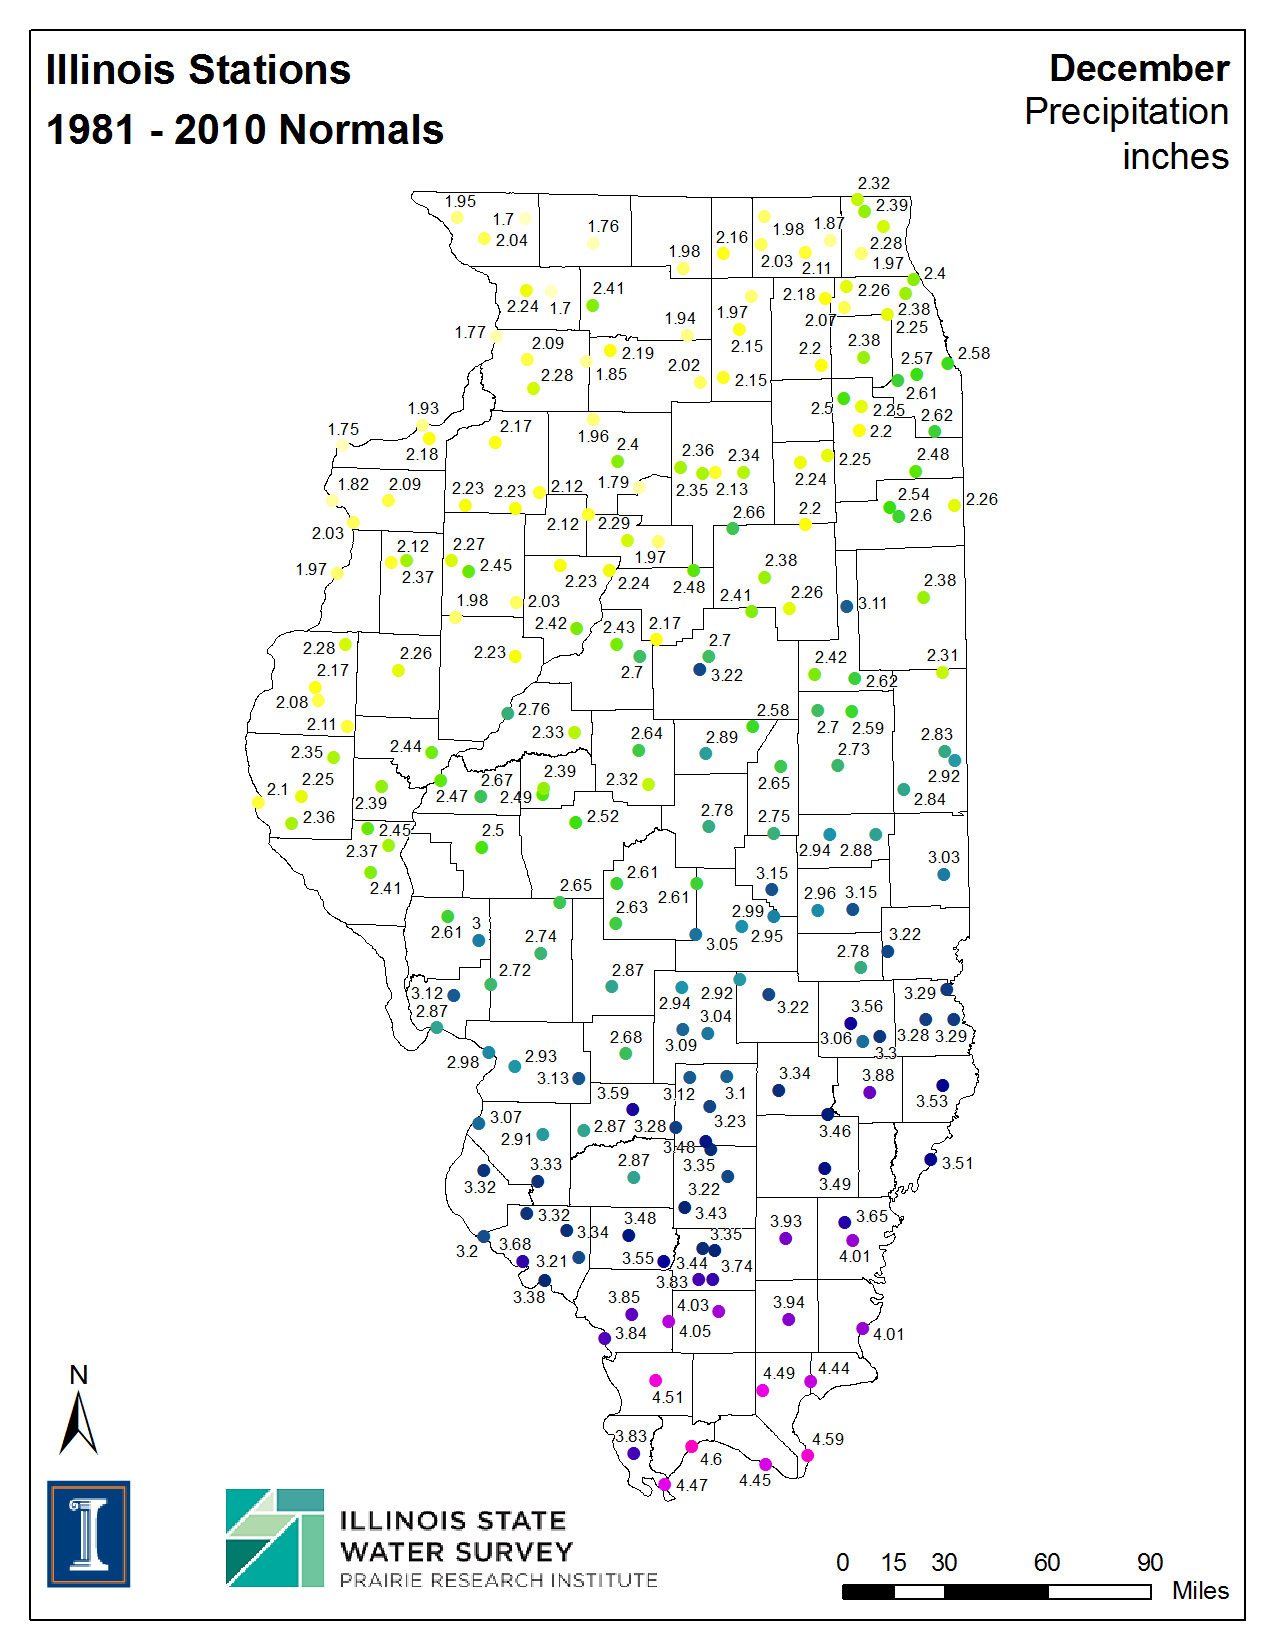
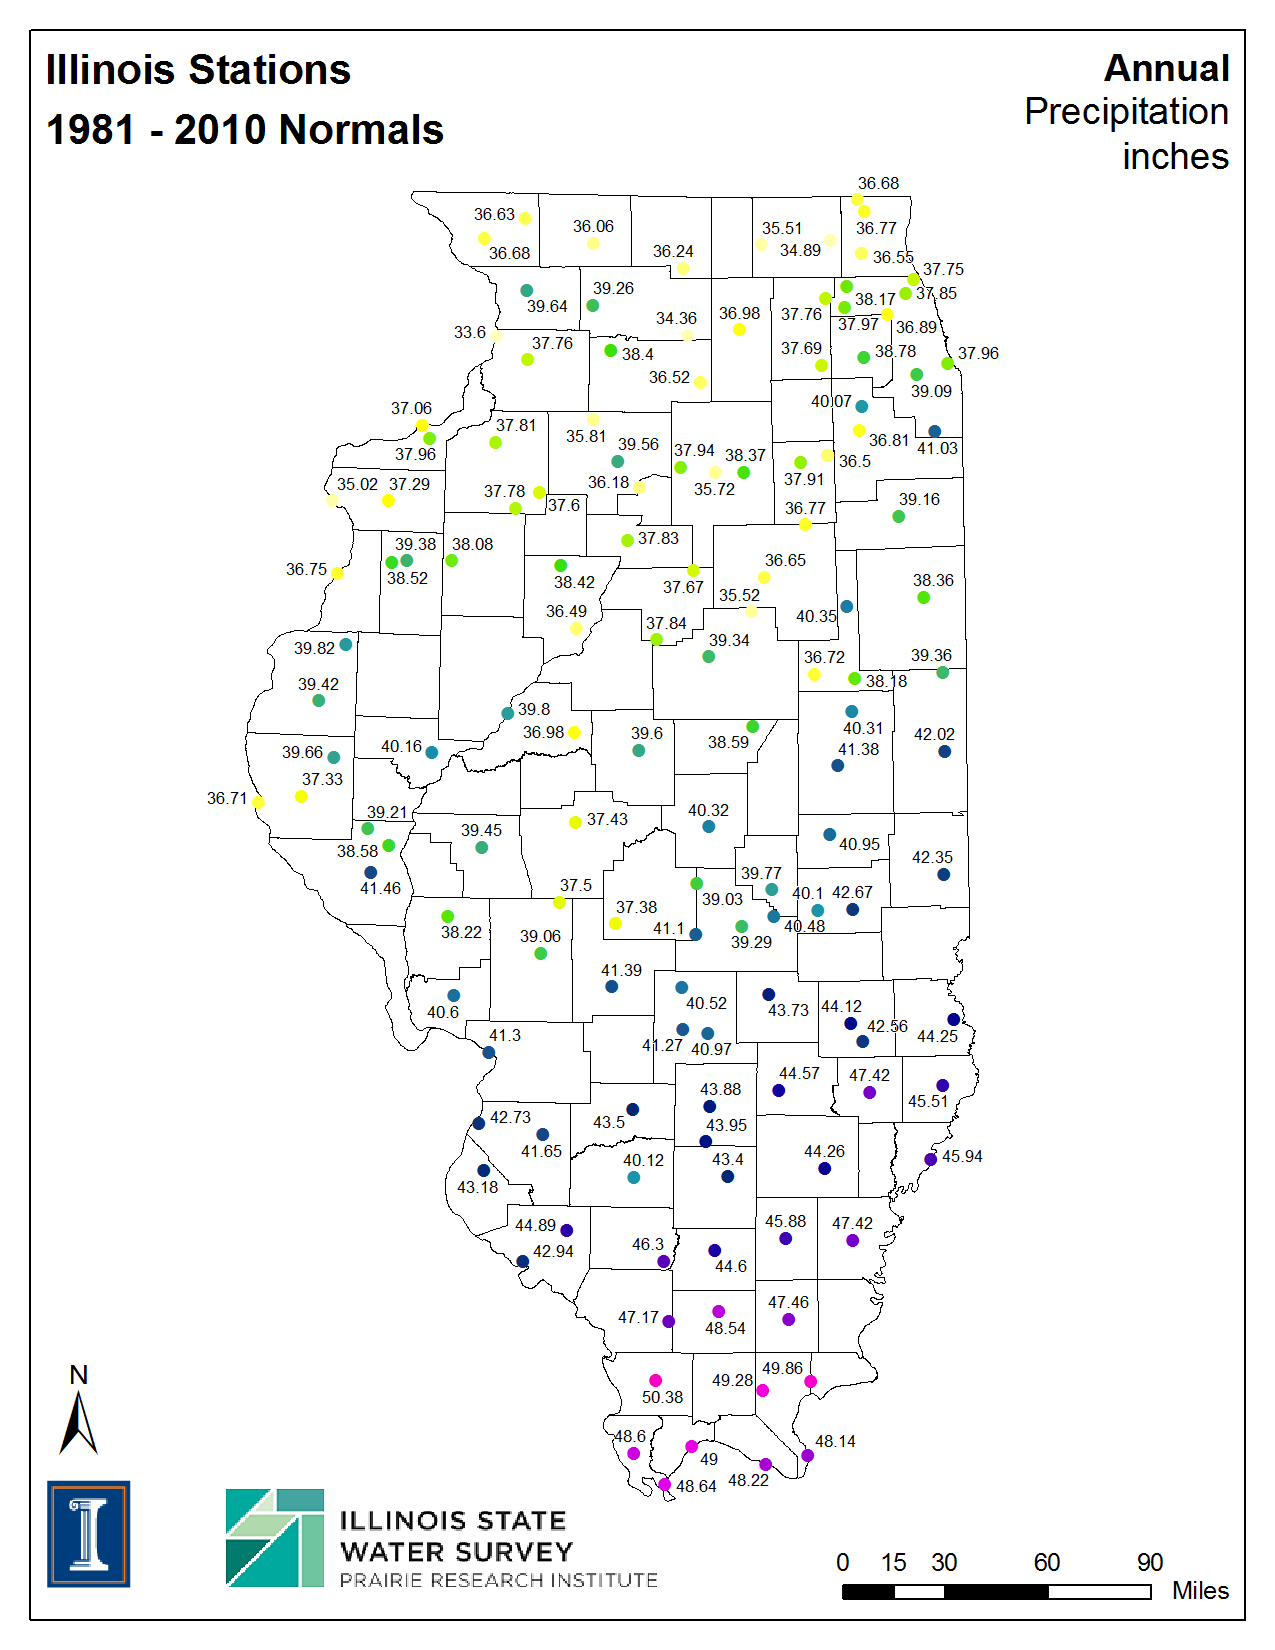
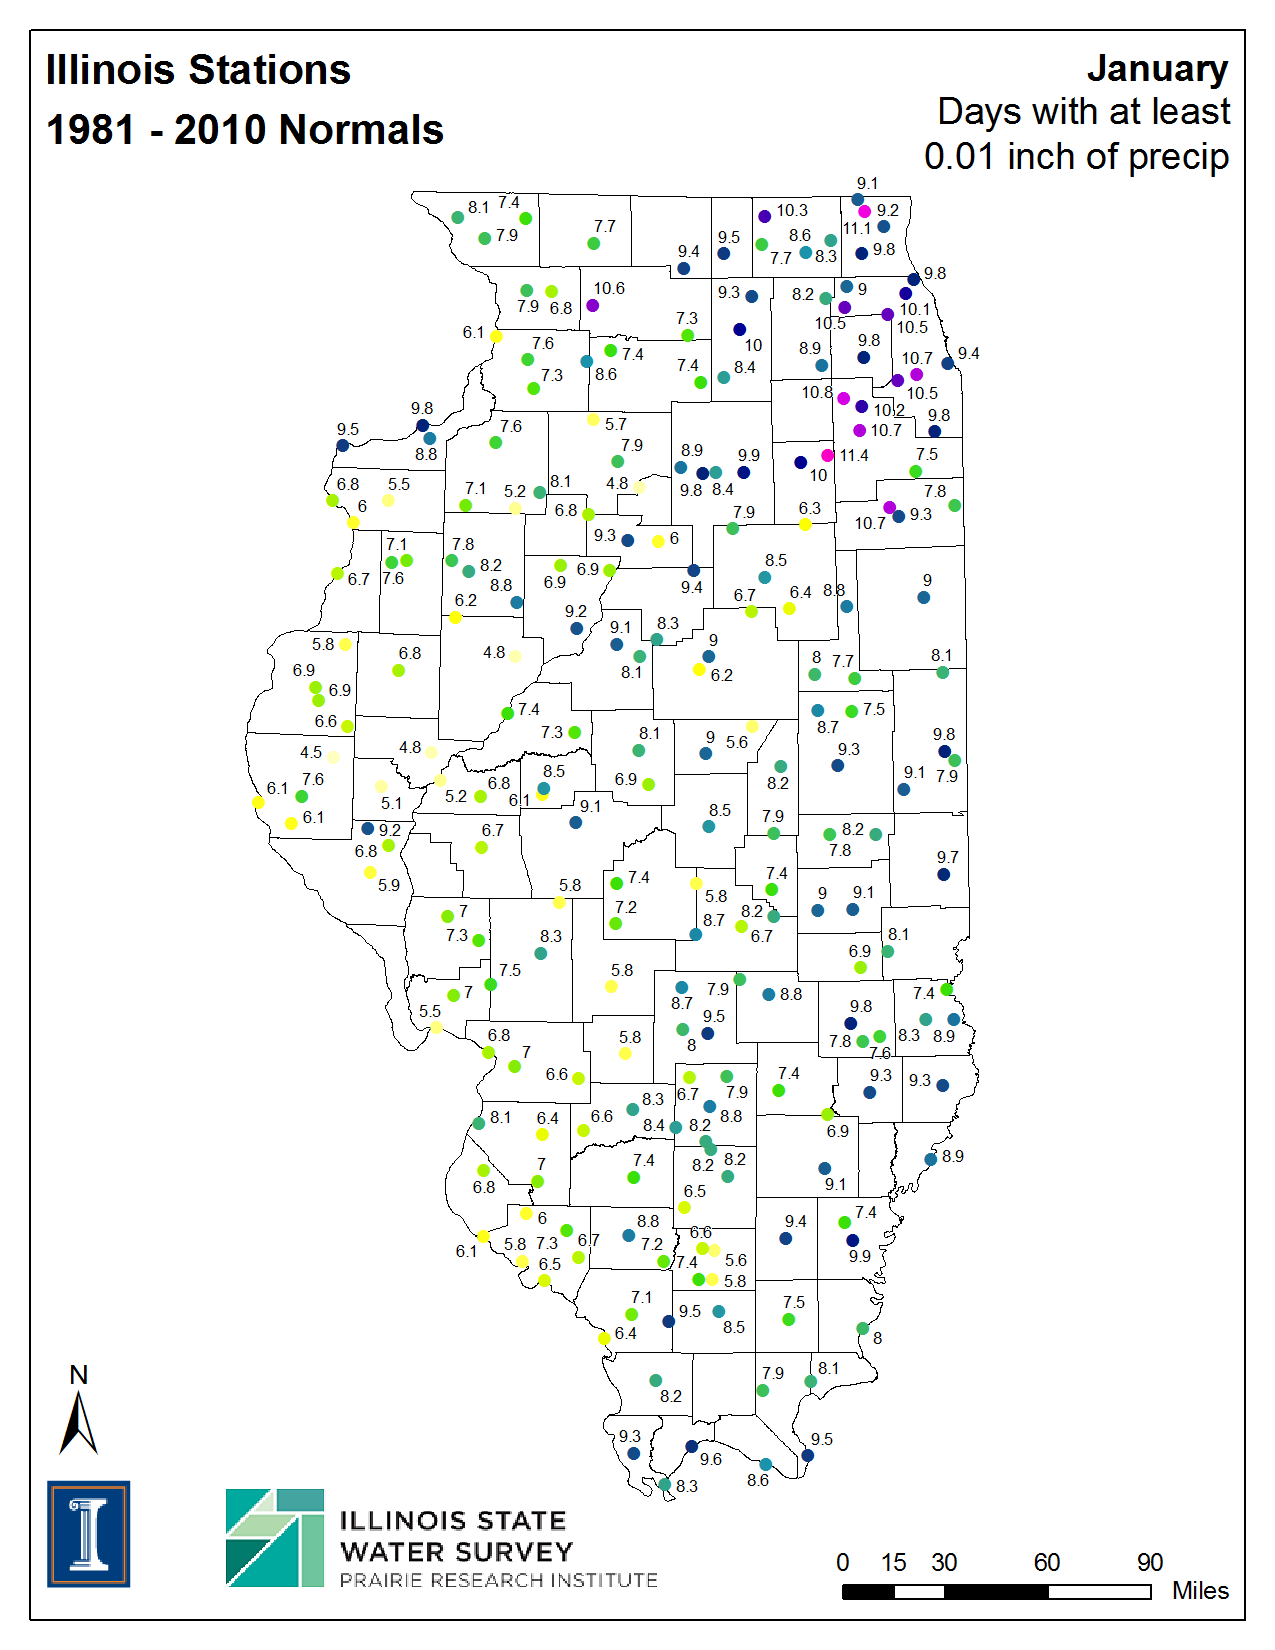
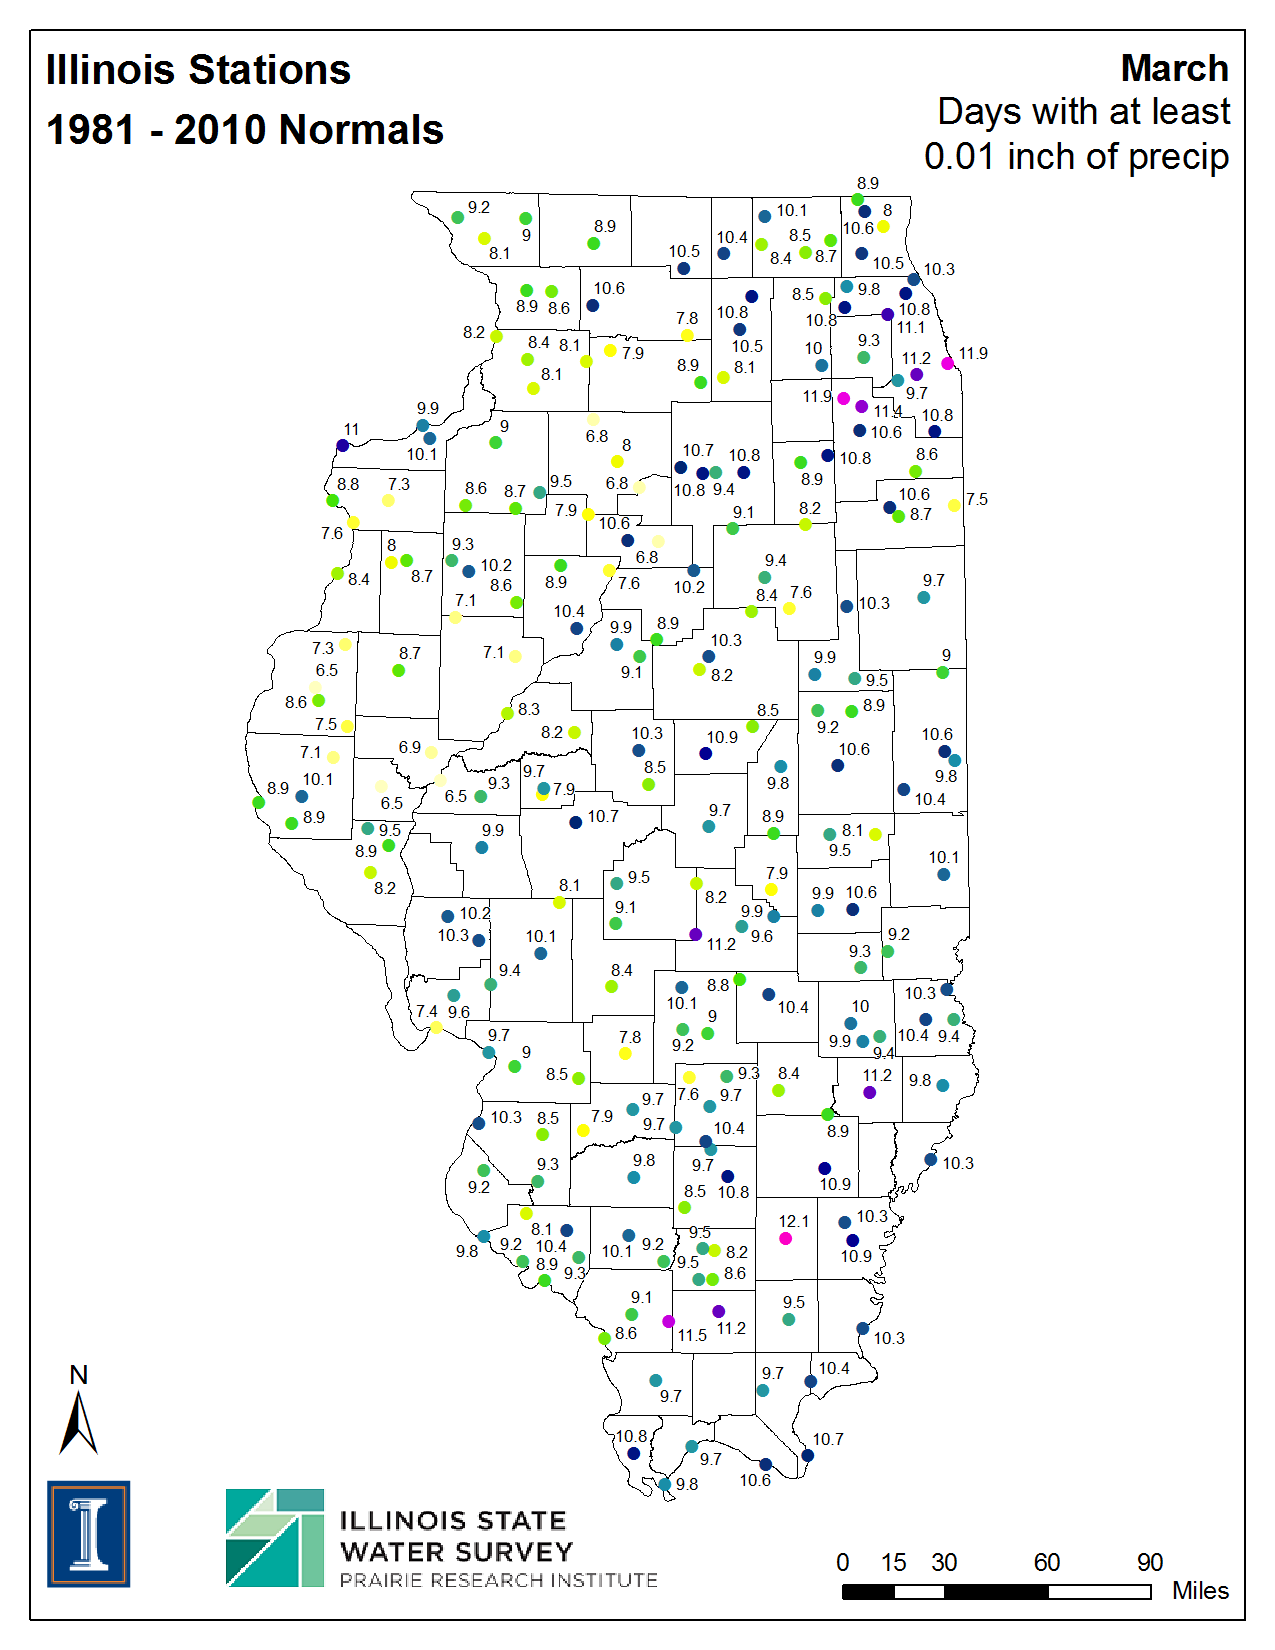
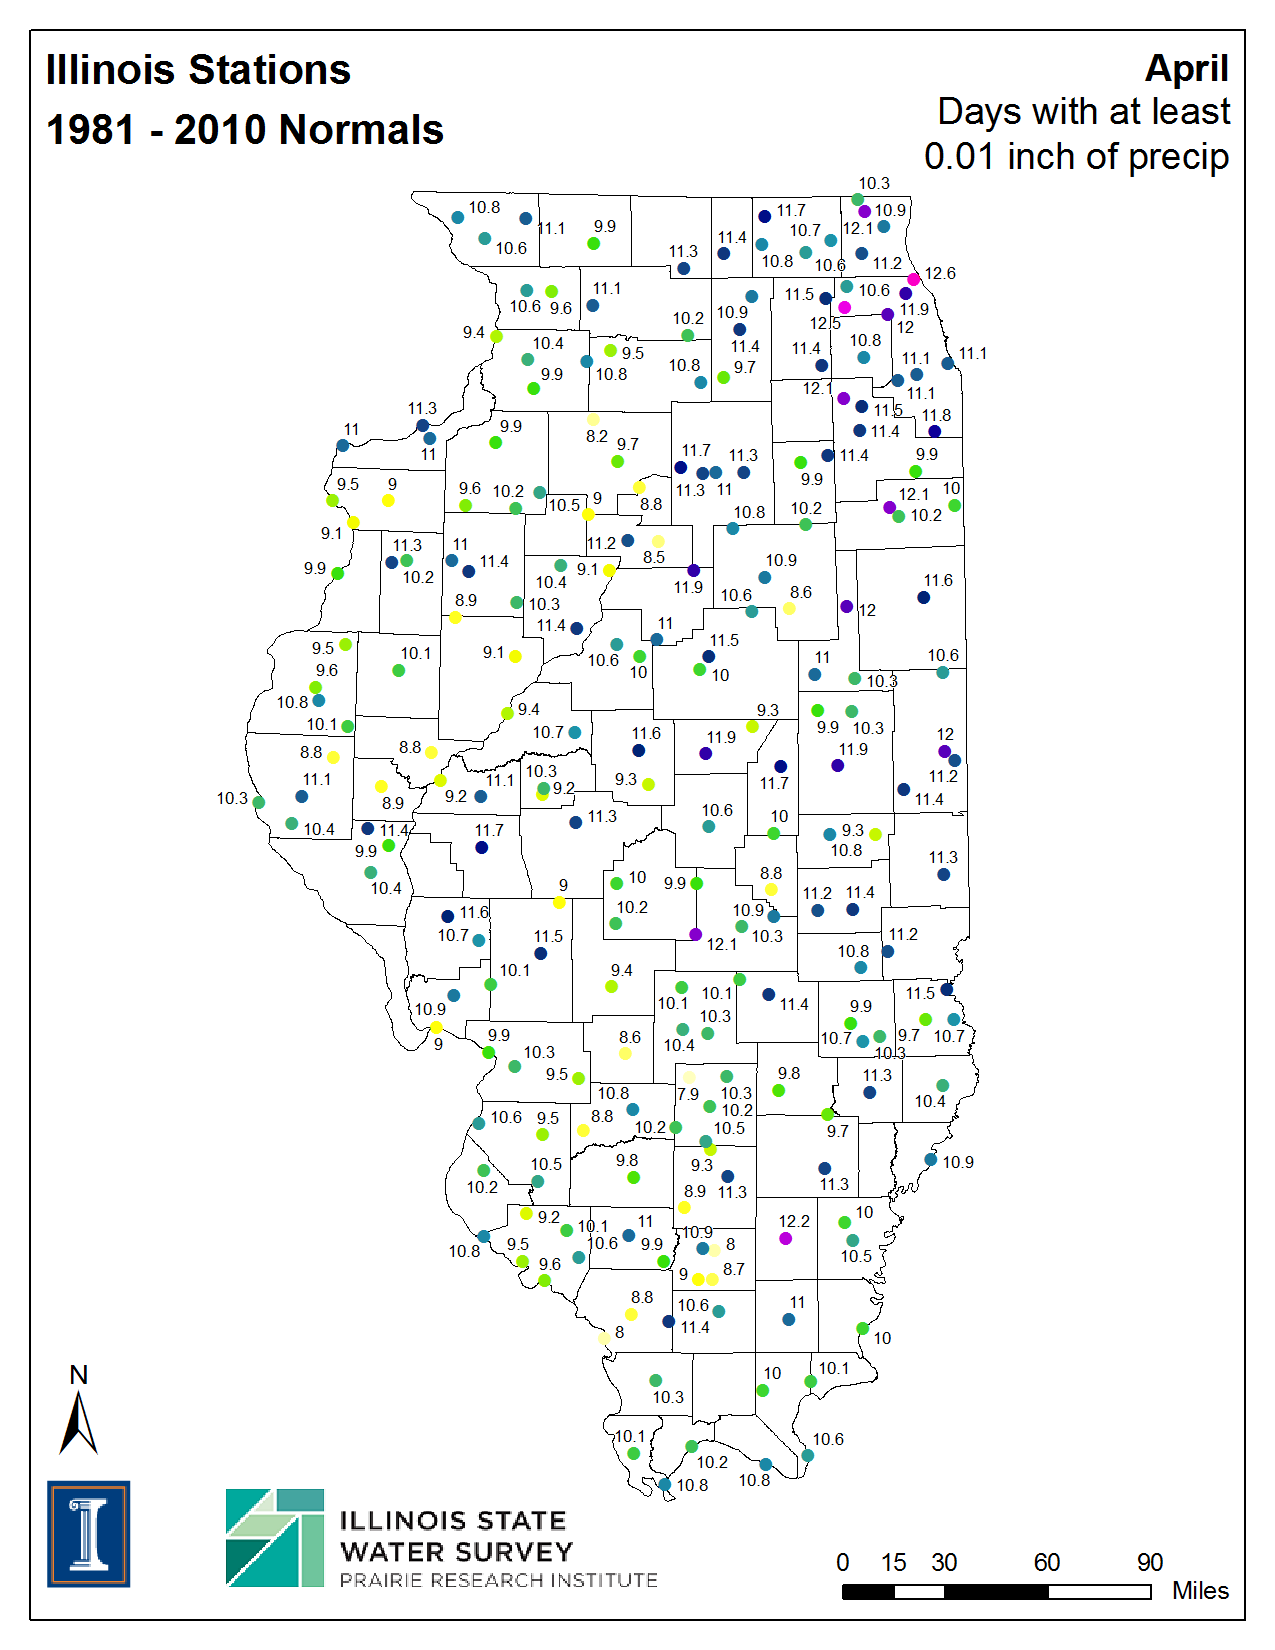
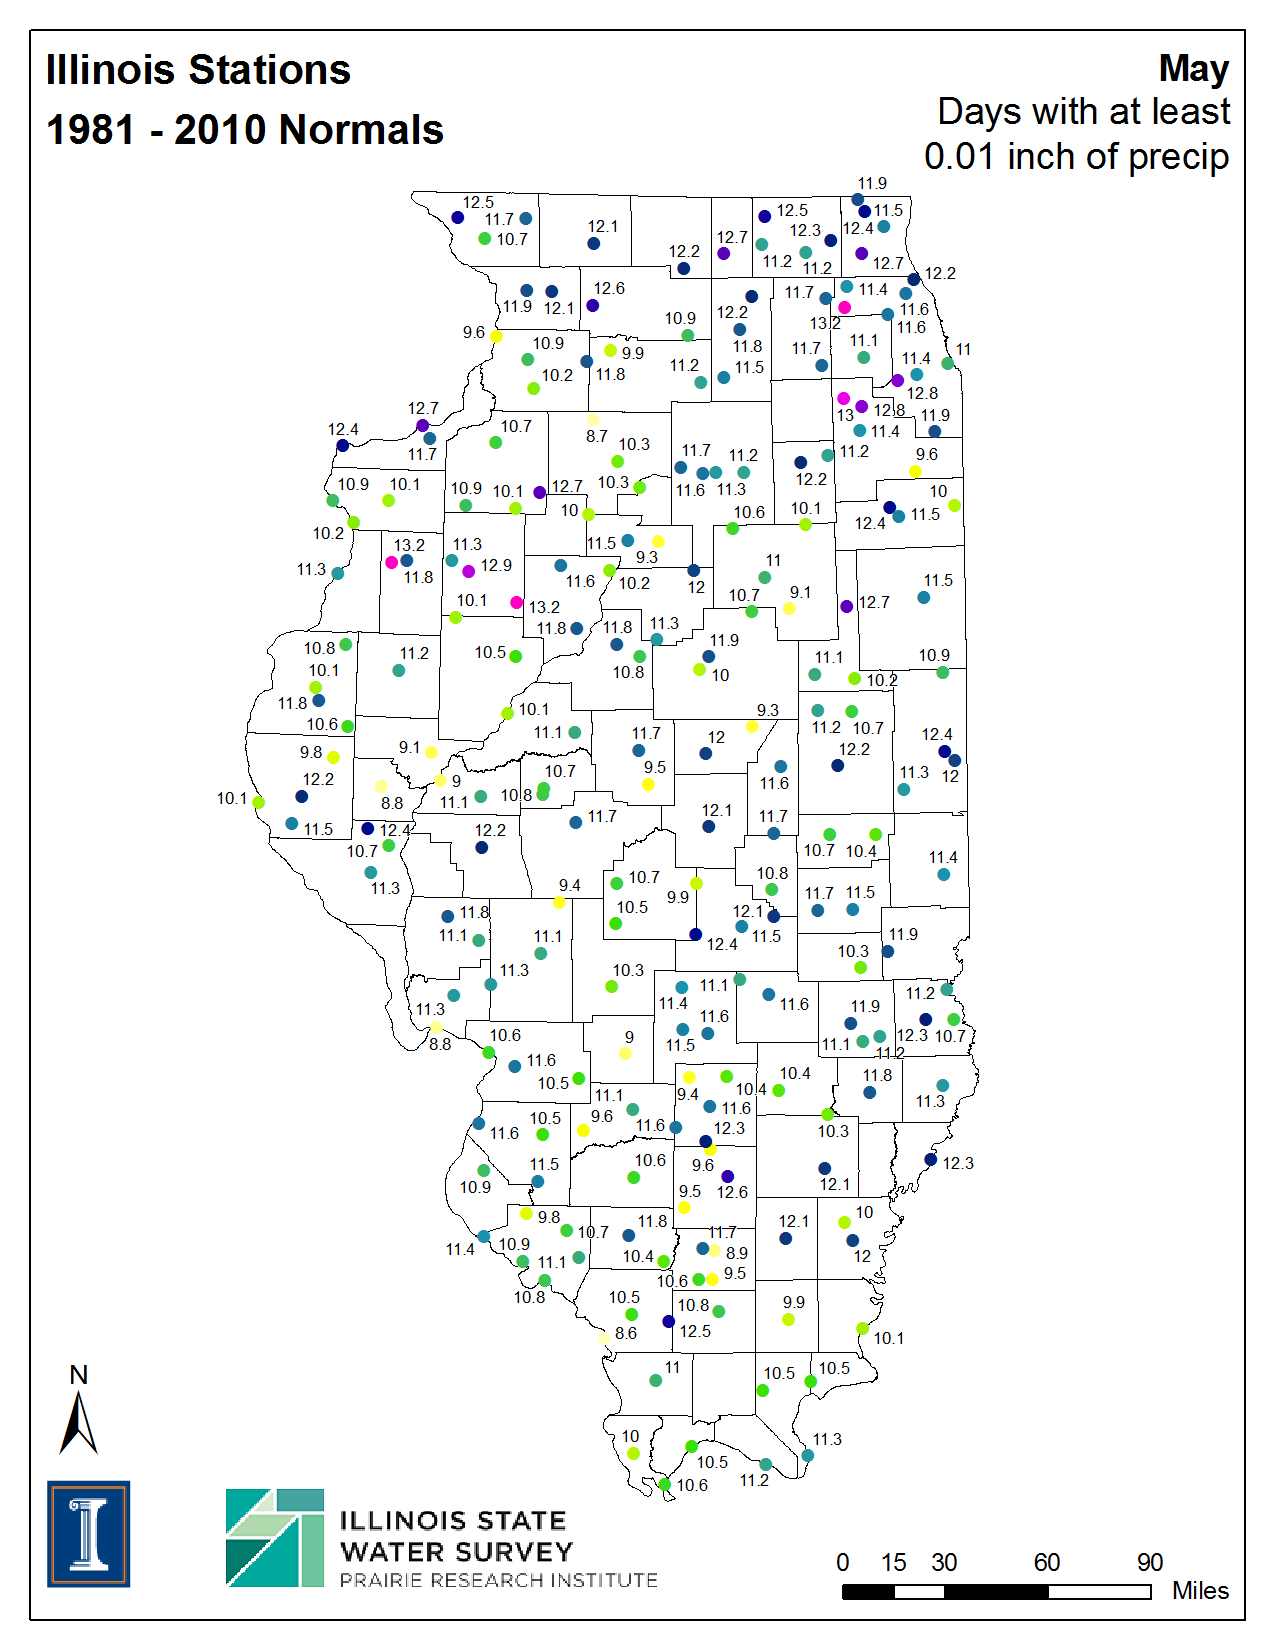
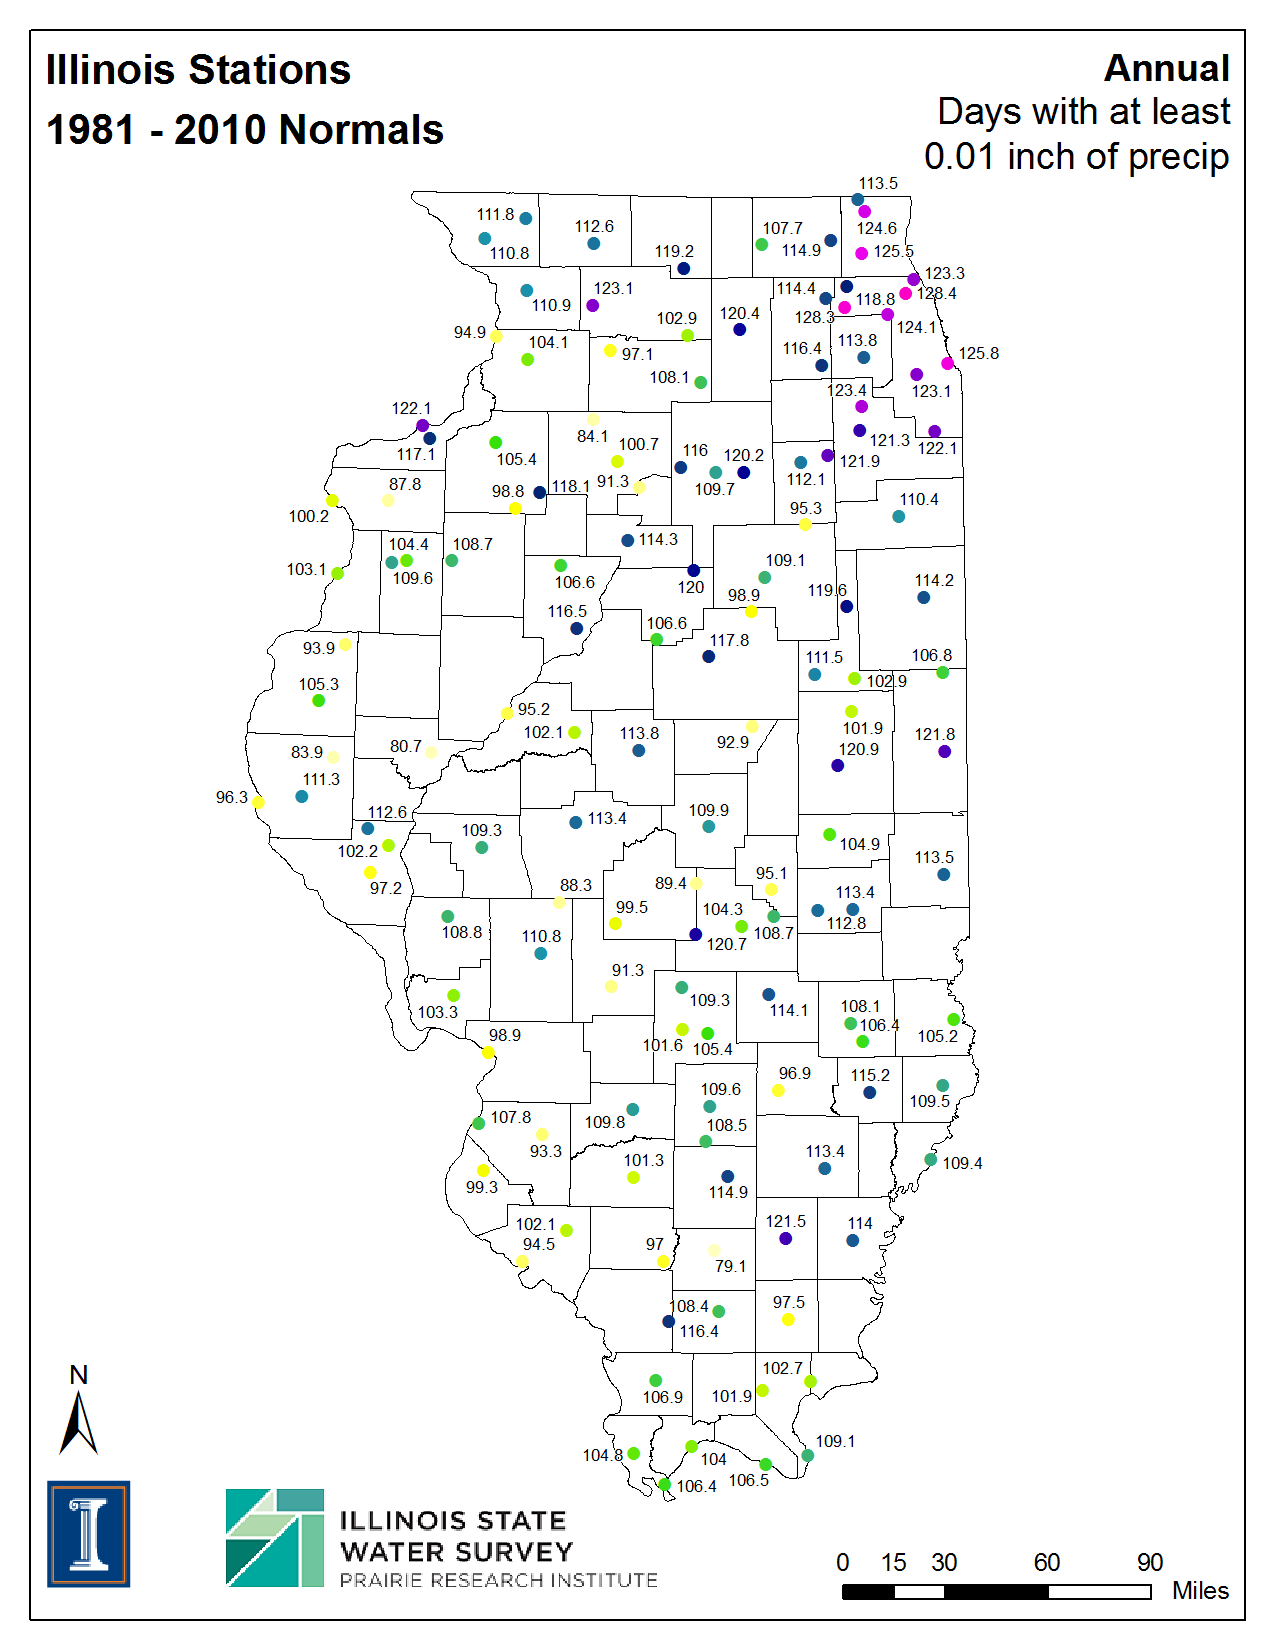
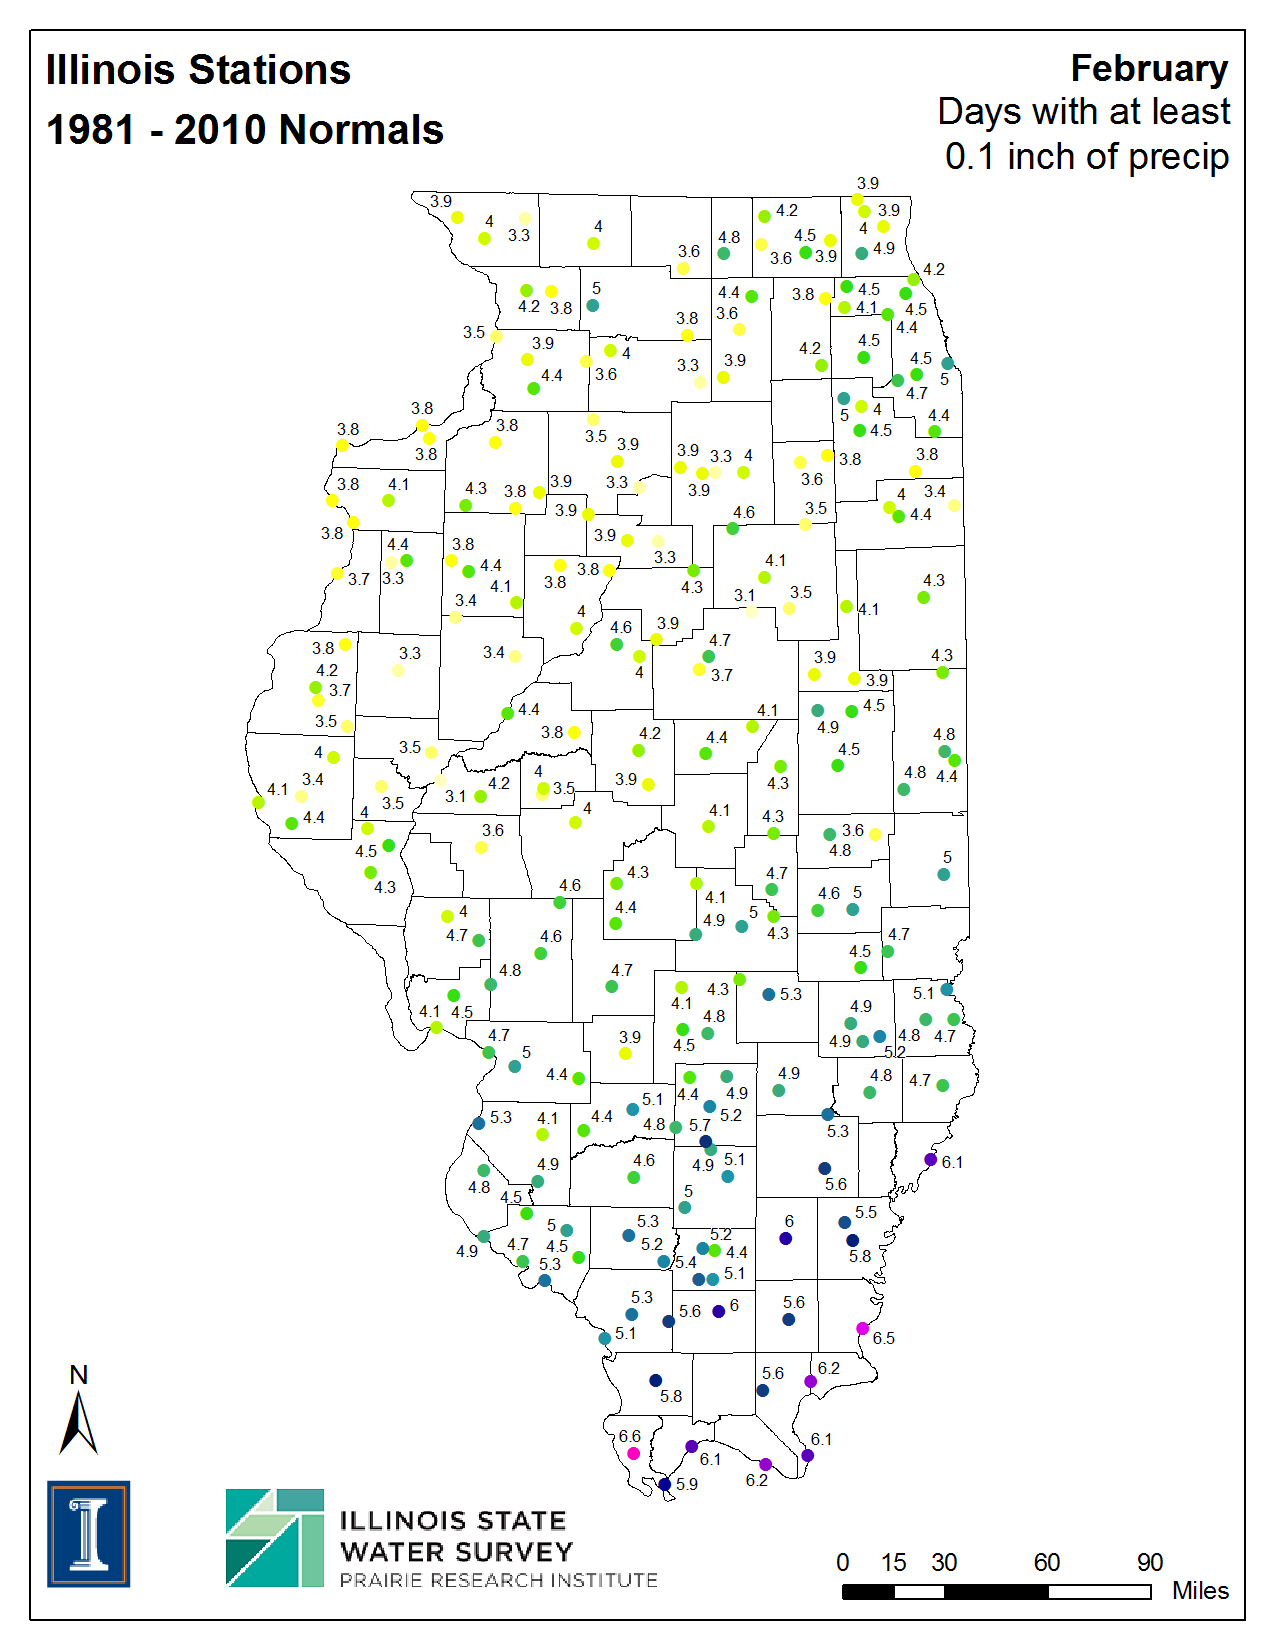
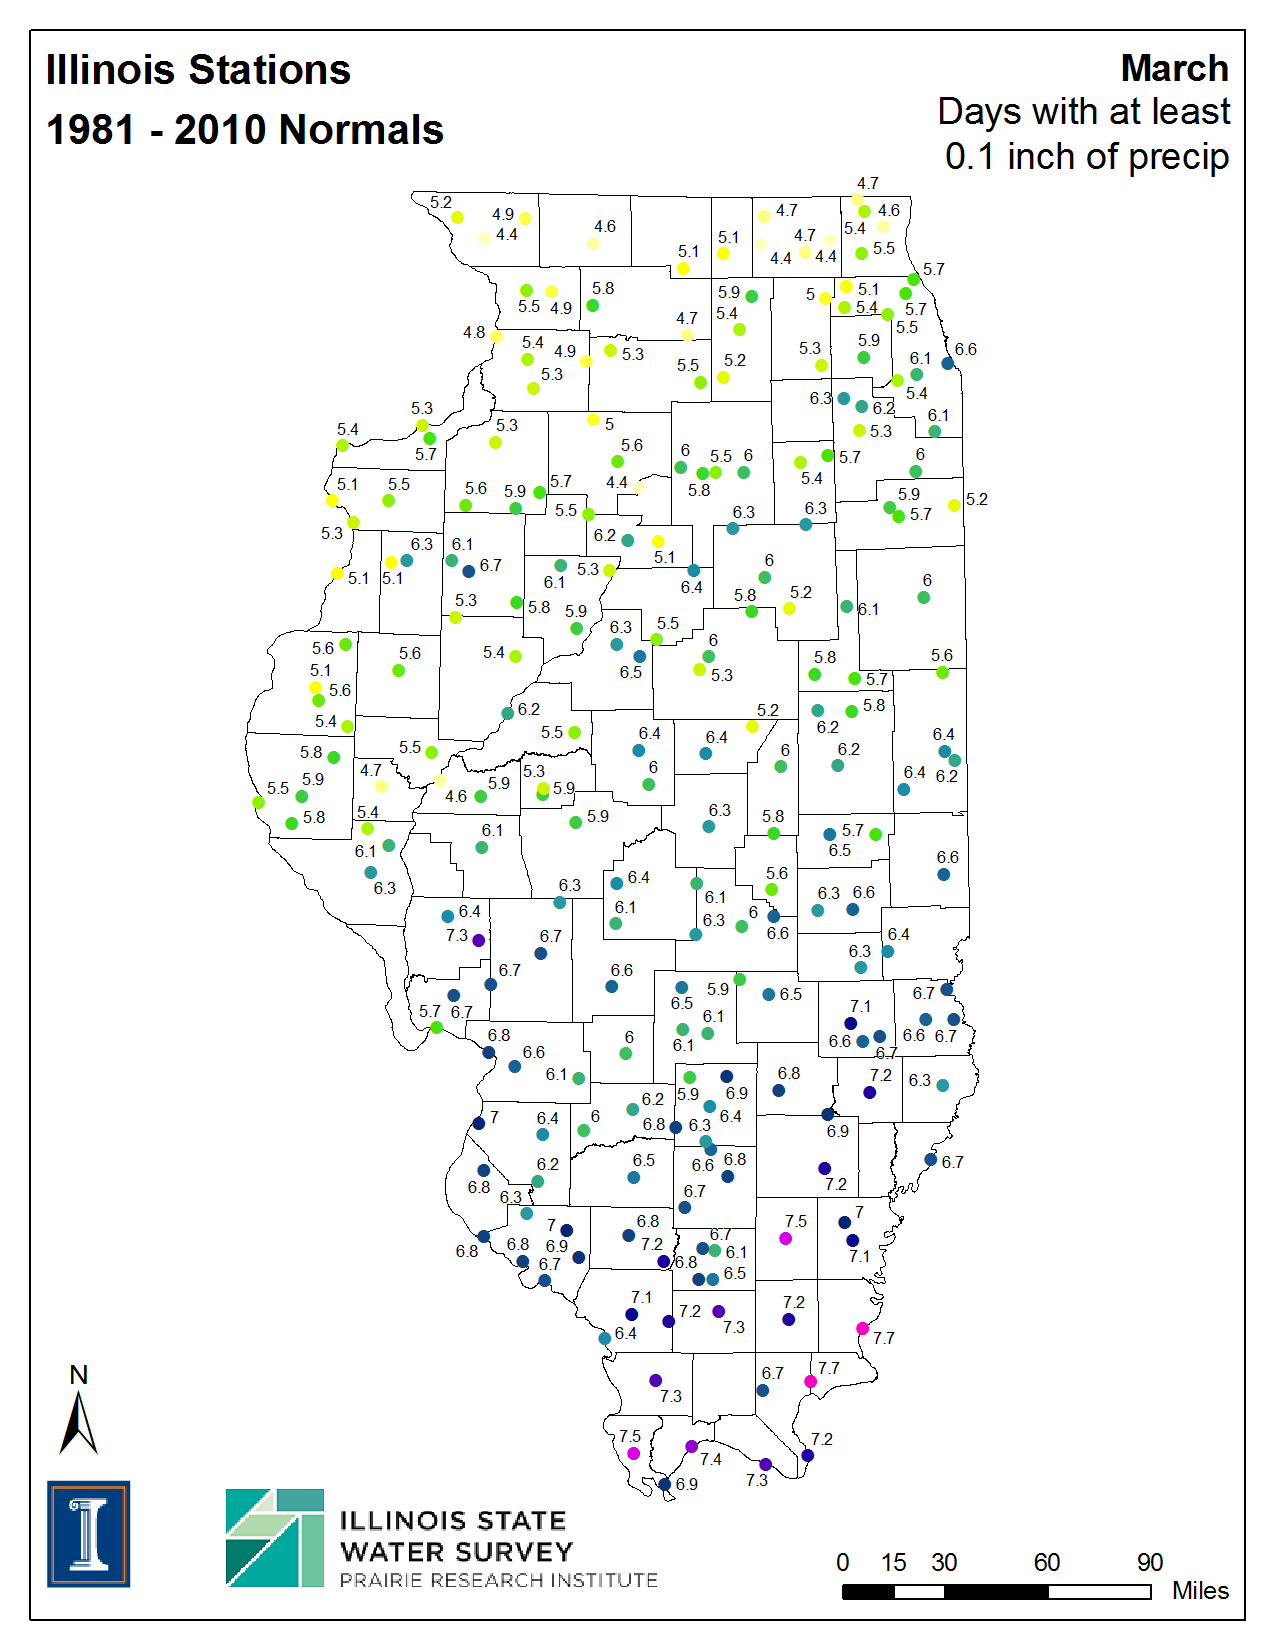
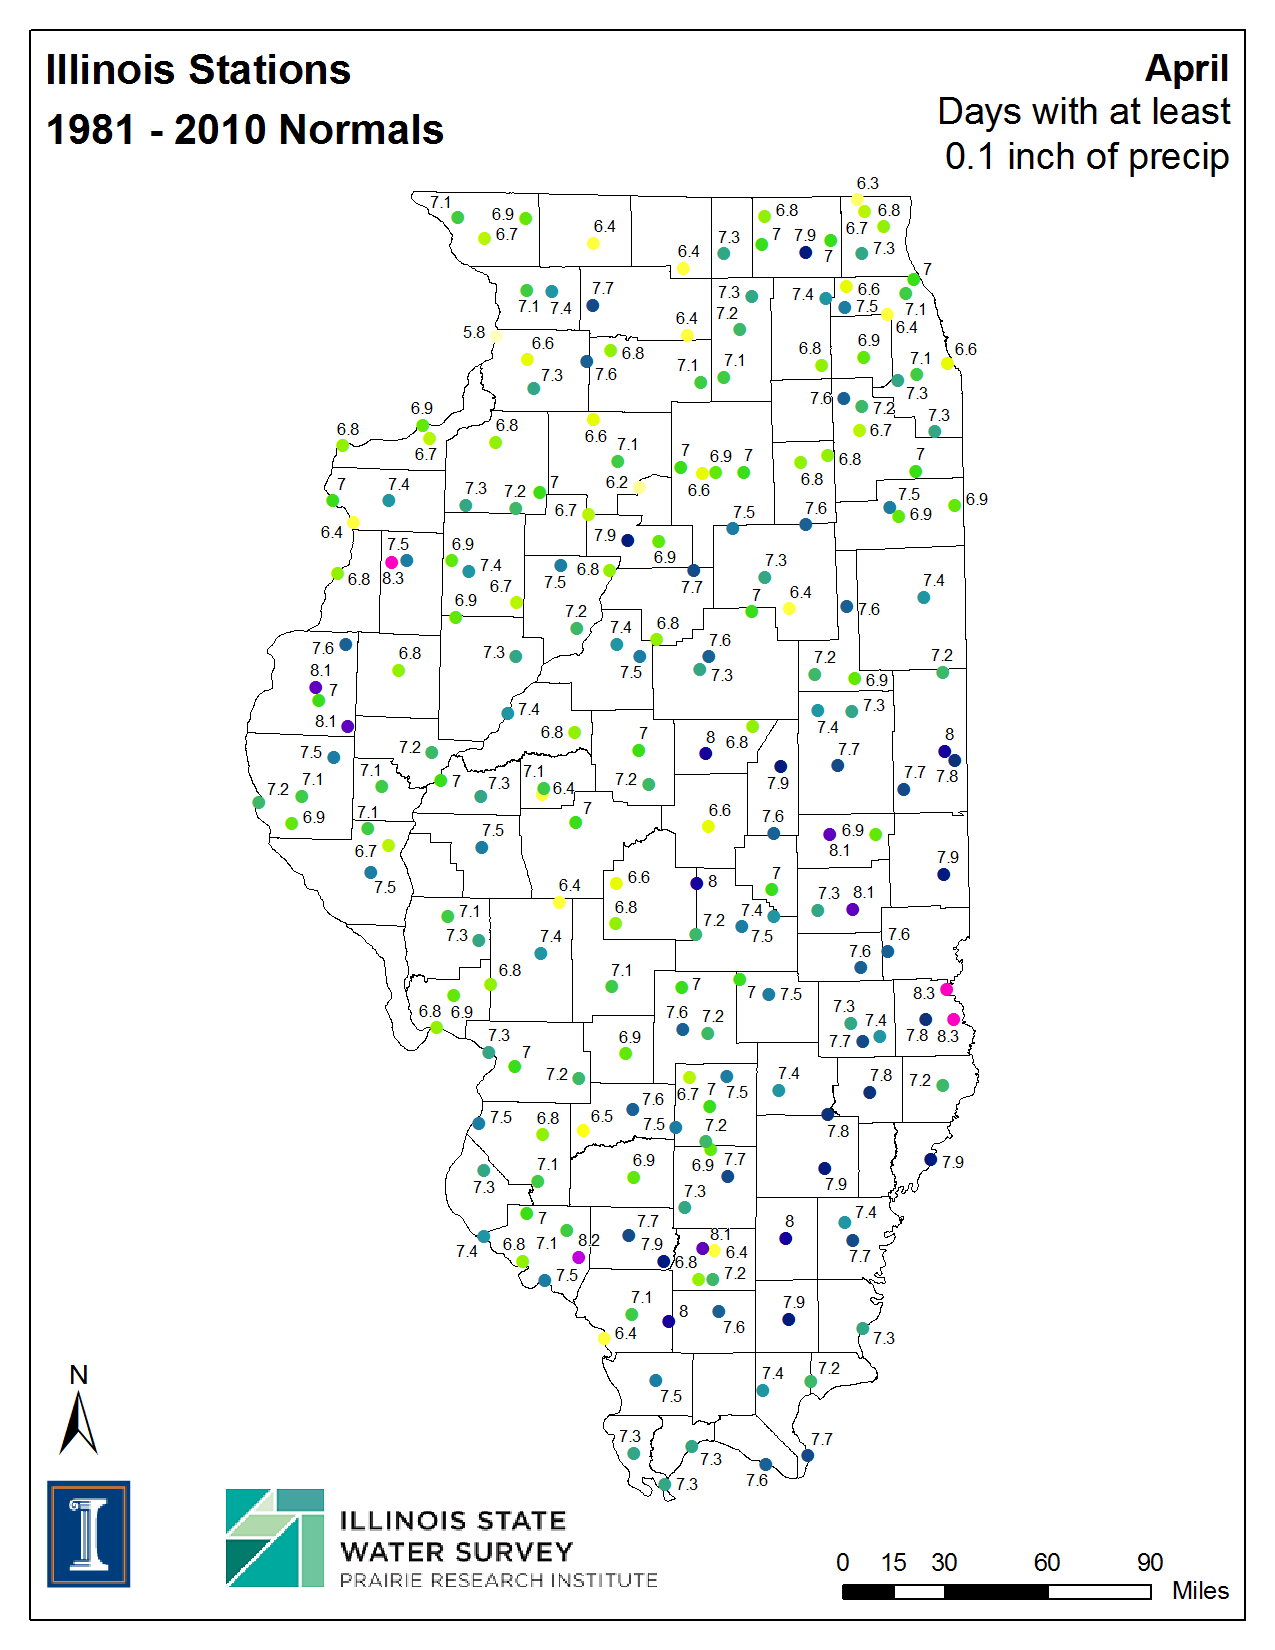
These maps describe the climate of Illinois using the official 1981-2010 normals from the National Climatic Data Center. Available maps include precipitation, temperature, snowfall, heating degree days, and cooling degree days, as well as number of days above or below selected thresholds of precipitation, temperature, and snowfall. Data for individual sites may be found on my Illinois Climate Normals page.
These maps may be reproduced and redistributed, crediting the Illinois State Water Survey (see data disclaimer). Our GIS specialist Zoe Zaloudek, generated the maps using ArcGIS and Python scripts.
| Precipitation (inches) | ||||||
|---|---|---|---|---|---|---|
| Jan | Feb | Mar | Apr | May | Jun | |
| Jul | Aug | Sep | Oct | Nov | Dec | Annual |
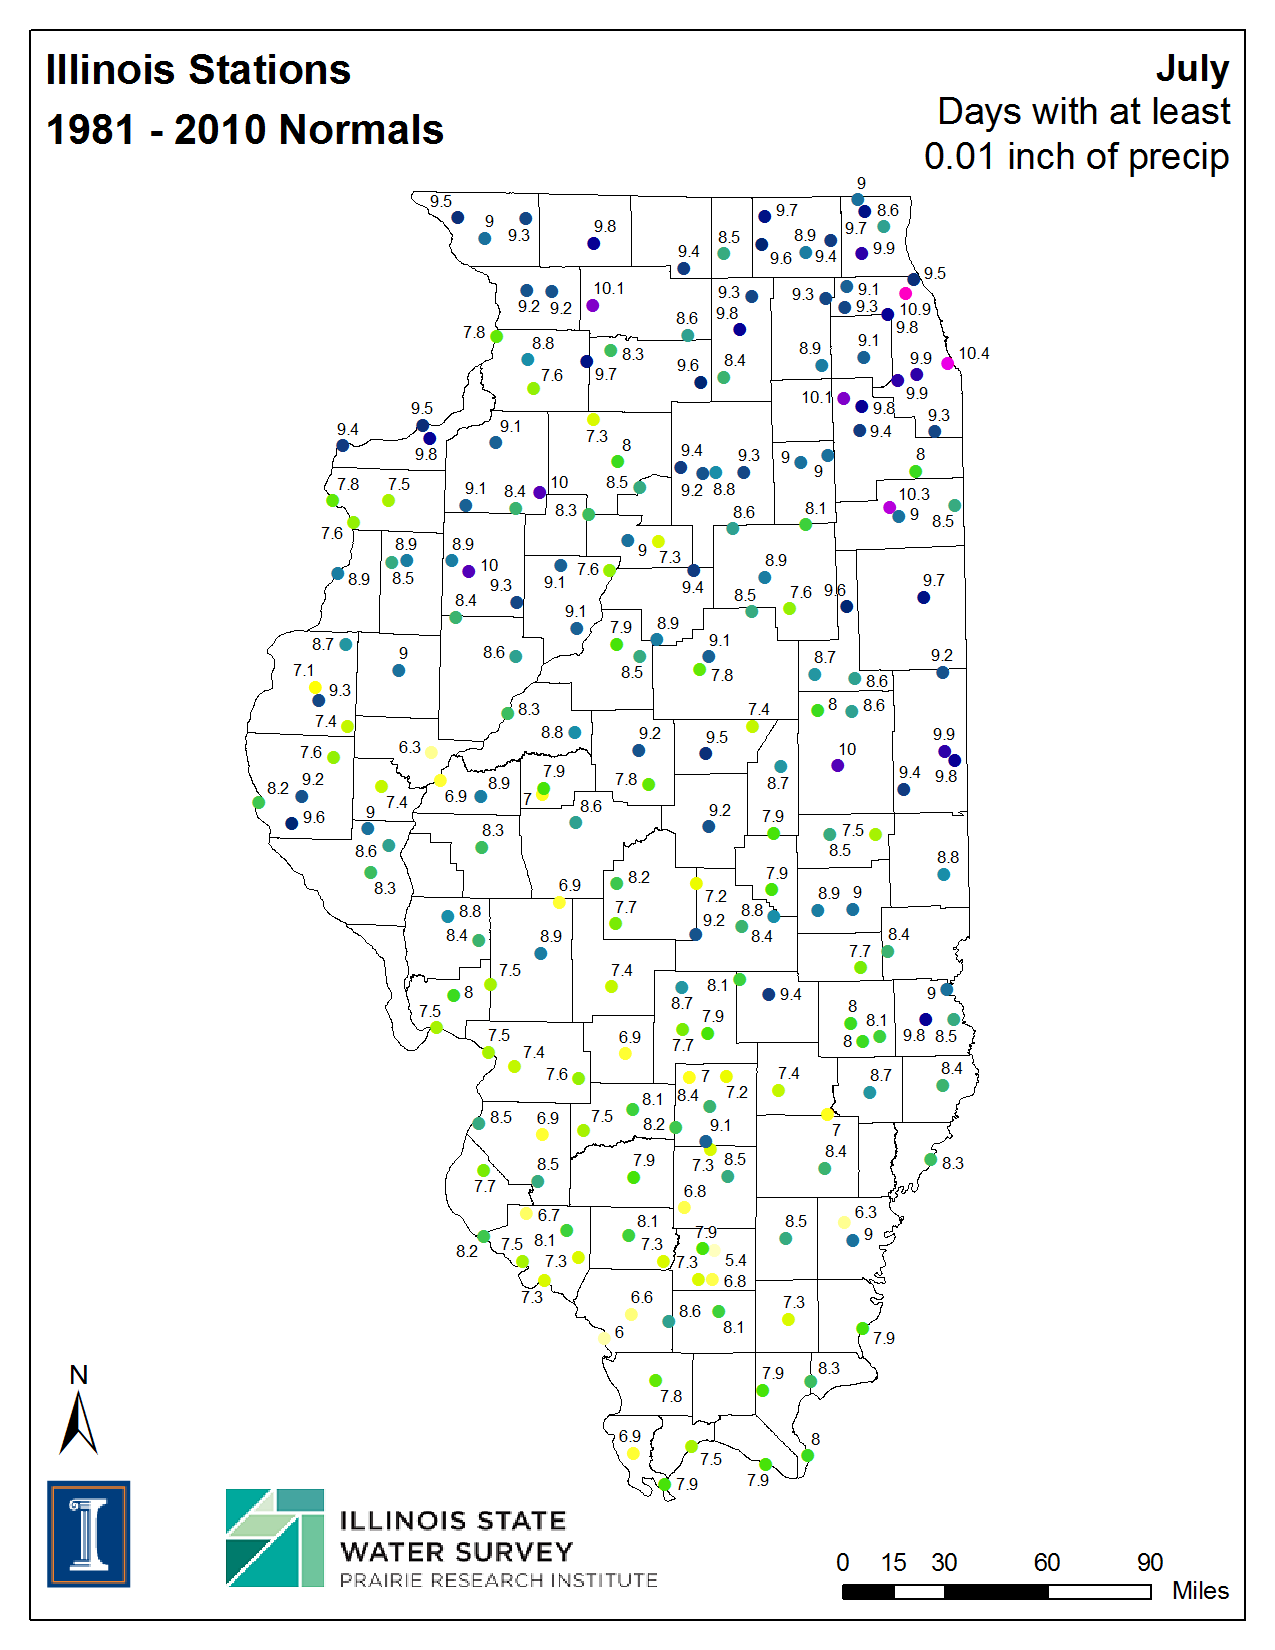
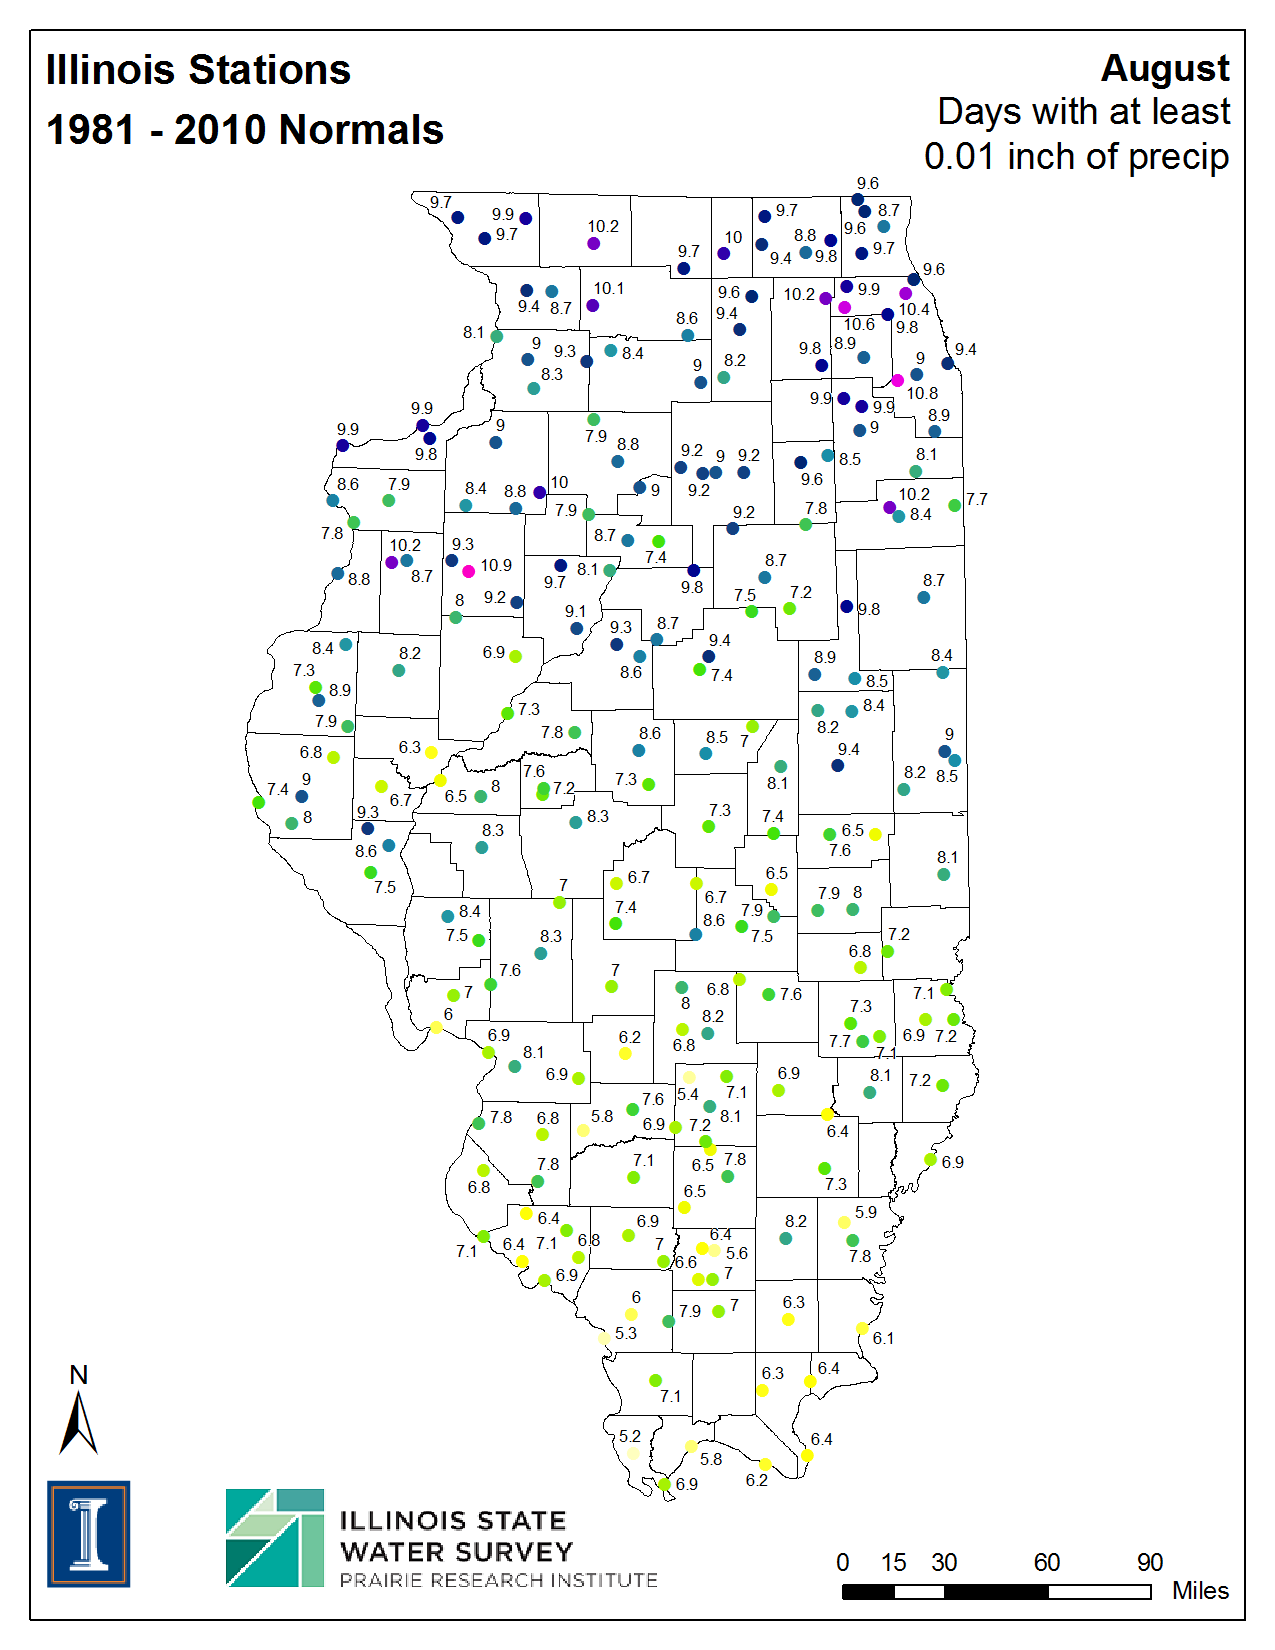
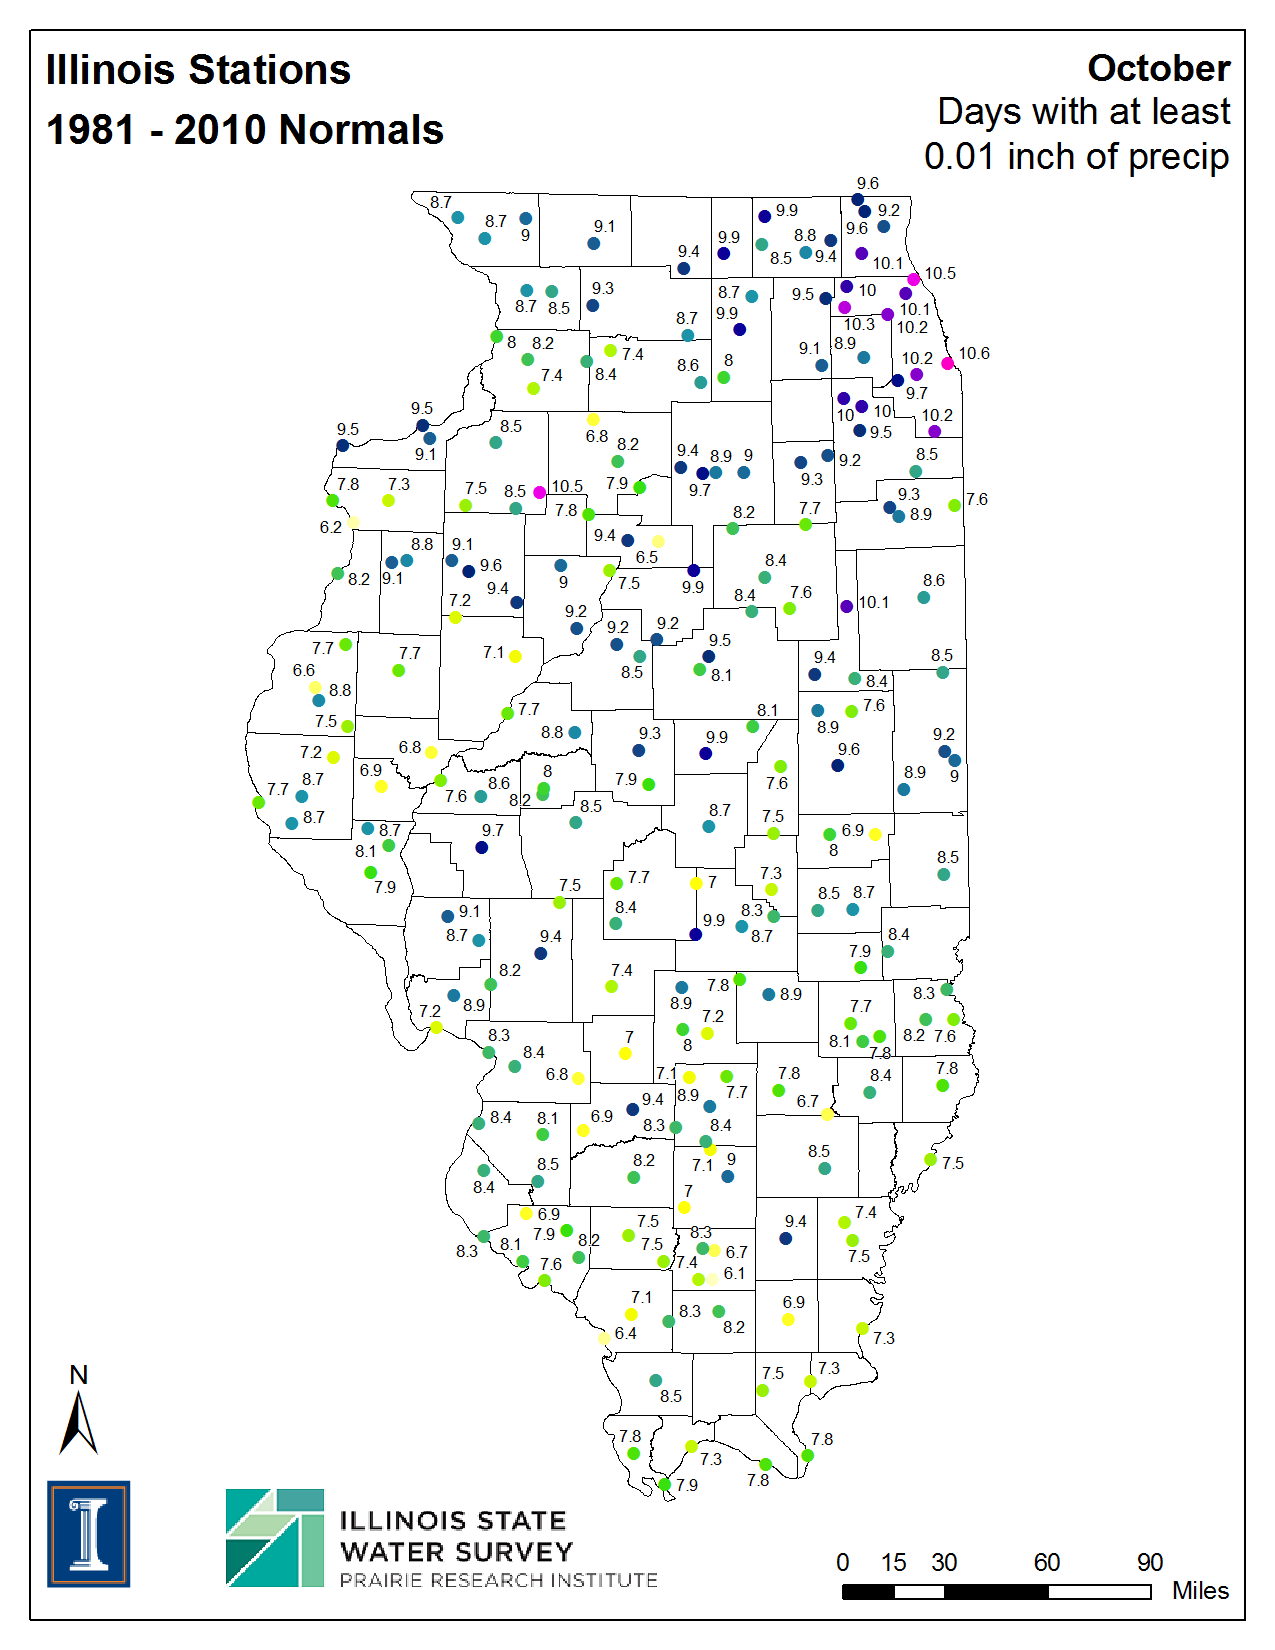
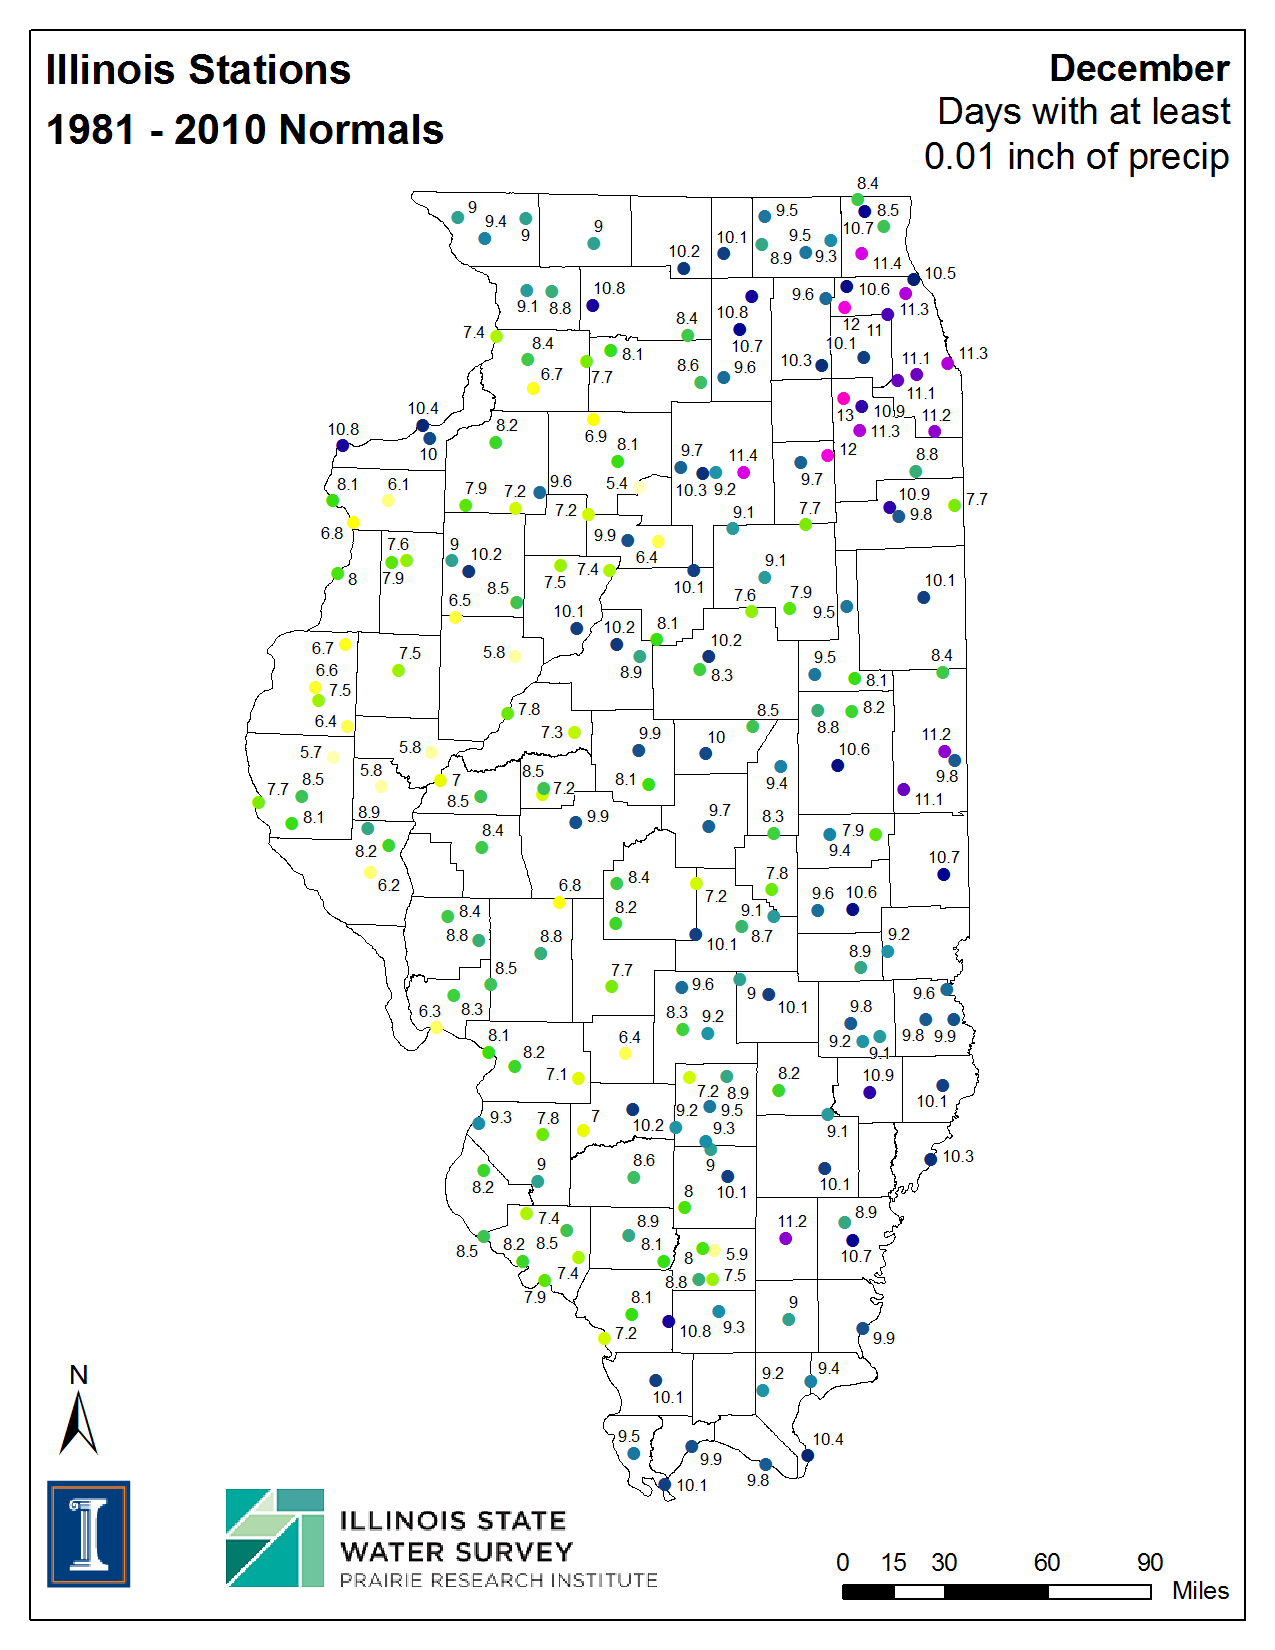
| Days with Precipitation Greater Than or Equal to 0.01 inches | ||||||
| Jan | Feb | Mar | Apr | May | Jun | |
| Jul | Aug | Sep | Oct | Nov | Dec | Annual |
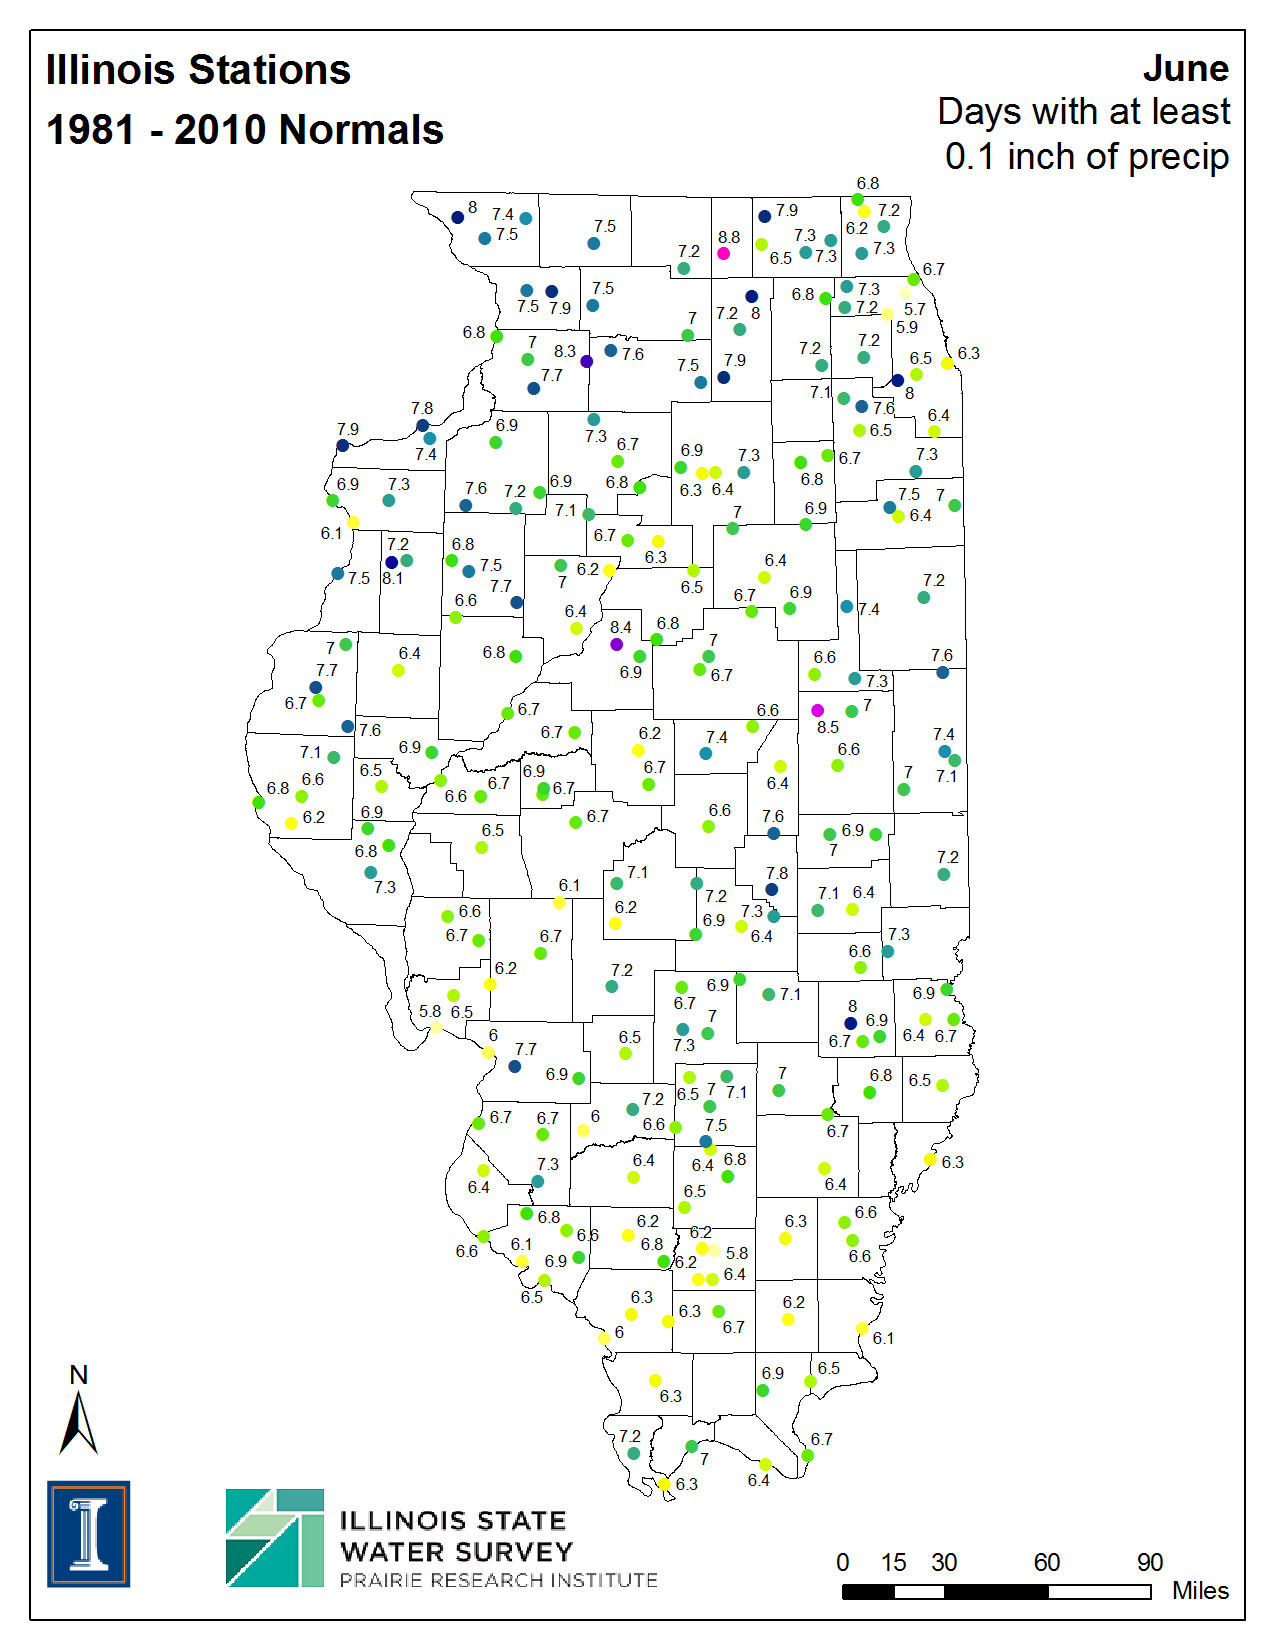
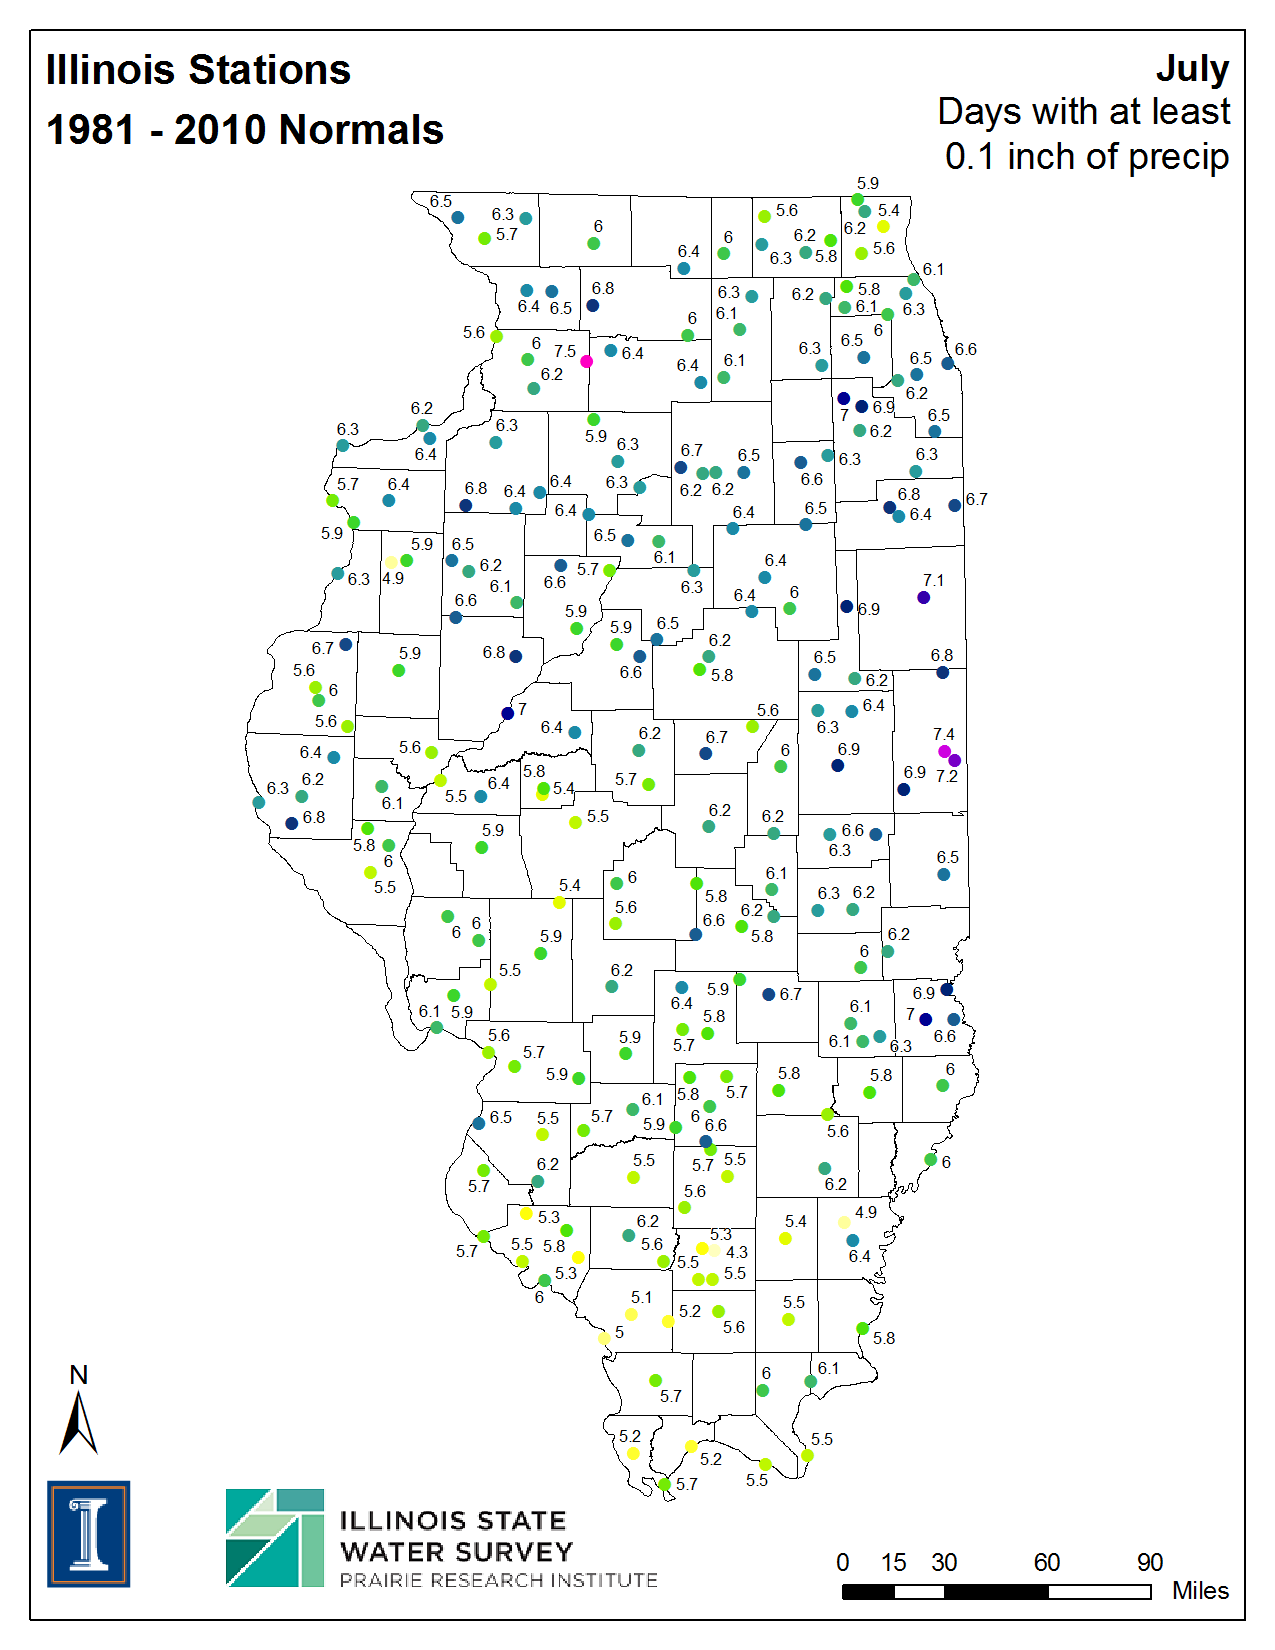
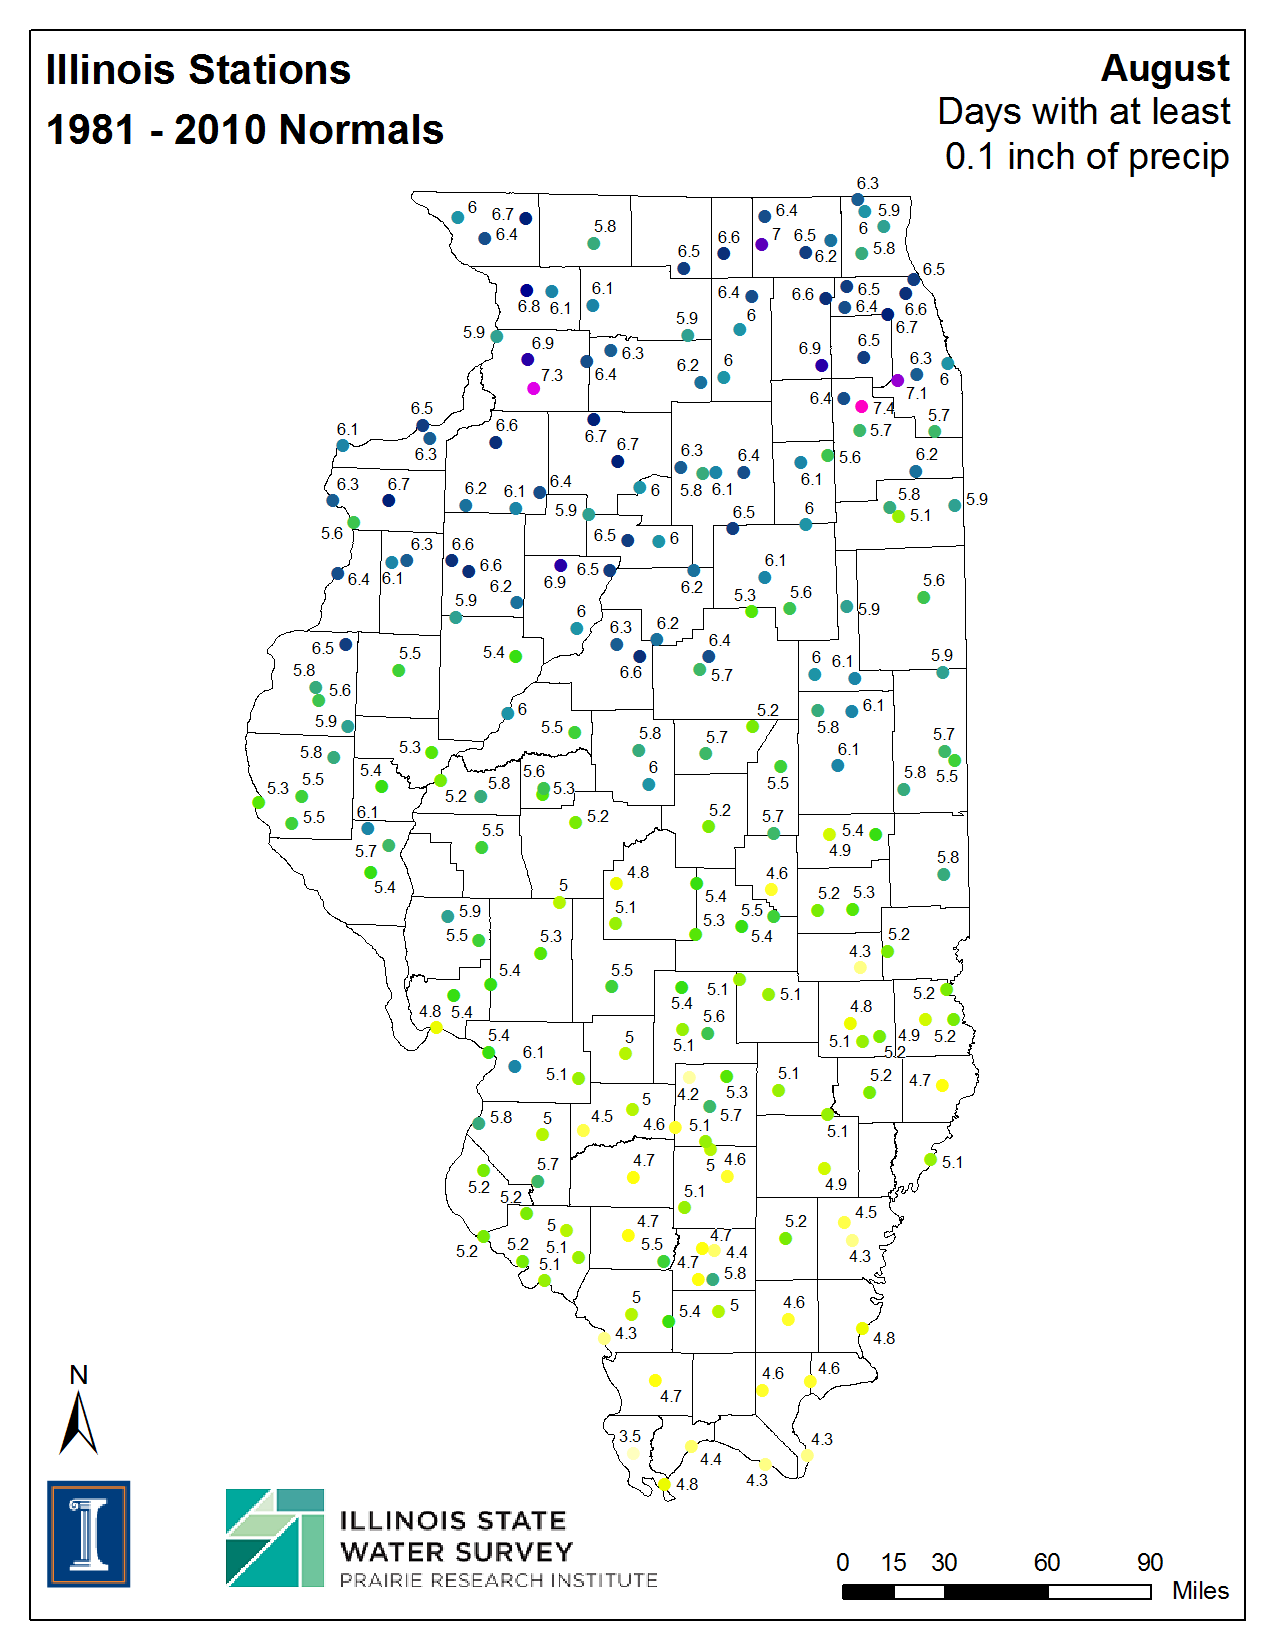
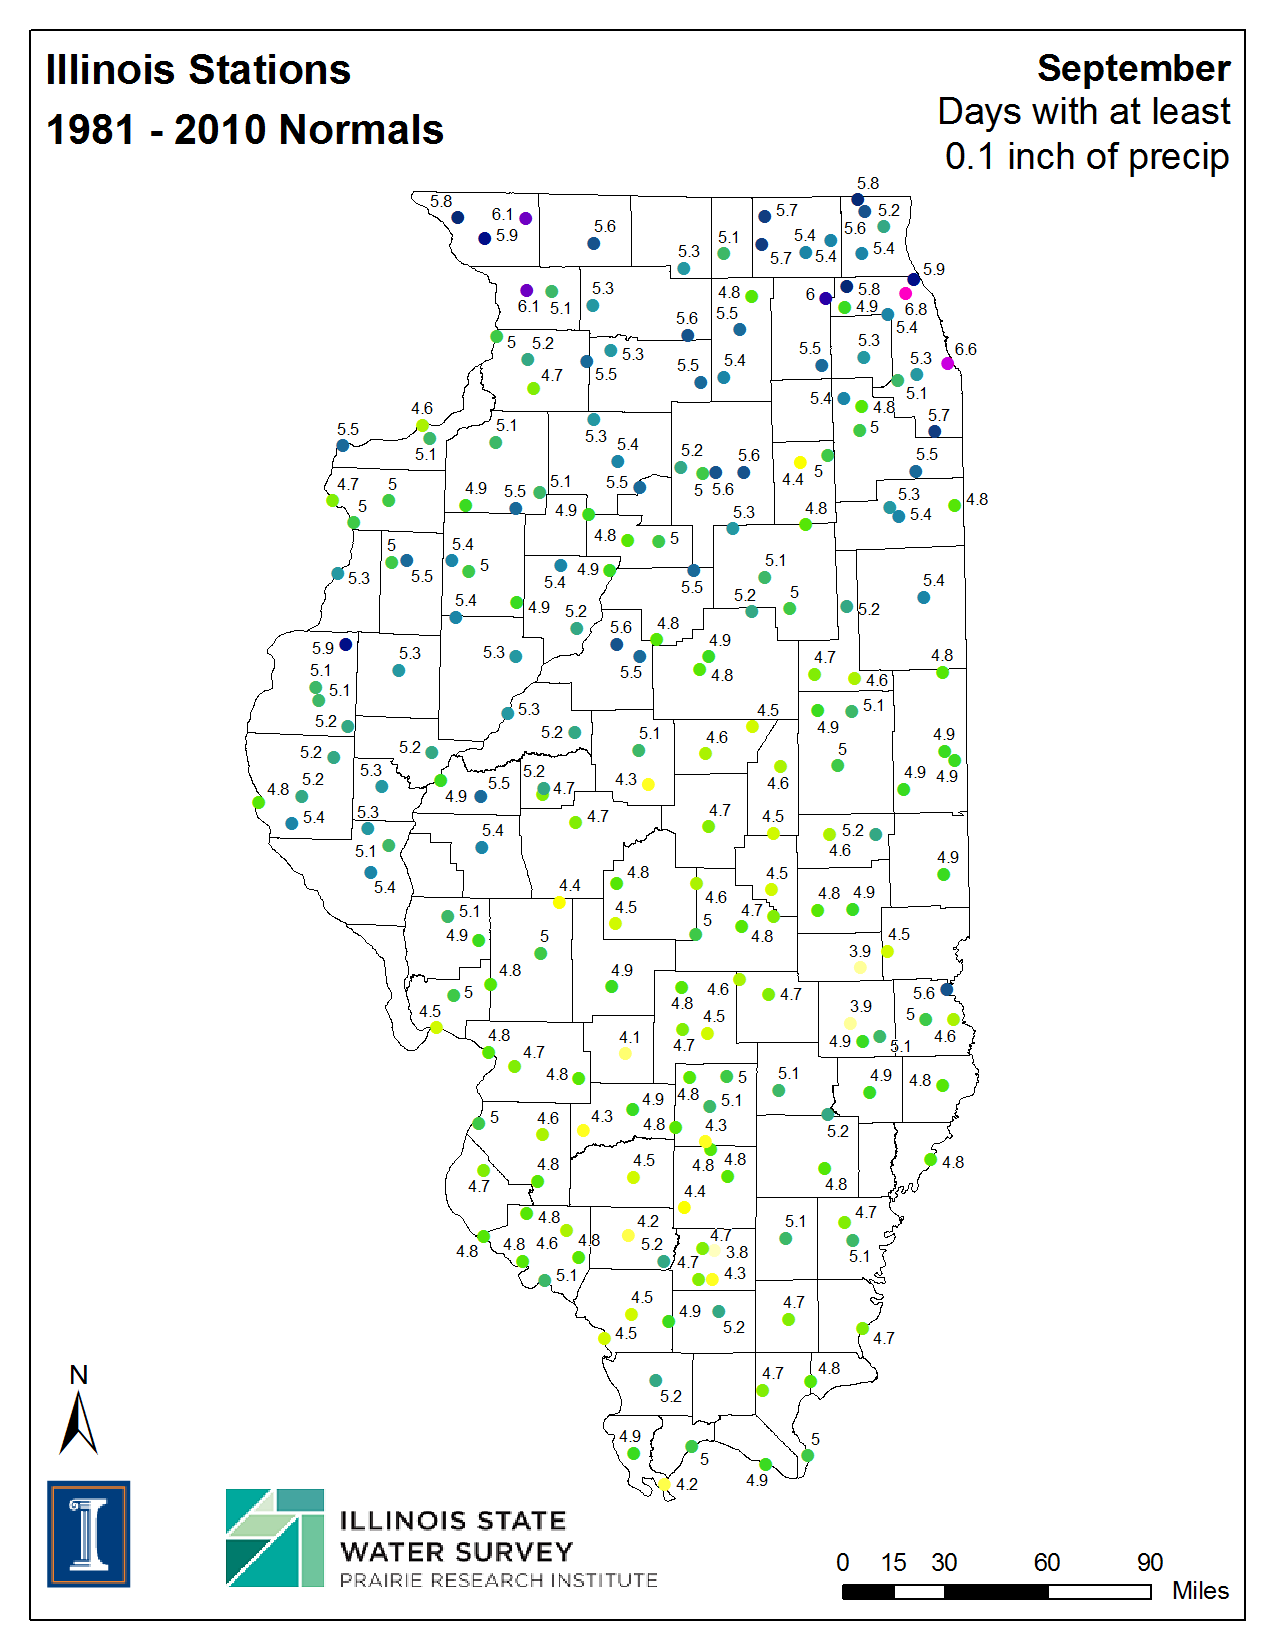
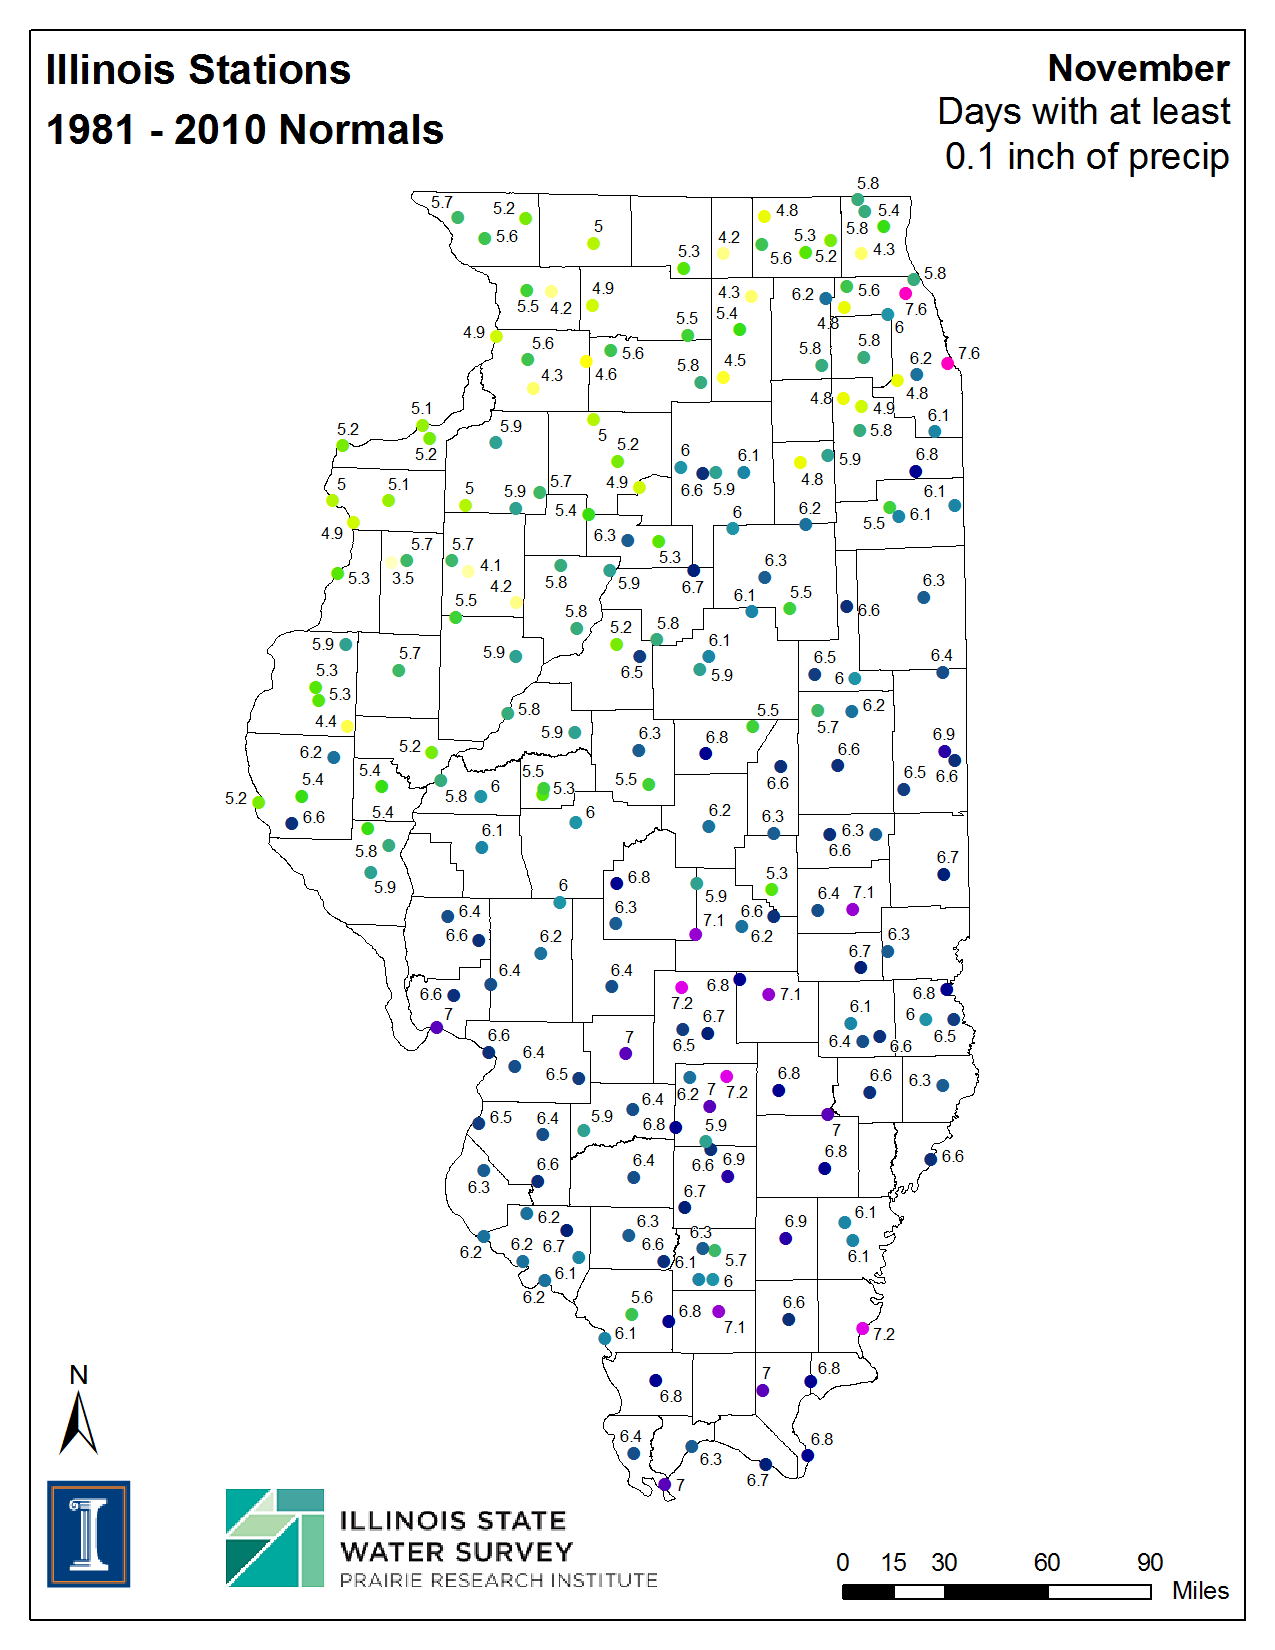
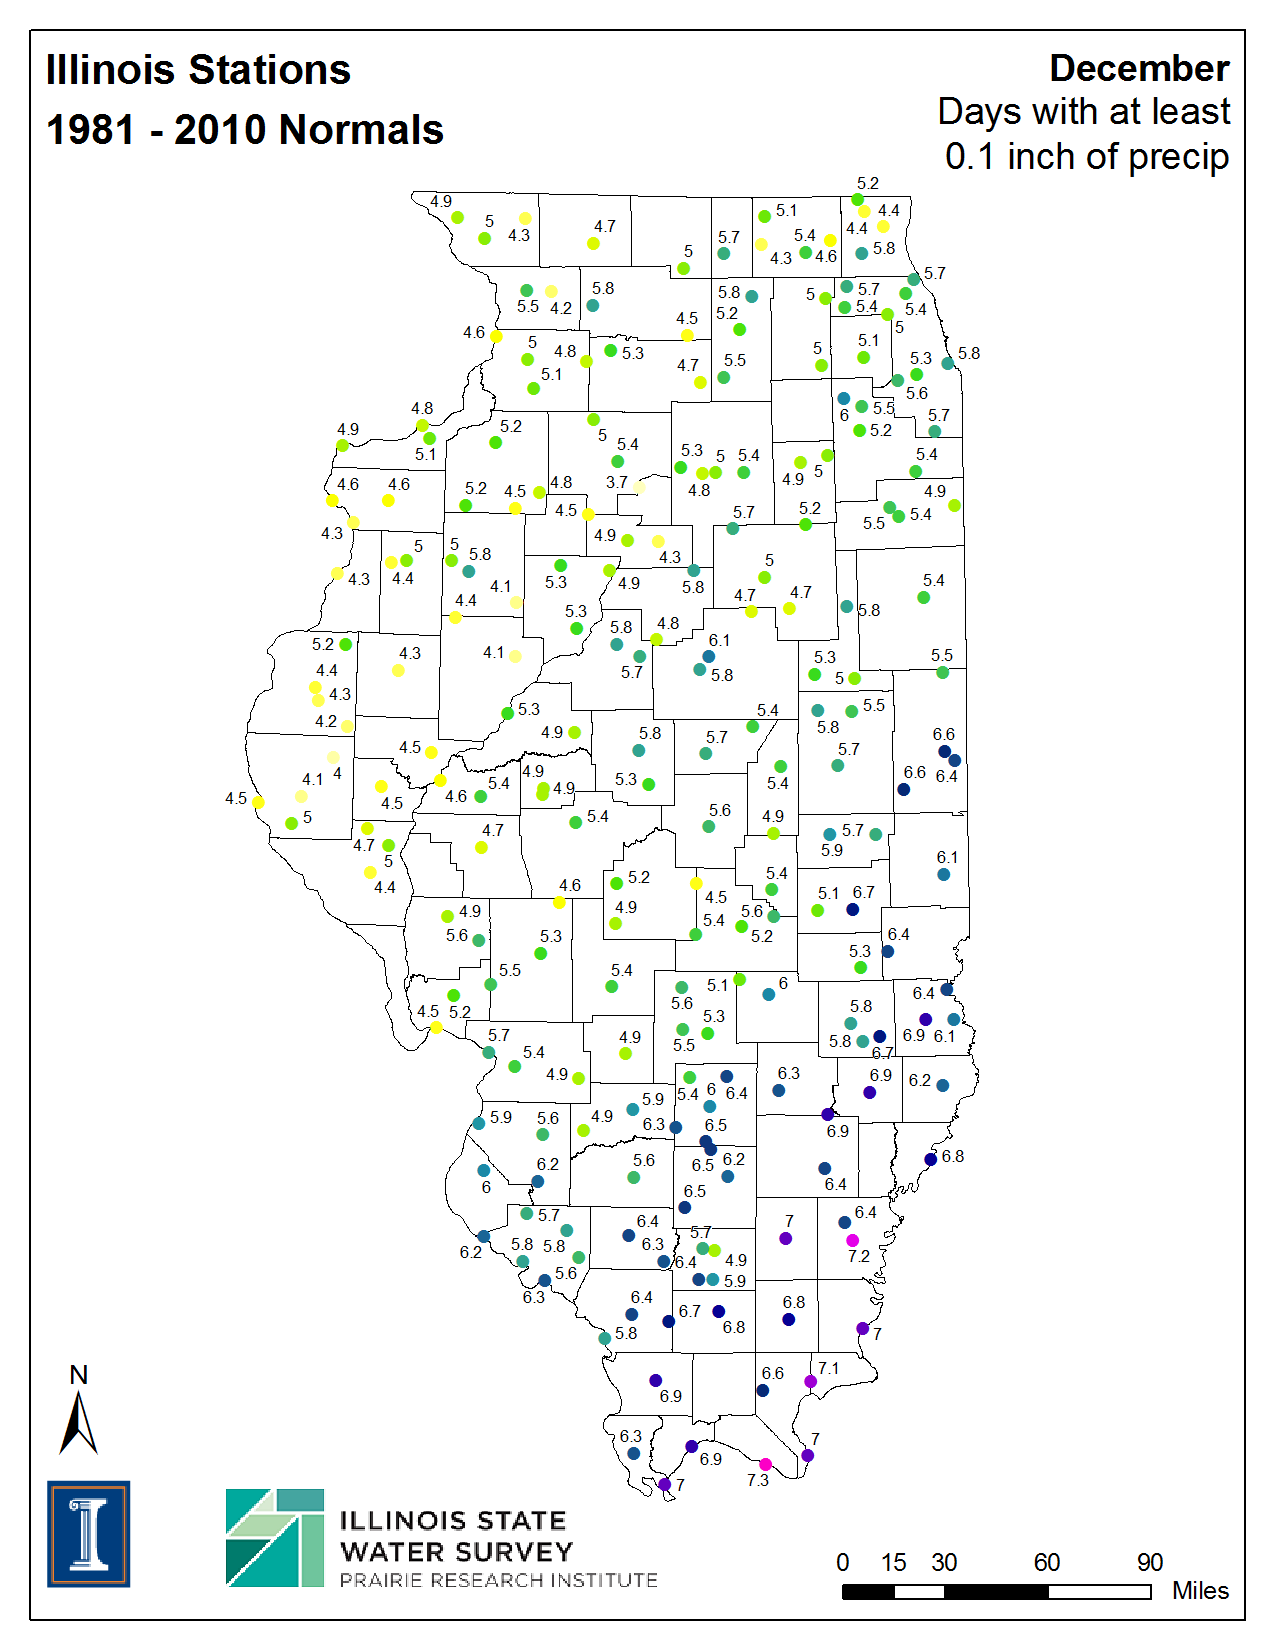
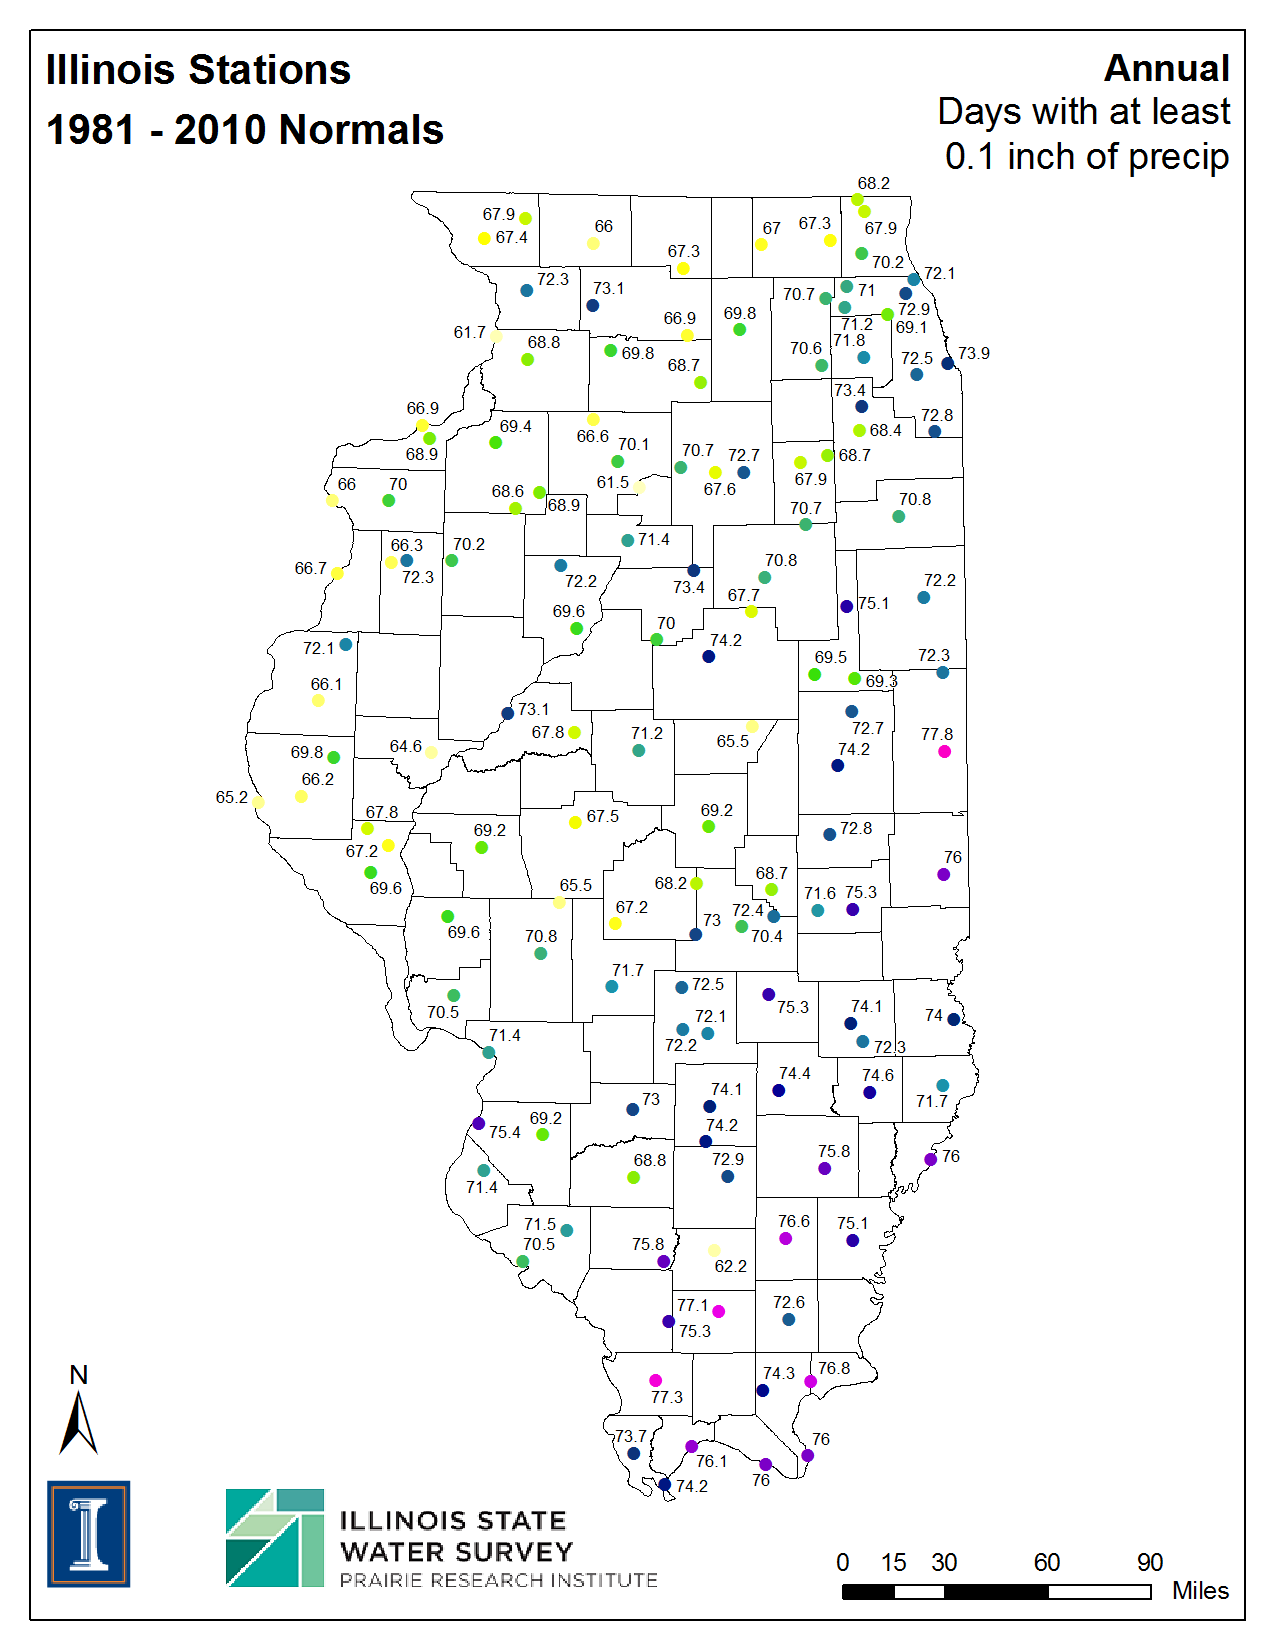
| Days with Precipitation Greater Than or Equal to 0.10 inches | ||||||
| Jan | Feb | Mar | Apr | May | Jun | |
| Jul | Aug | Sep | Oct | Nov | Dec | Annual |
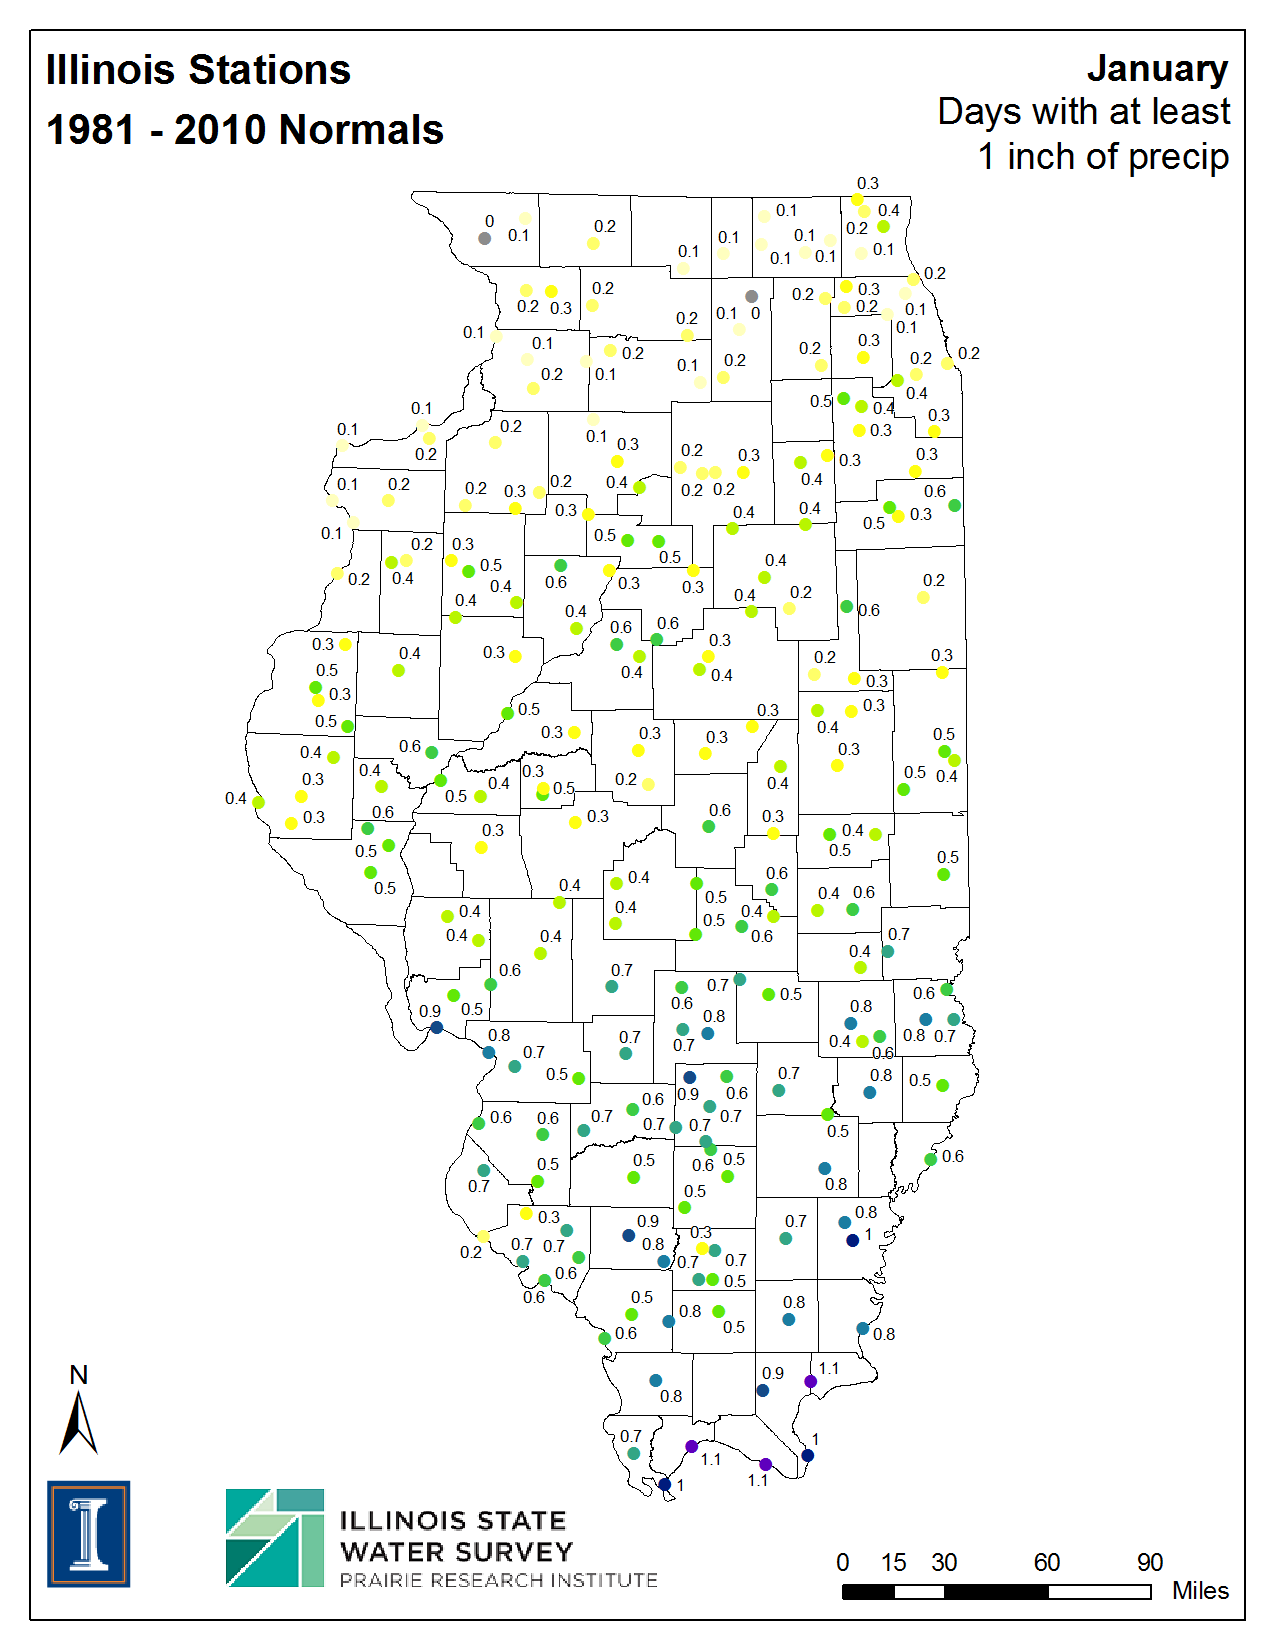
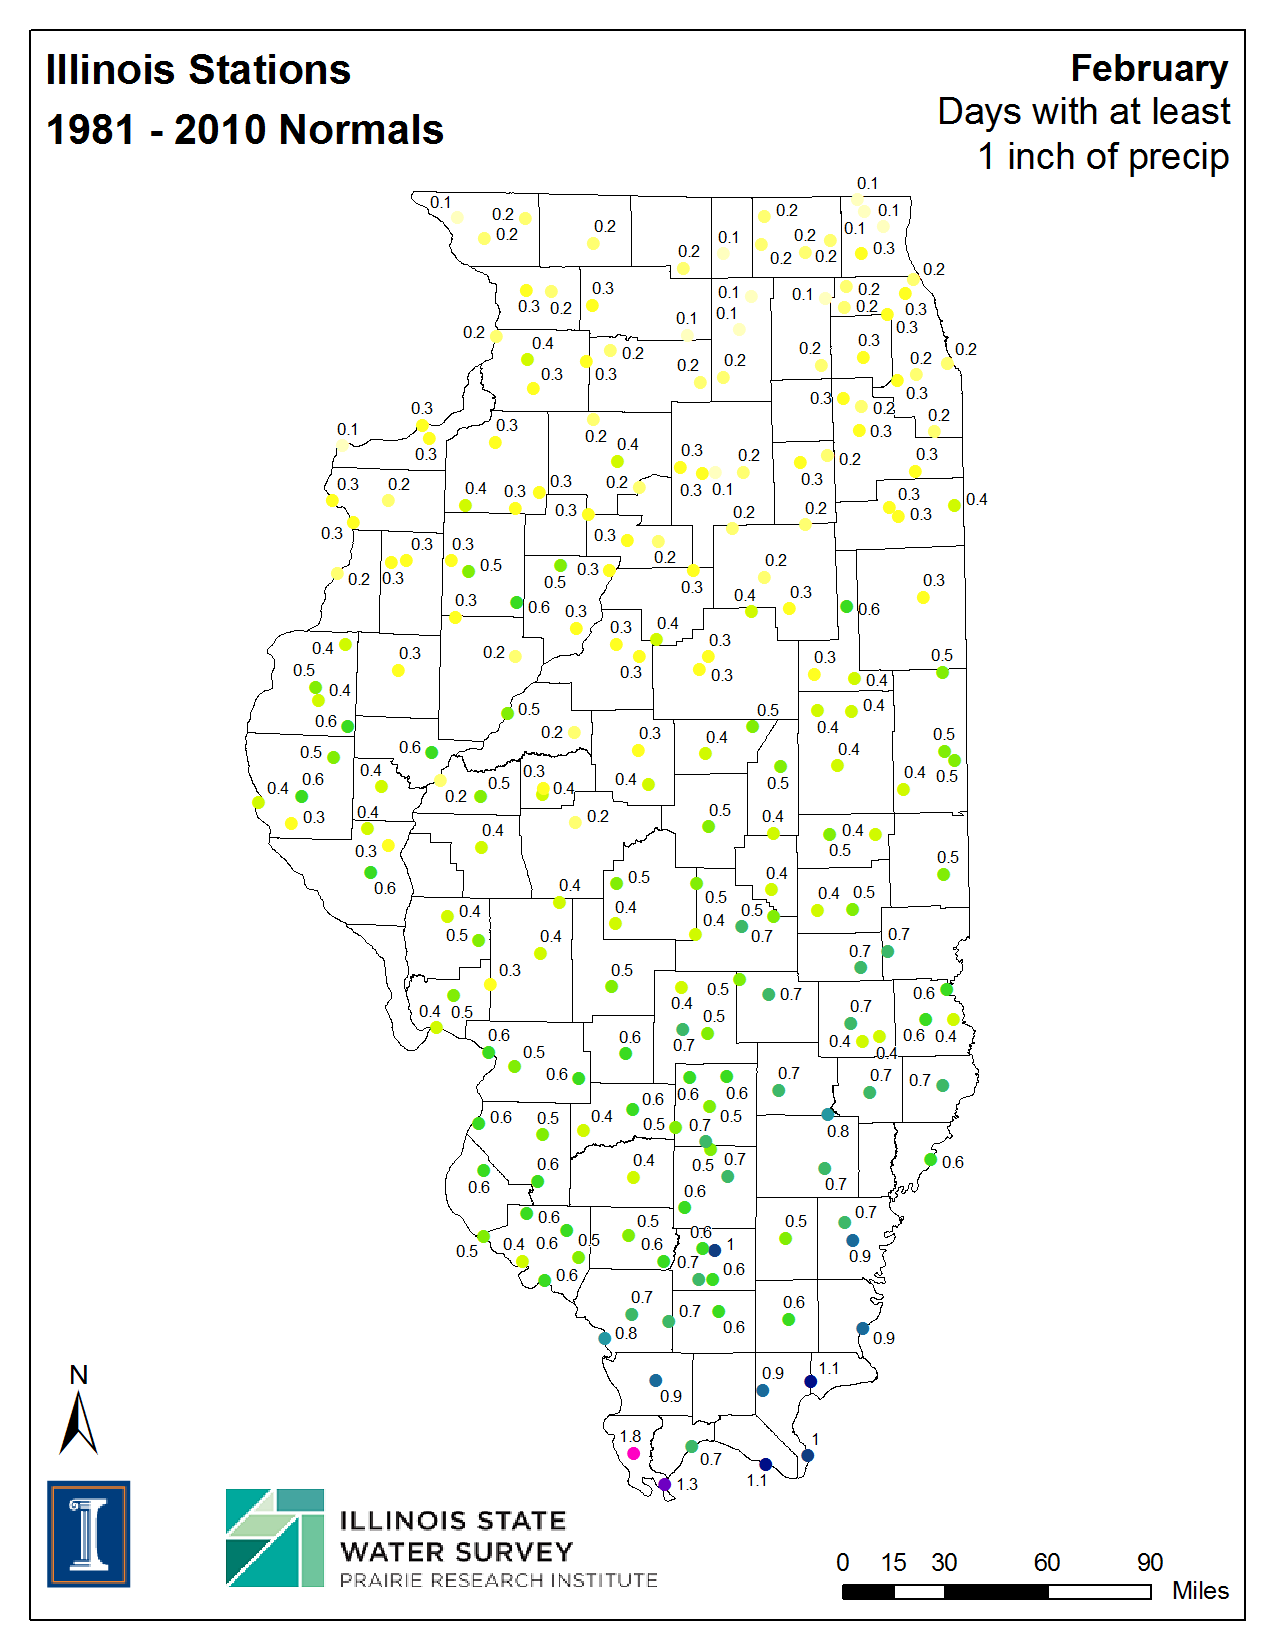
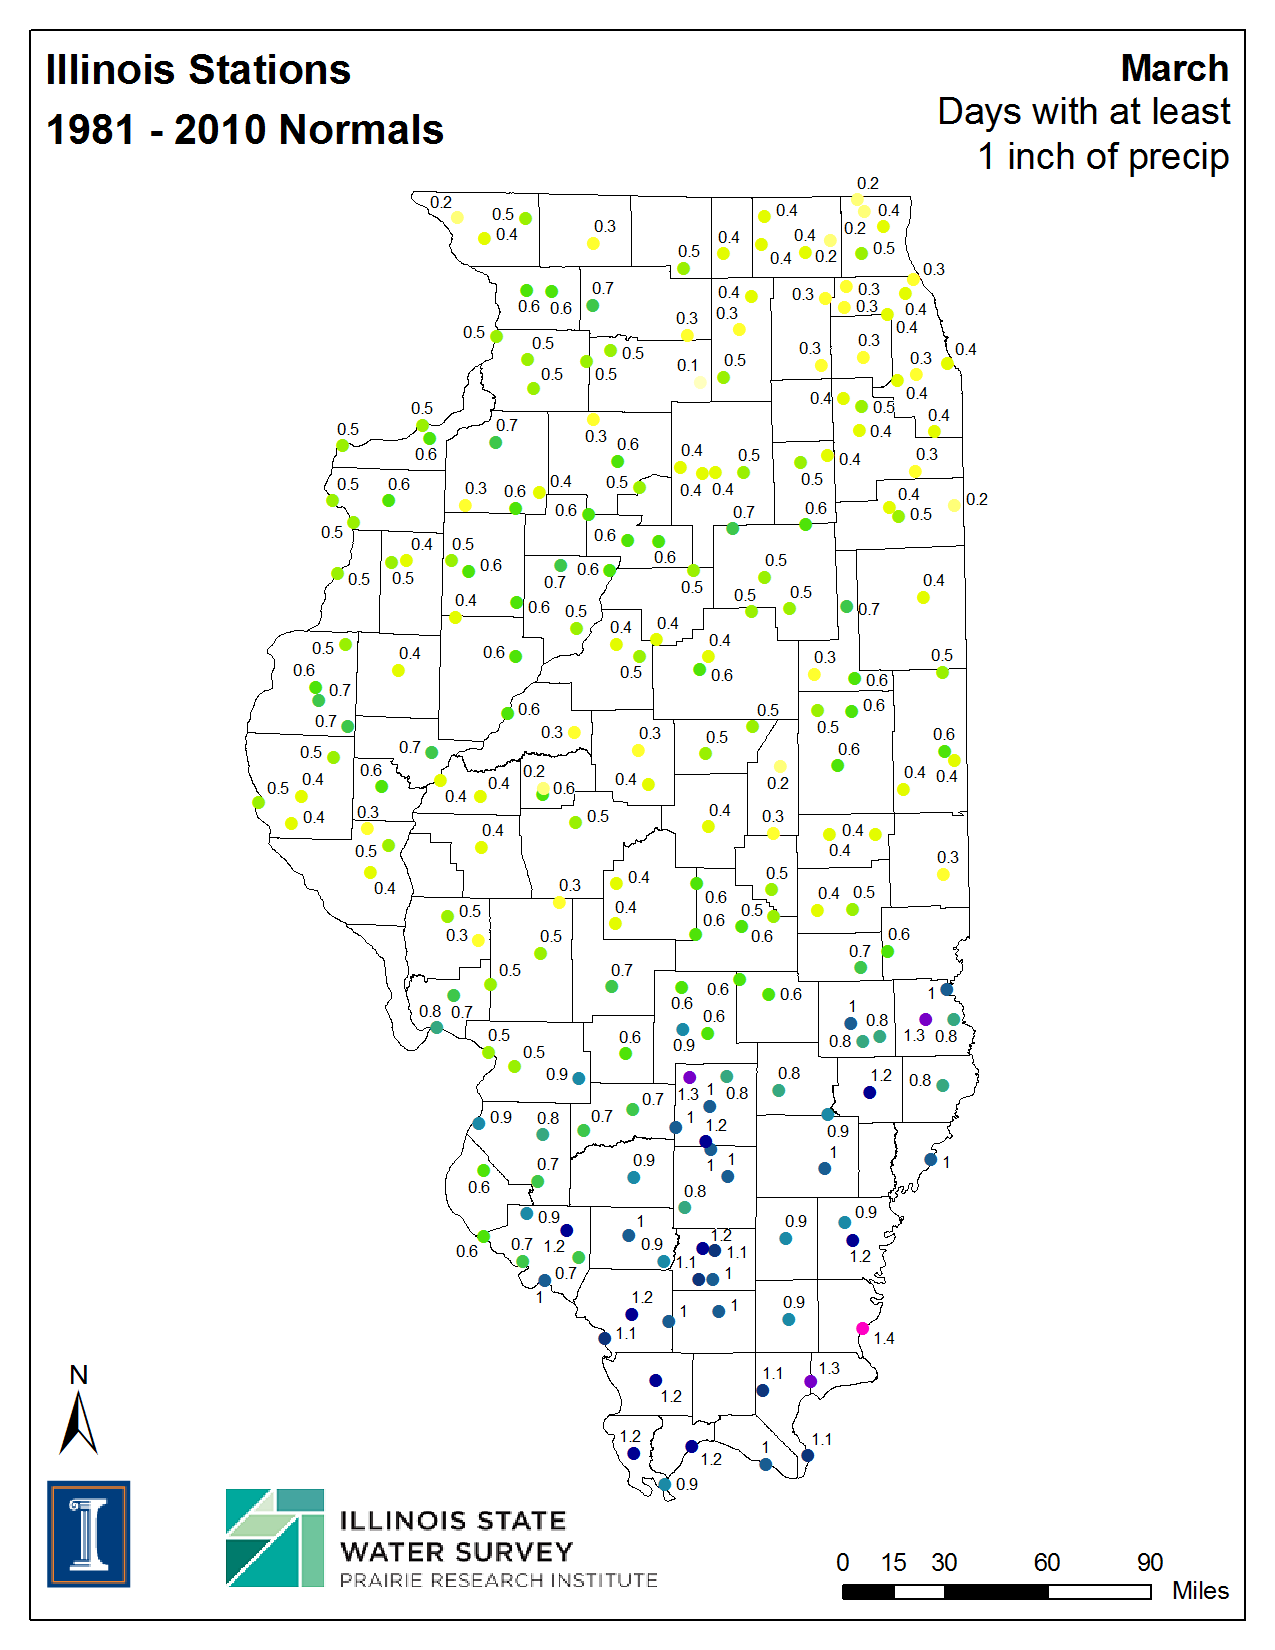
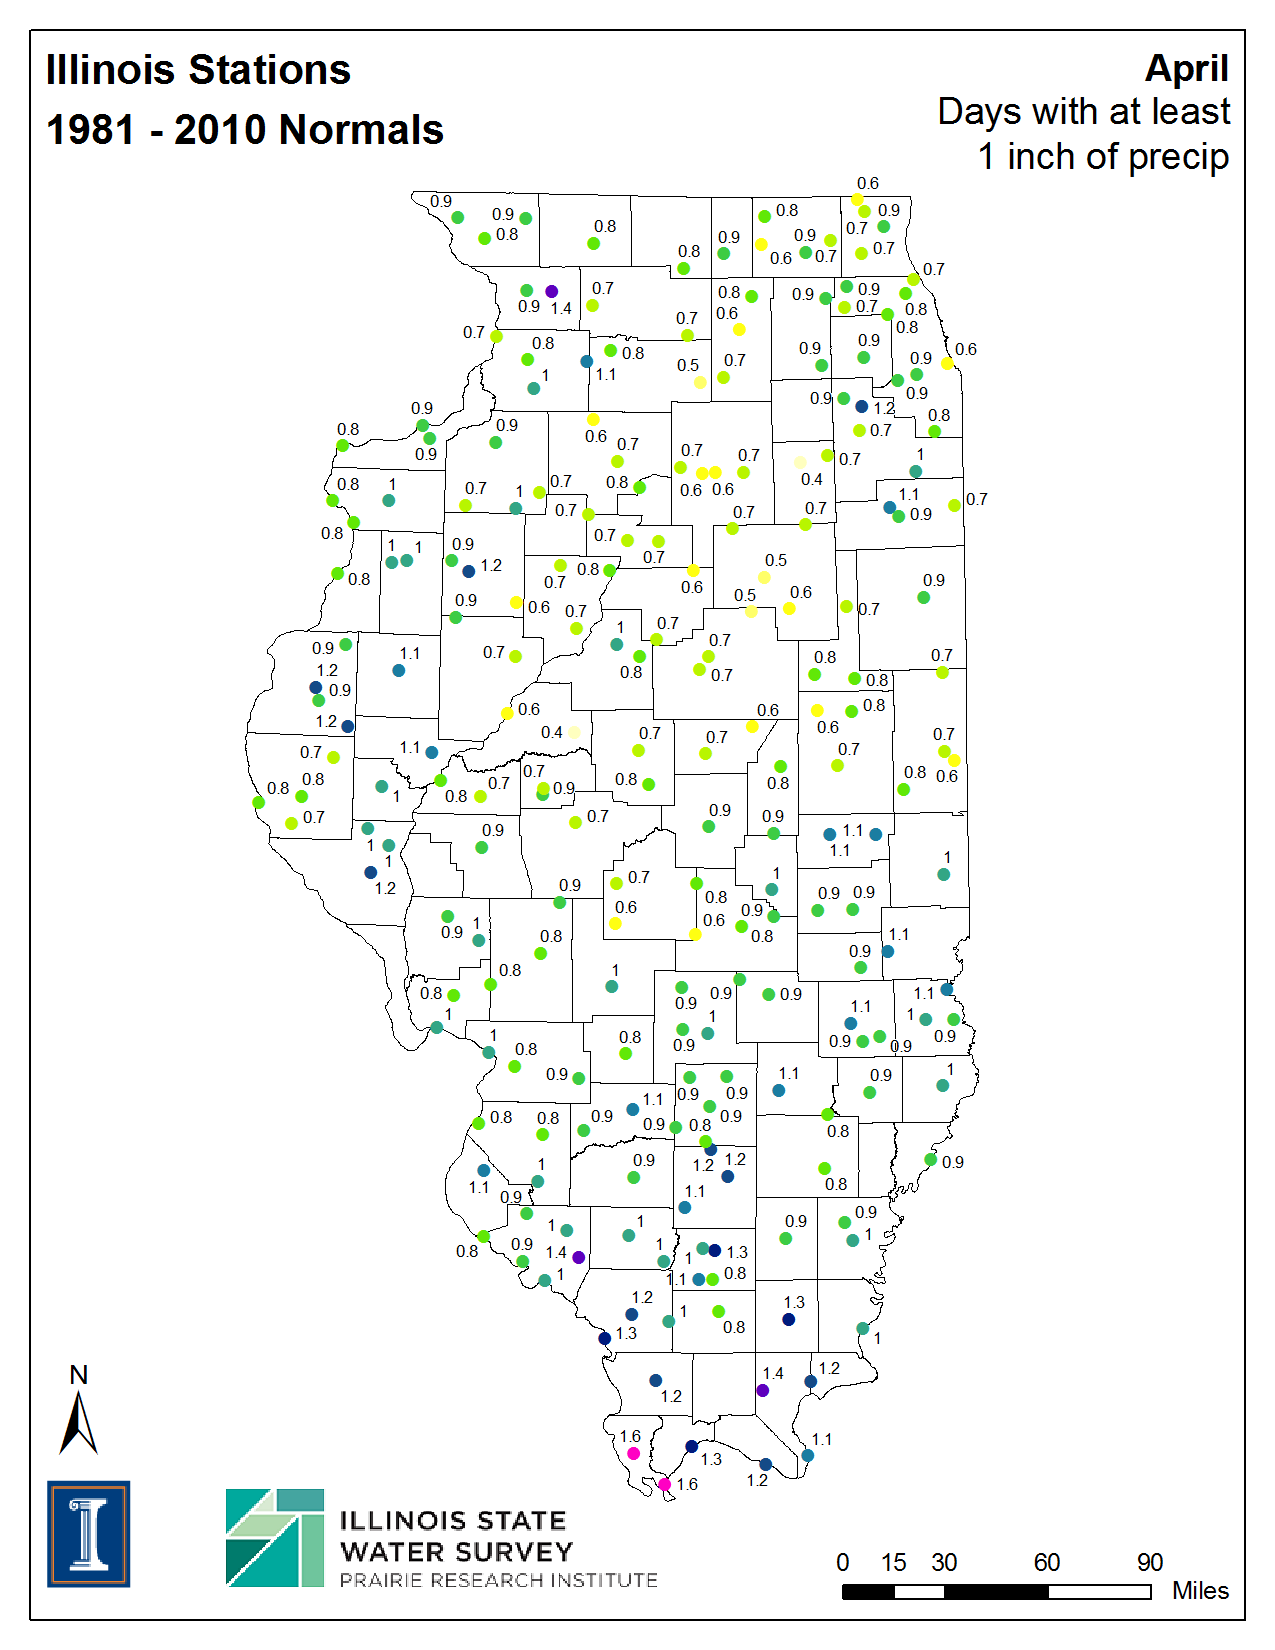
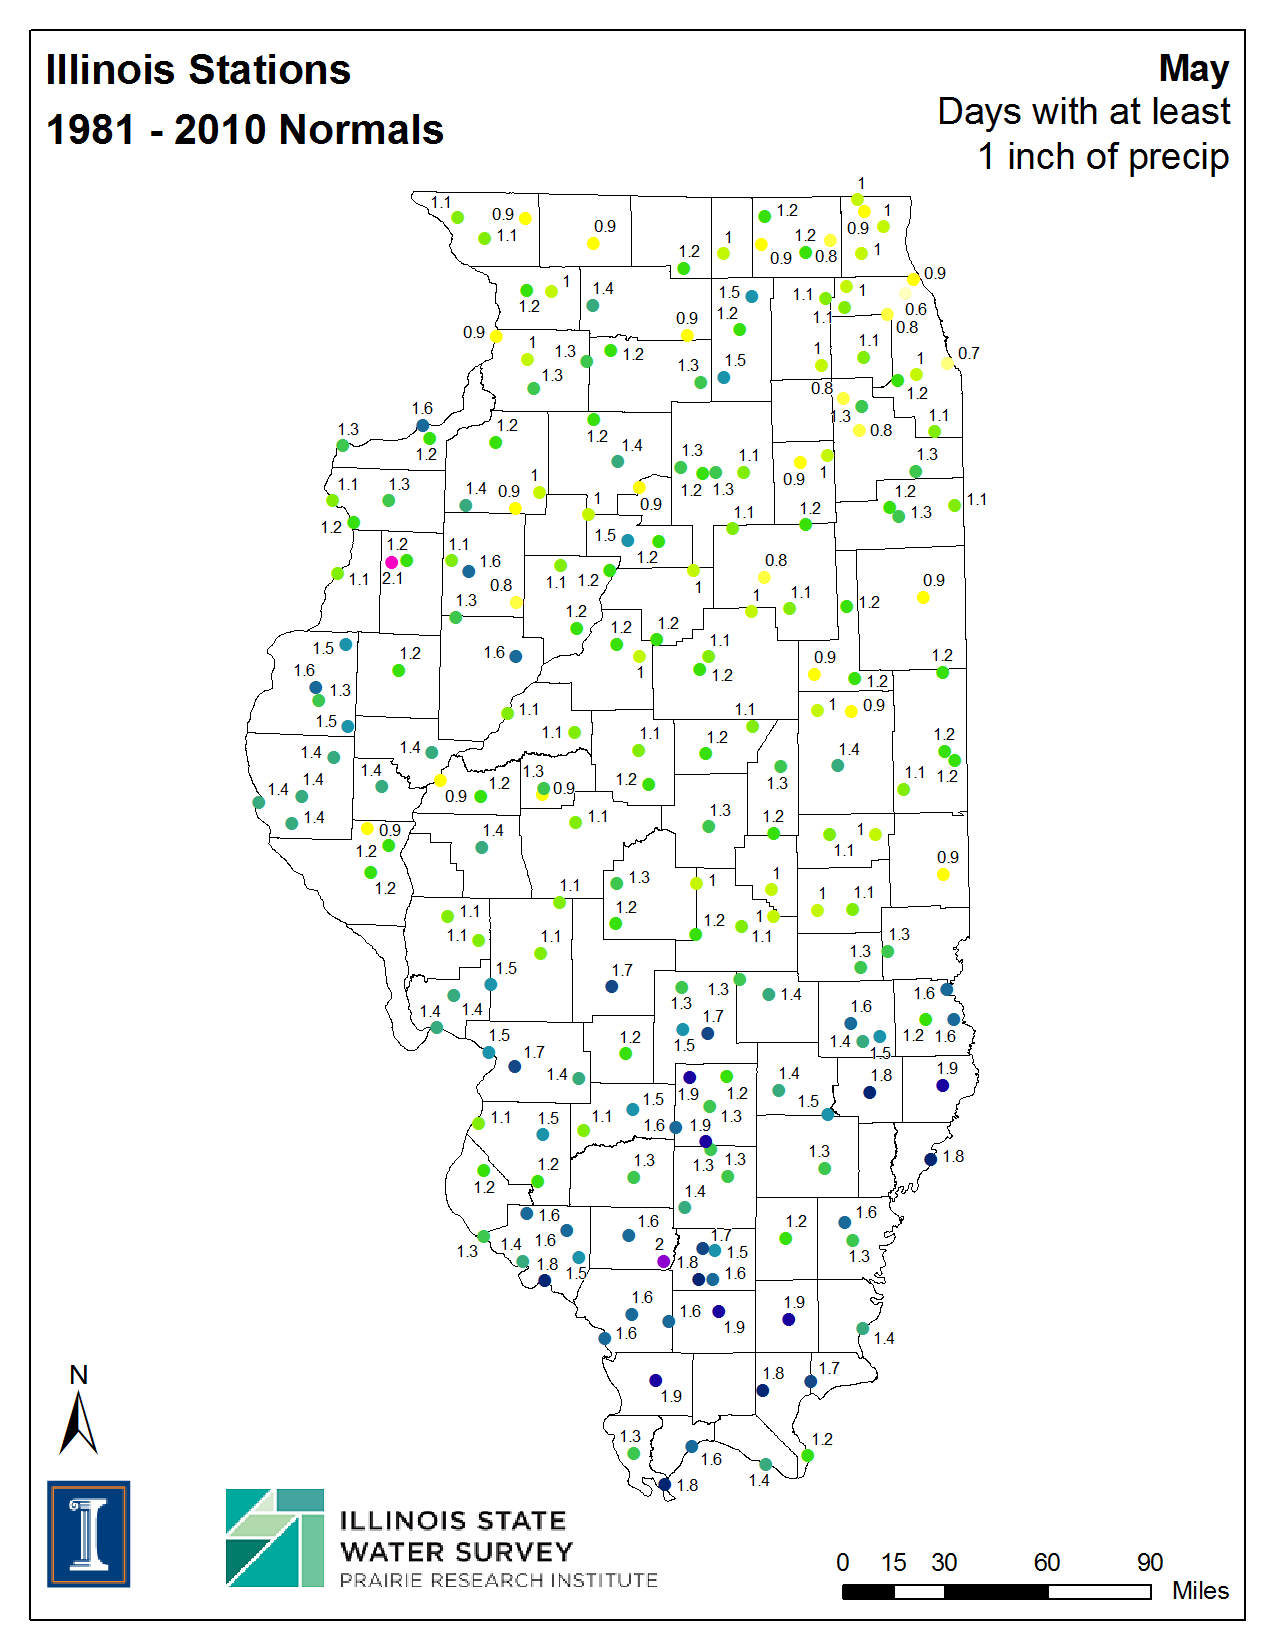
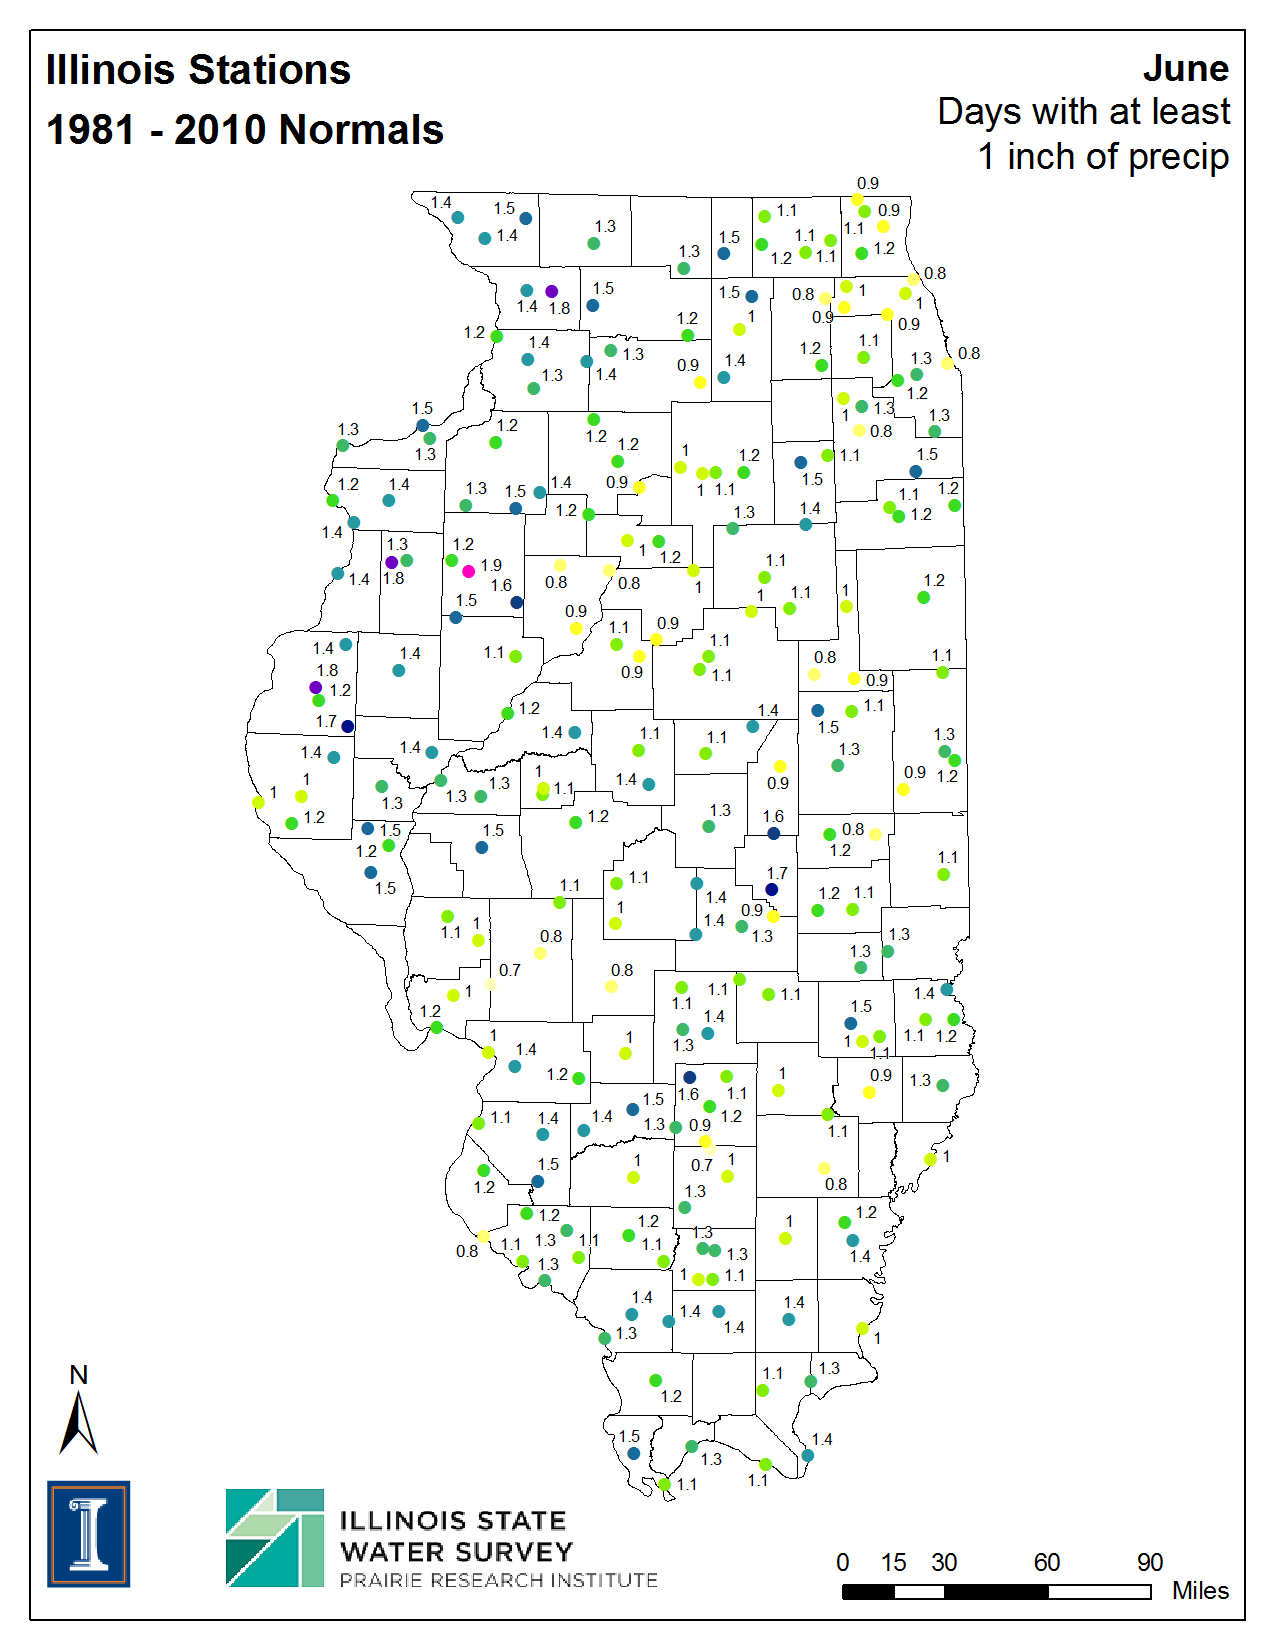
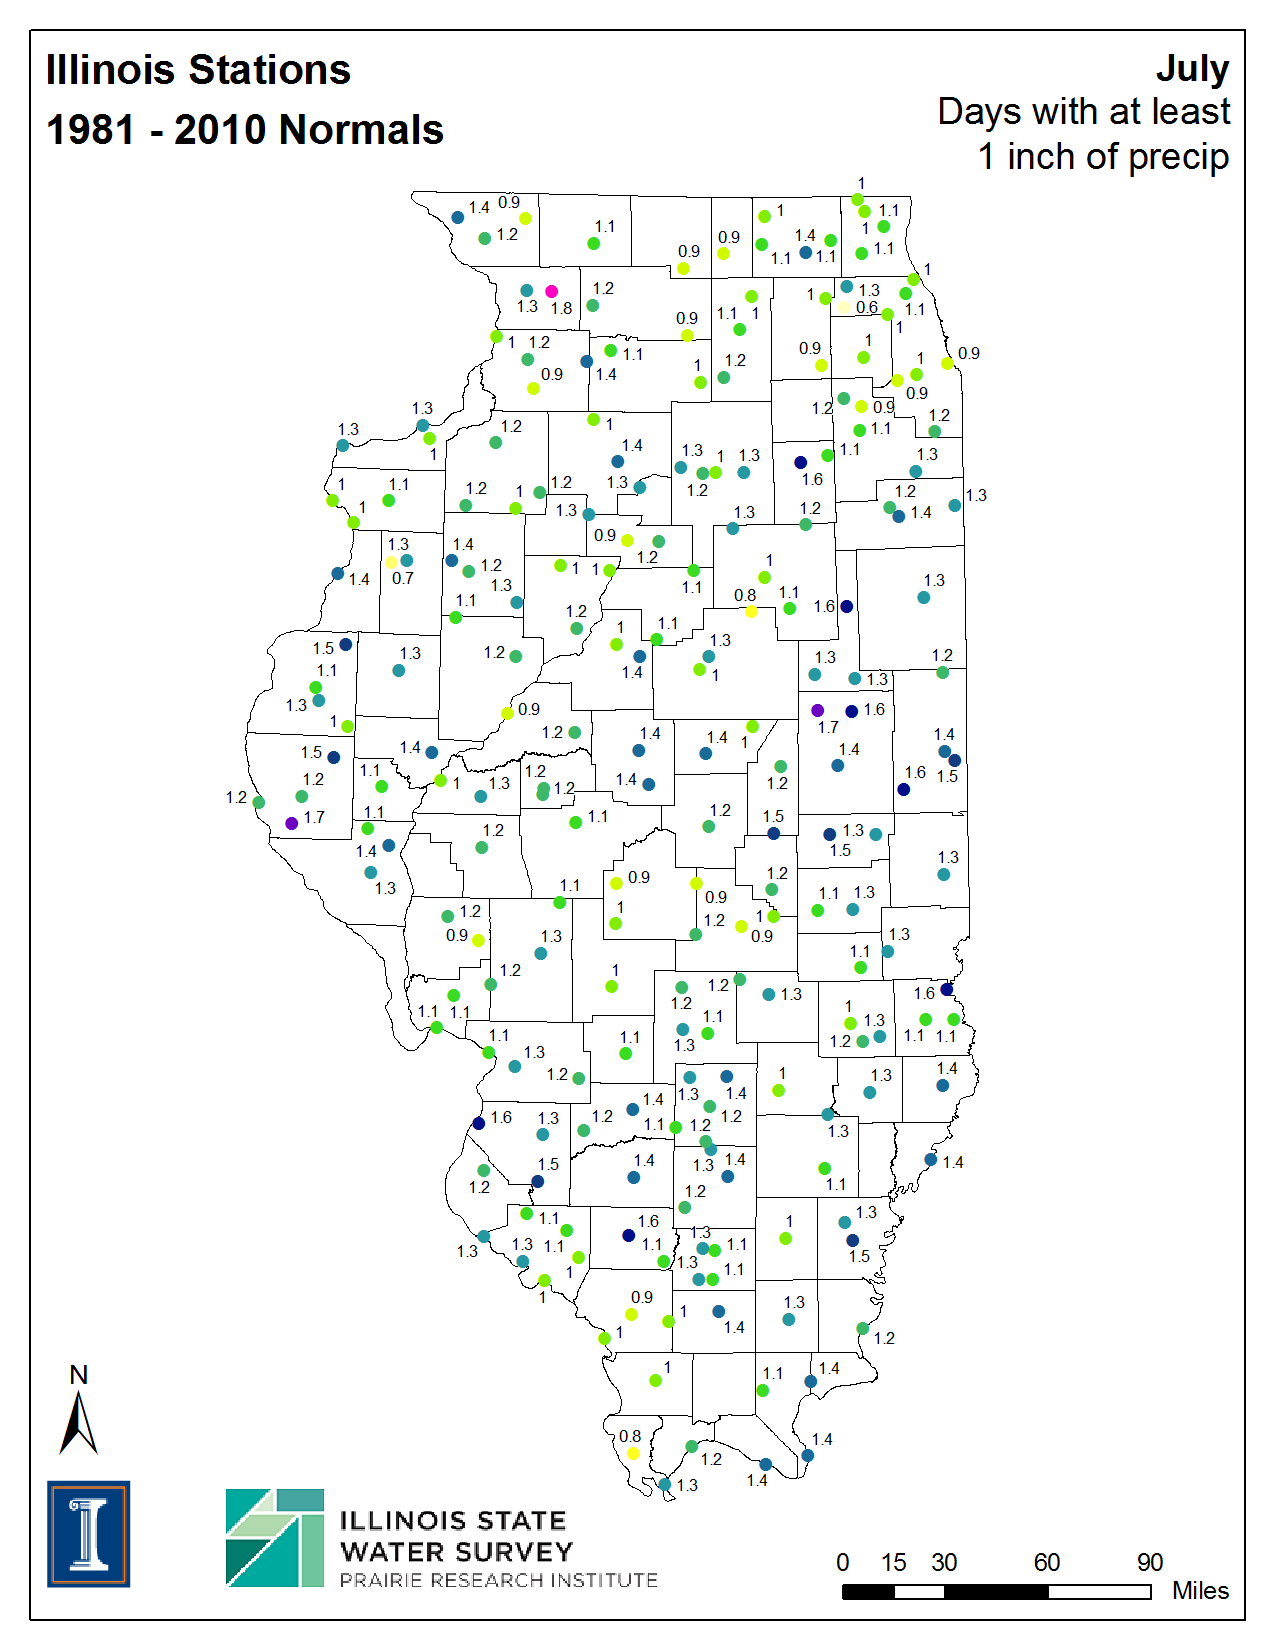
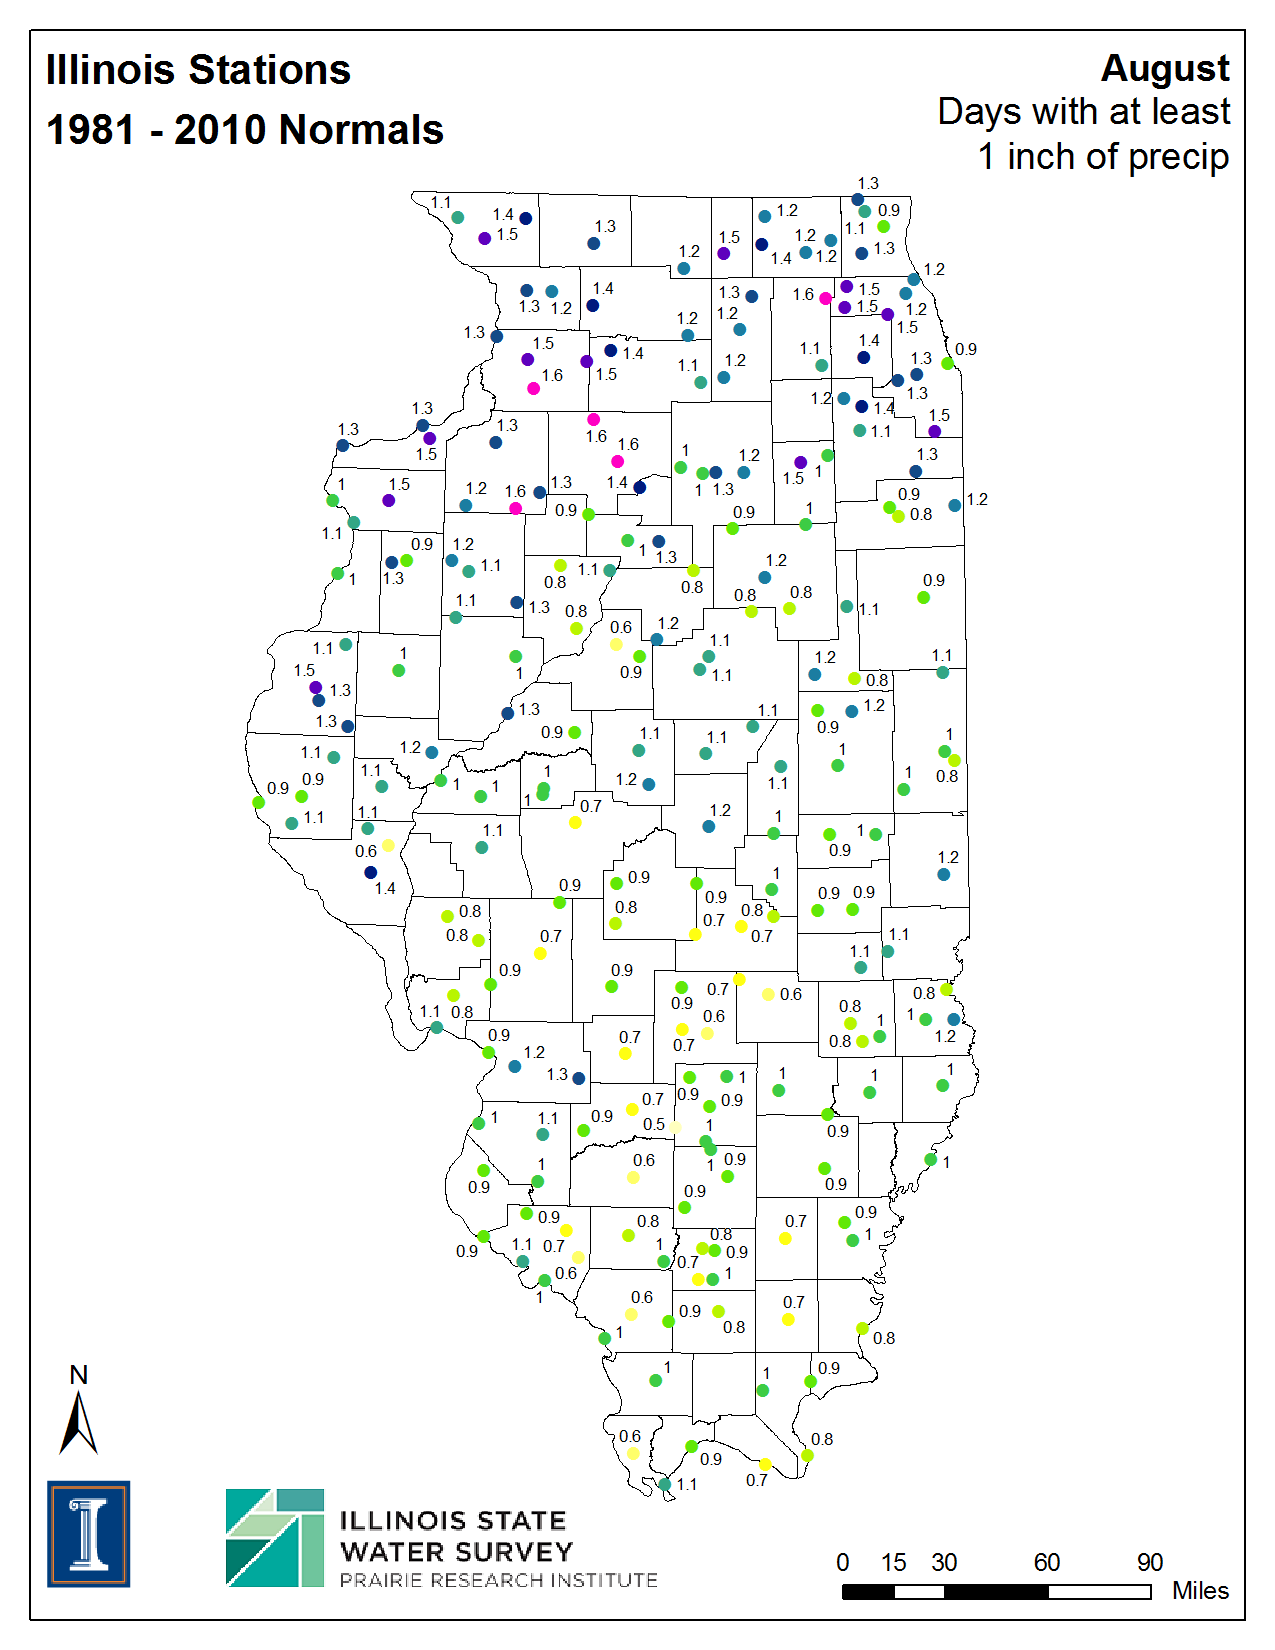
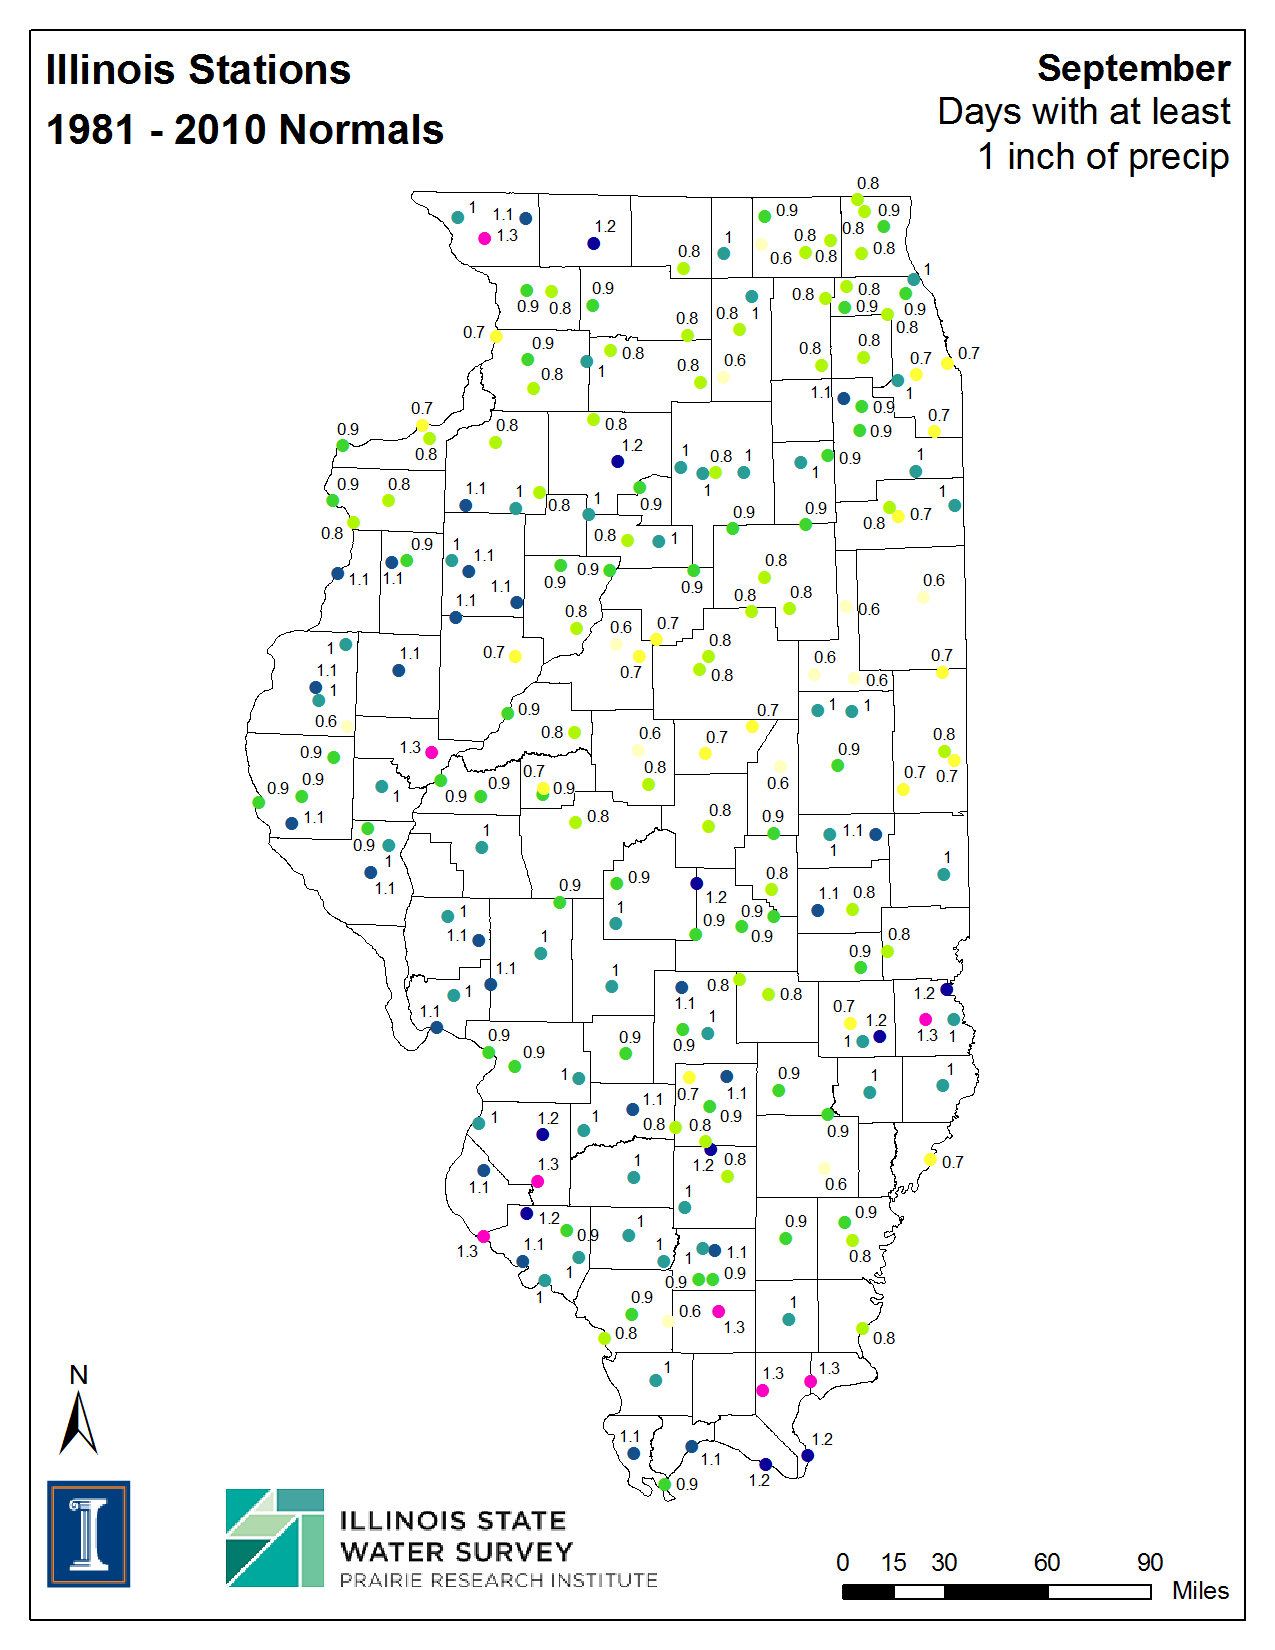
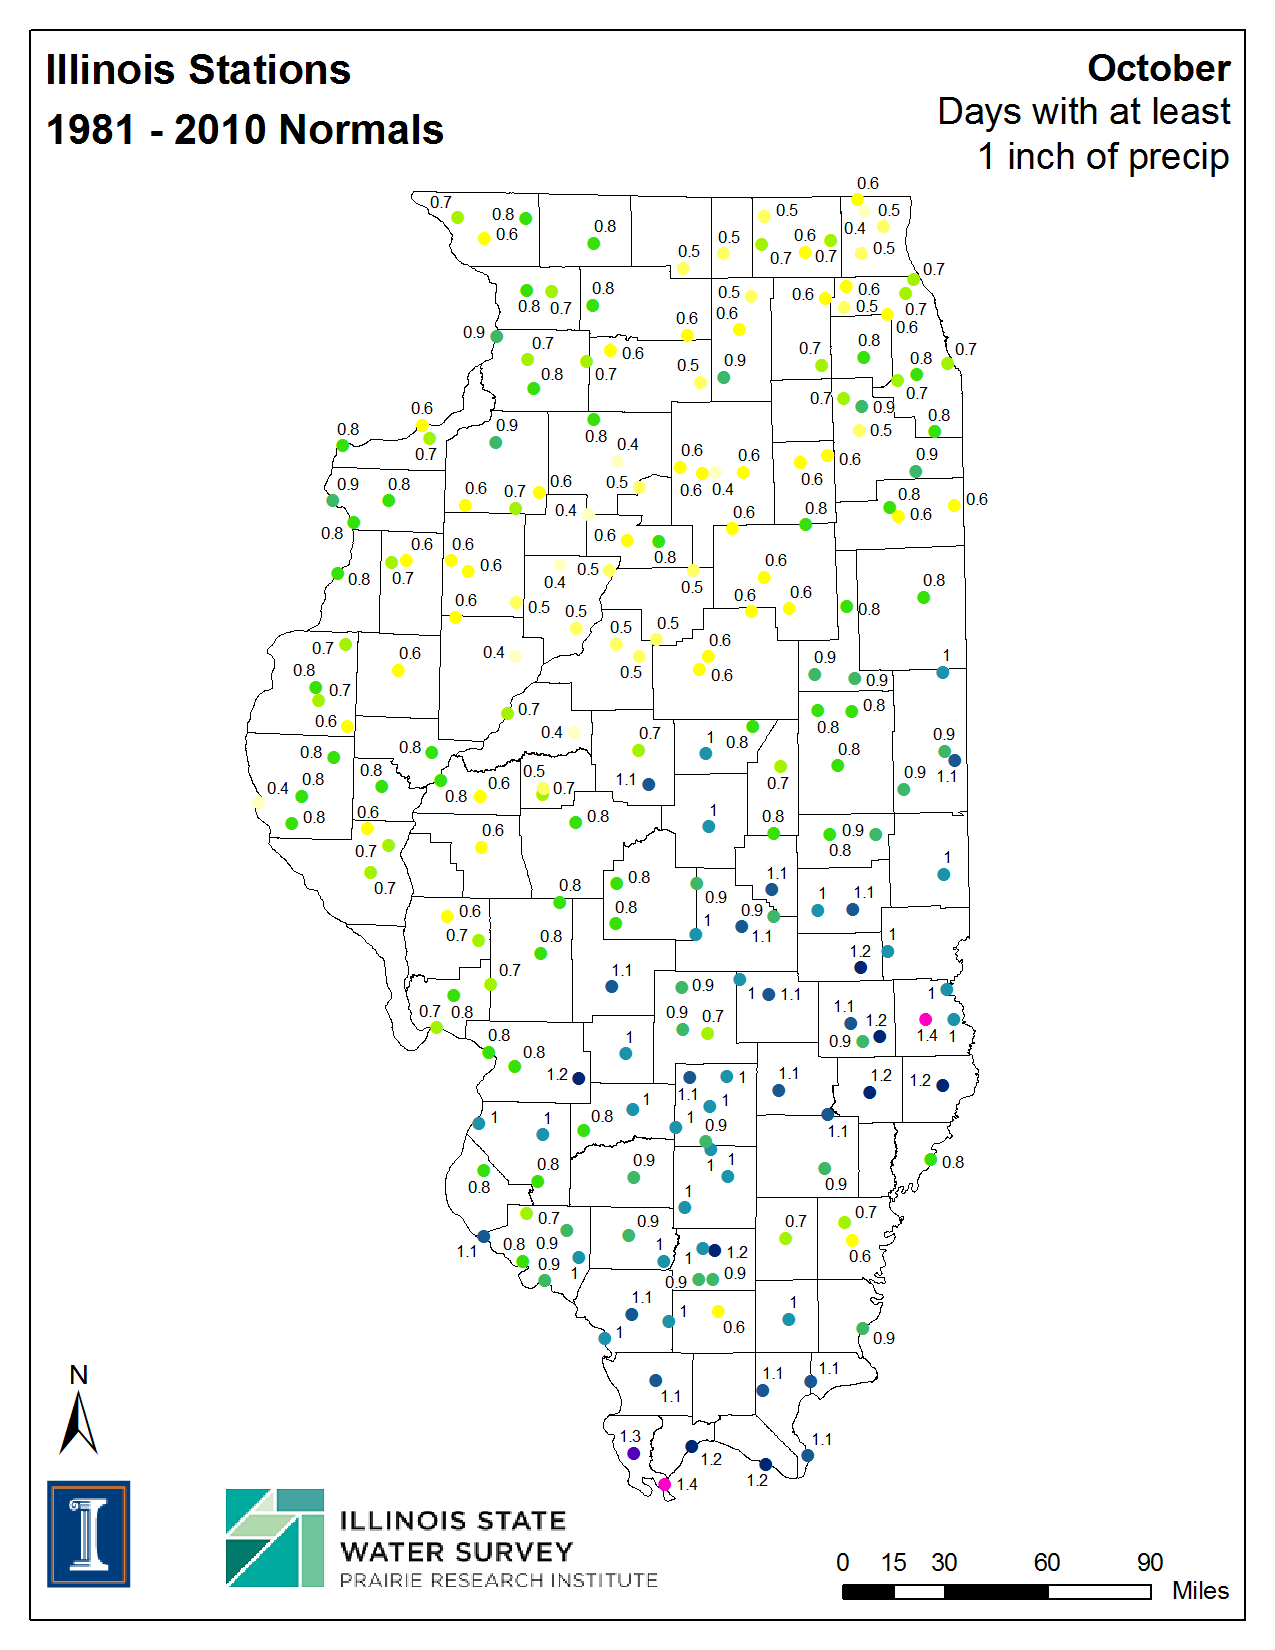
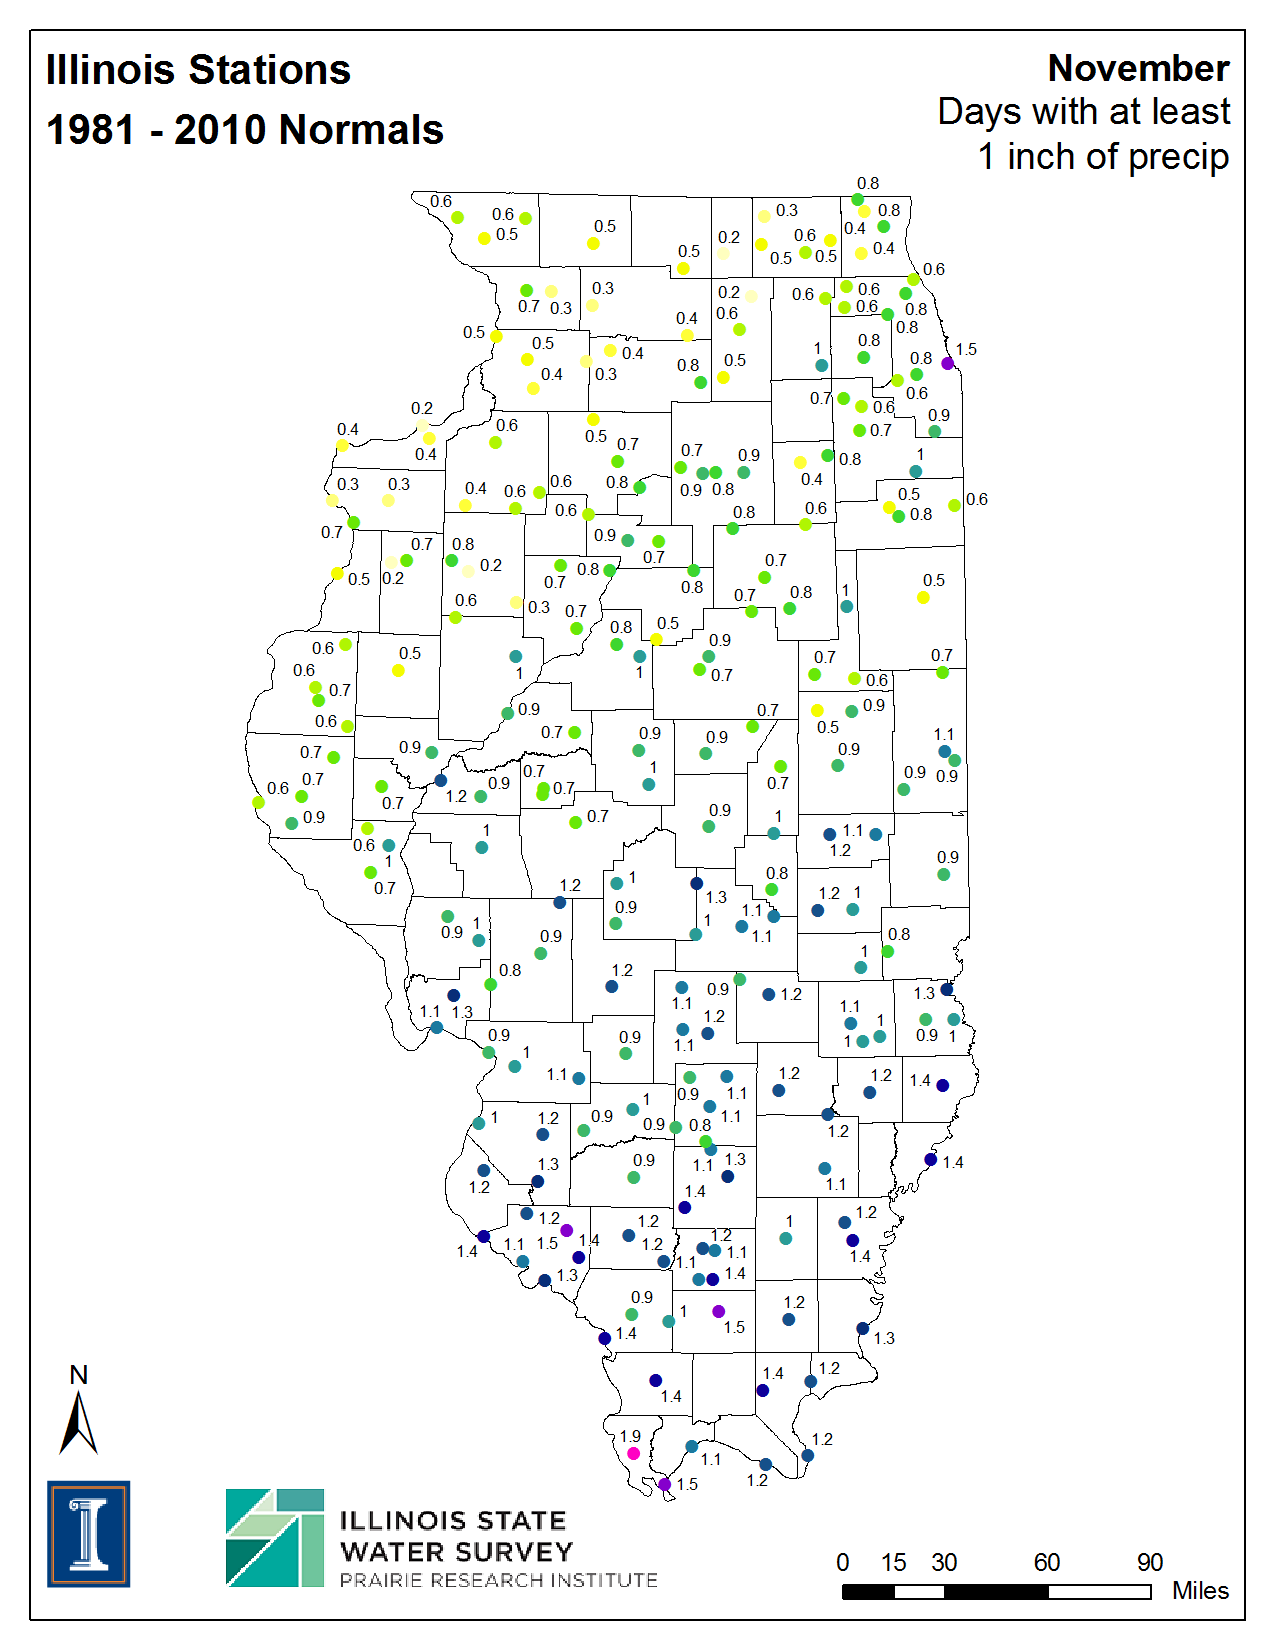
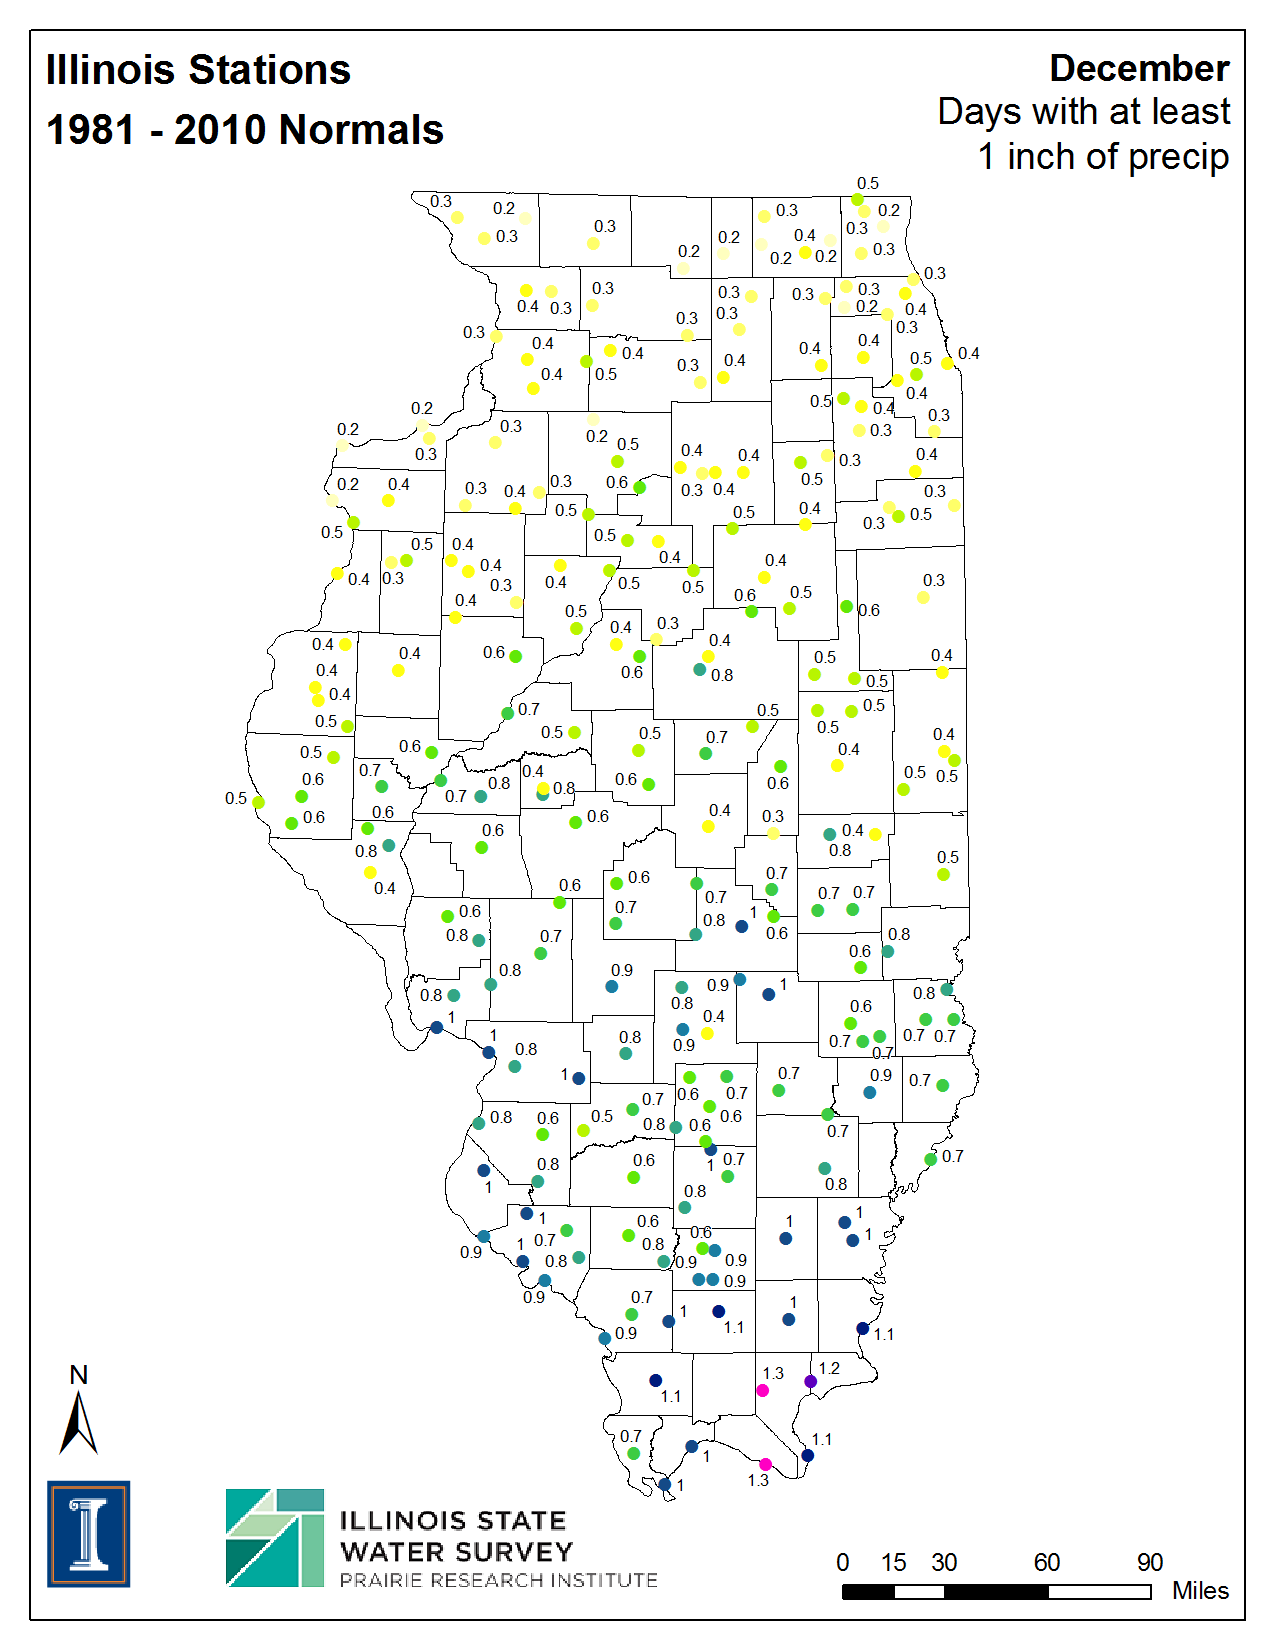
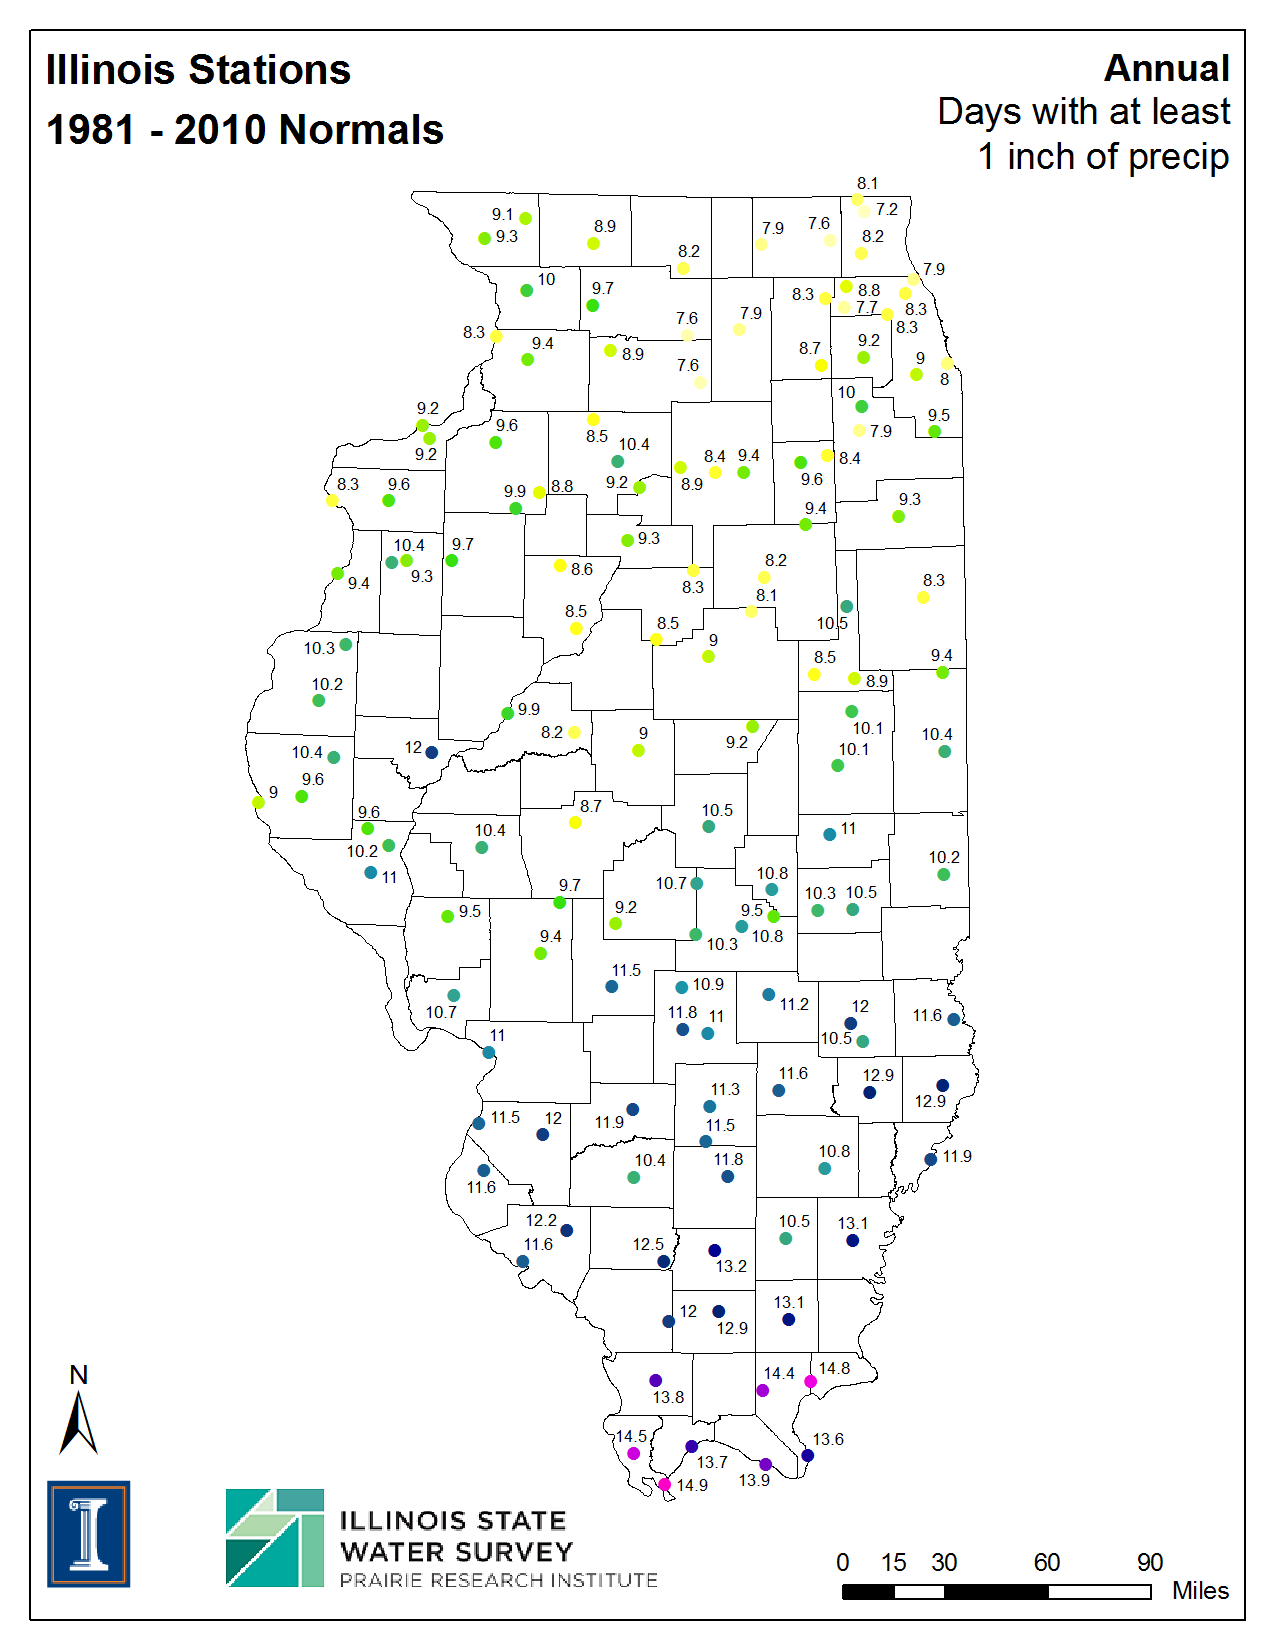
| Days with Precipitation Greater Than or Equal to 1.00 inches | ||||||
| Jan | Feb | Mar | Apr | May | Jun | |
| Jul | Aug | Sep | Oct | Nov | Dec | Annual |
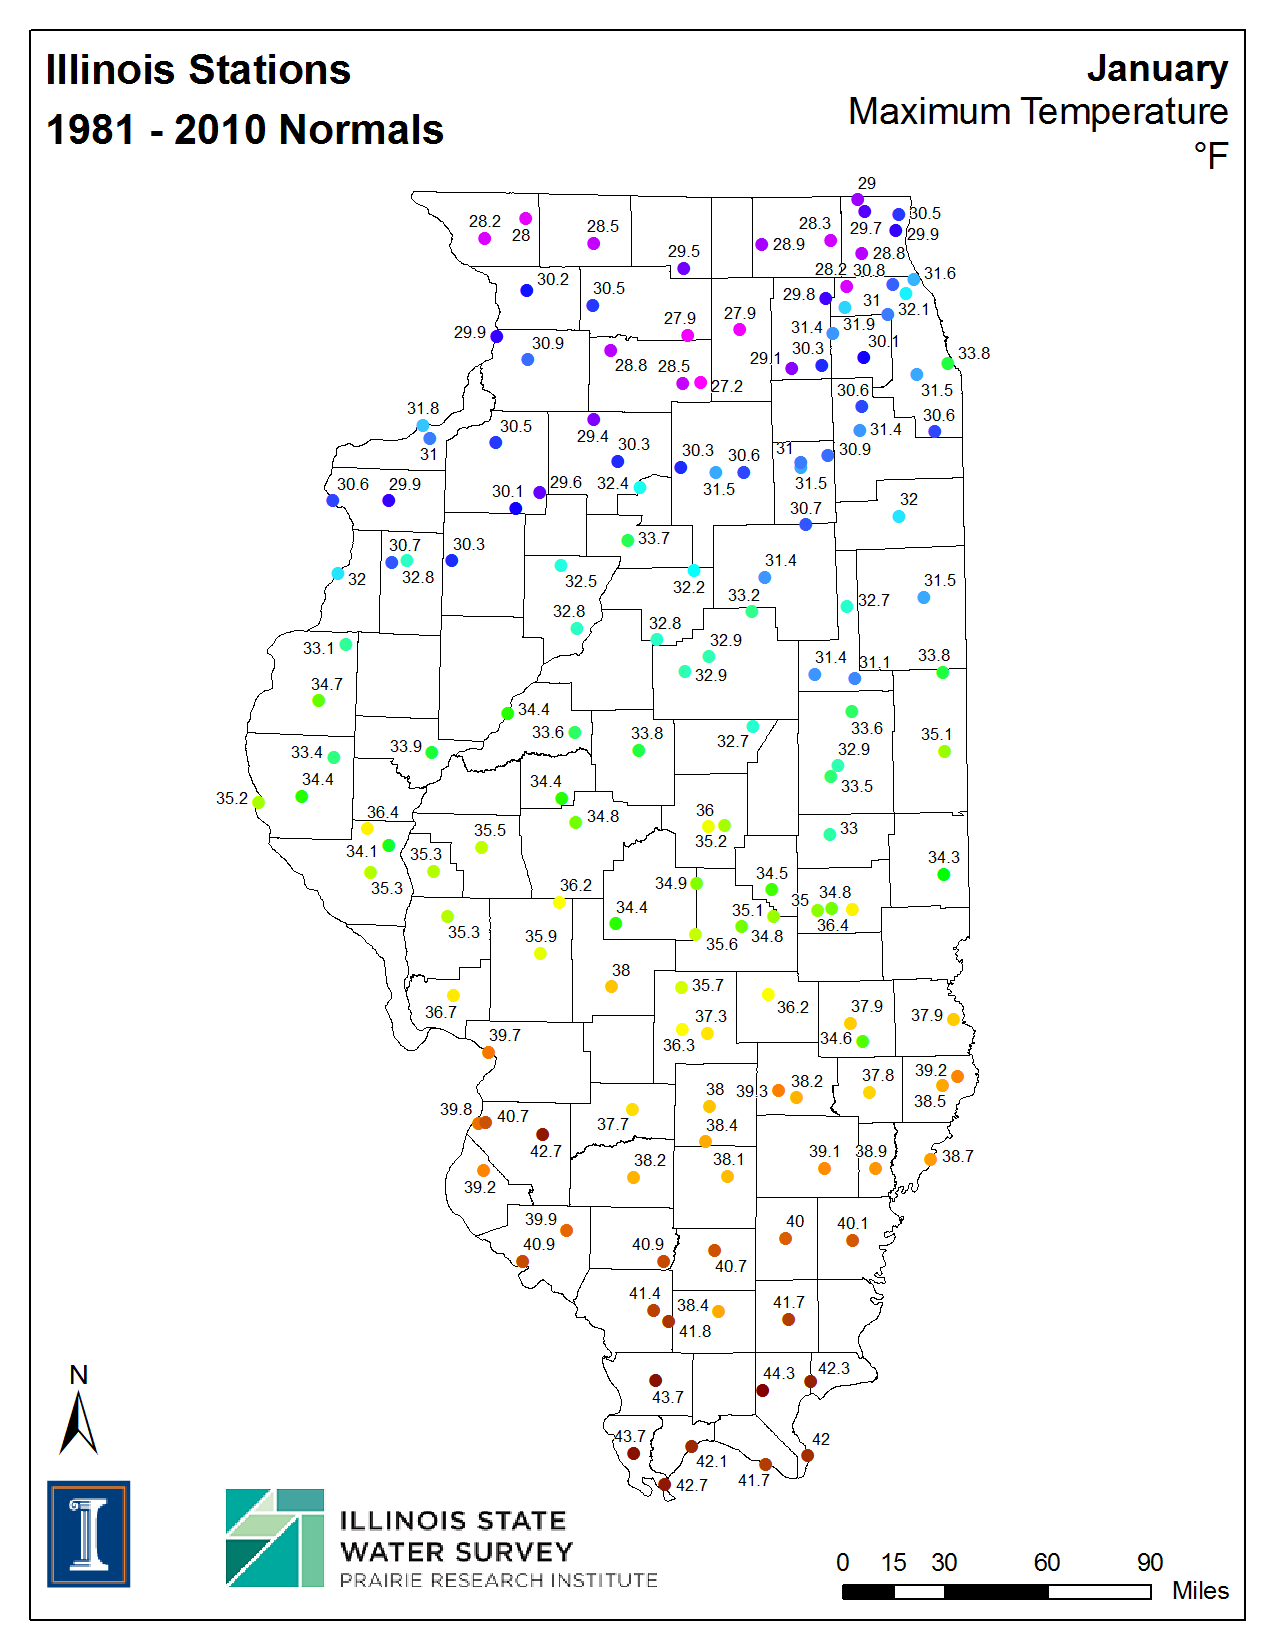
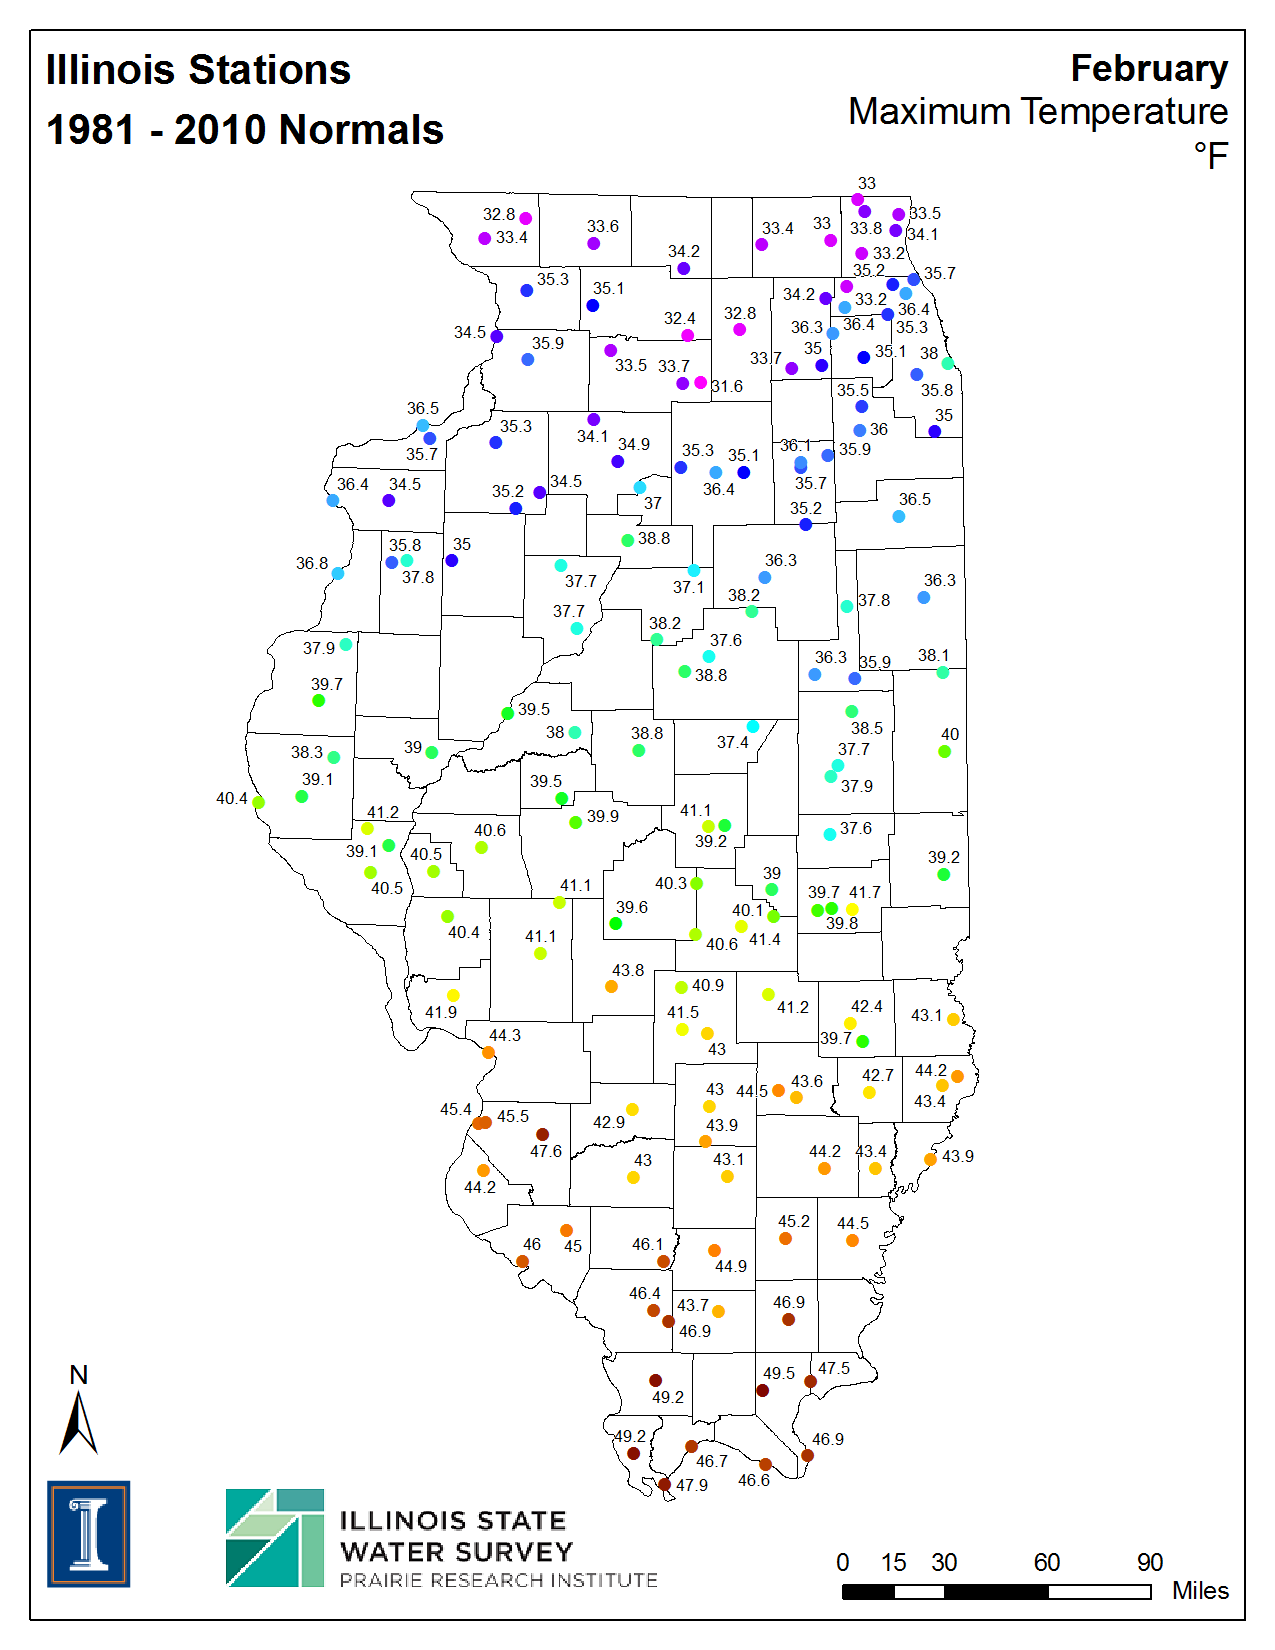
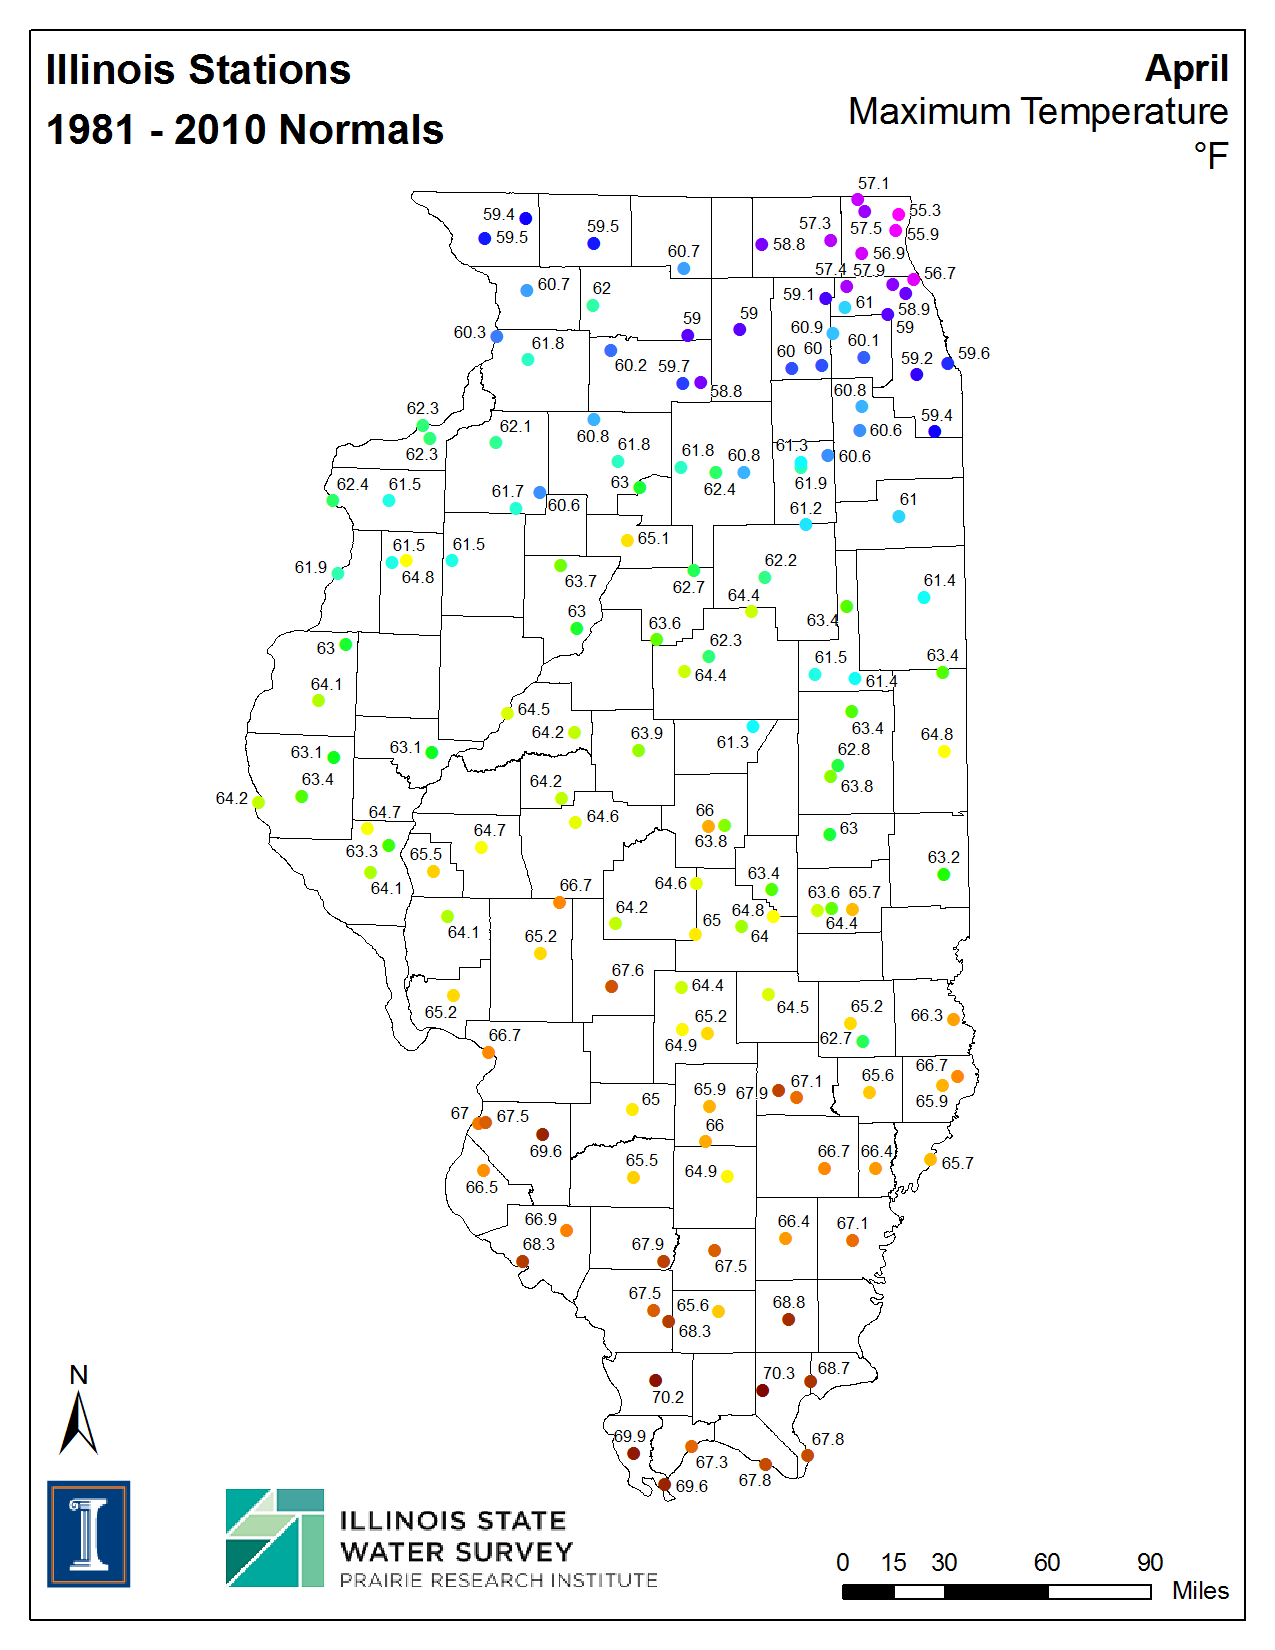
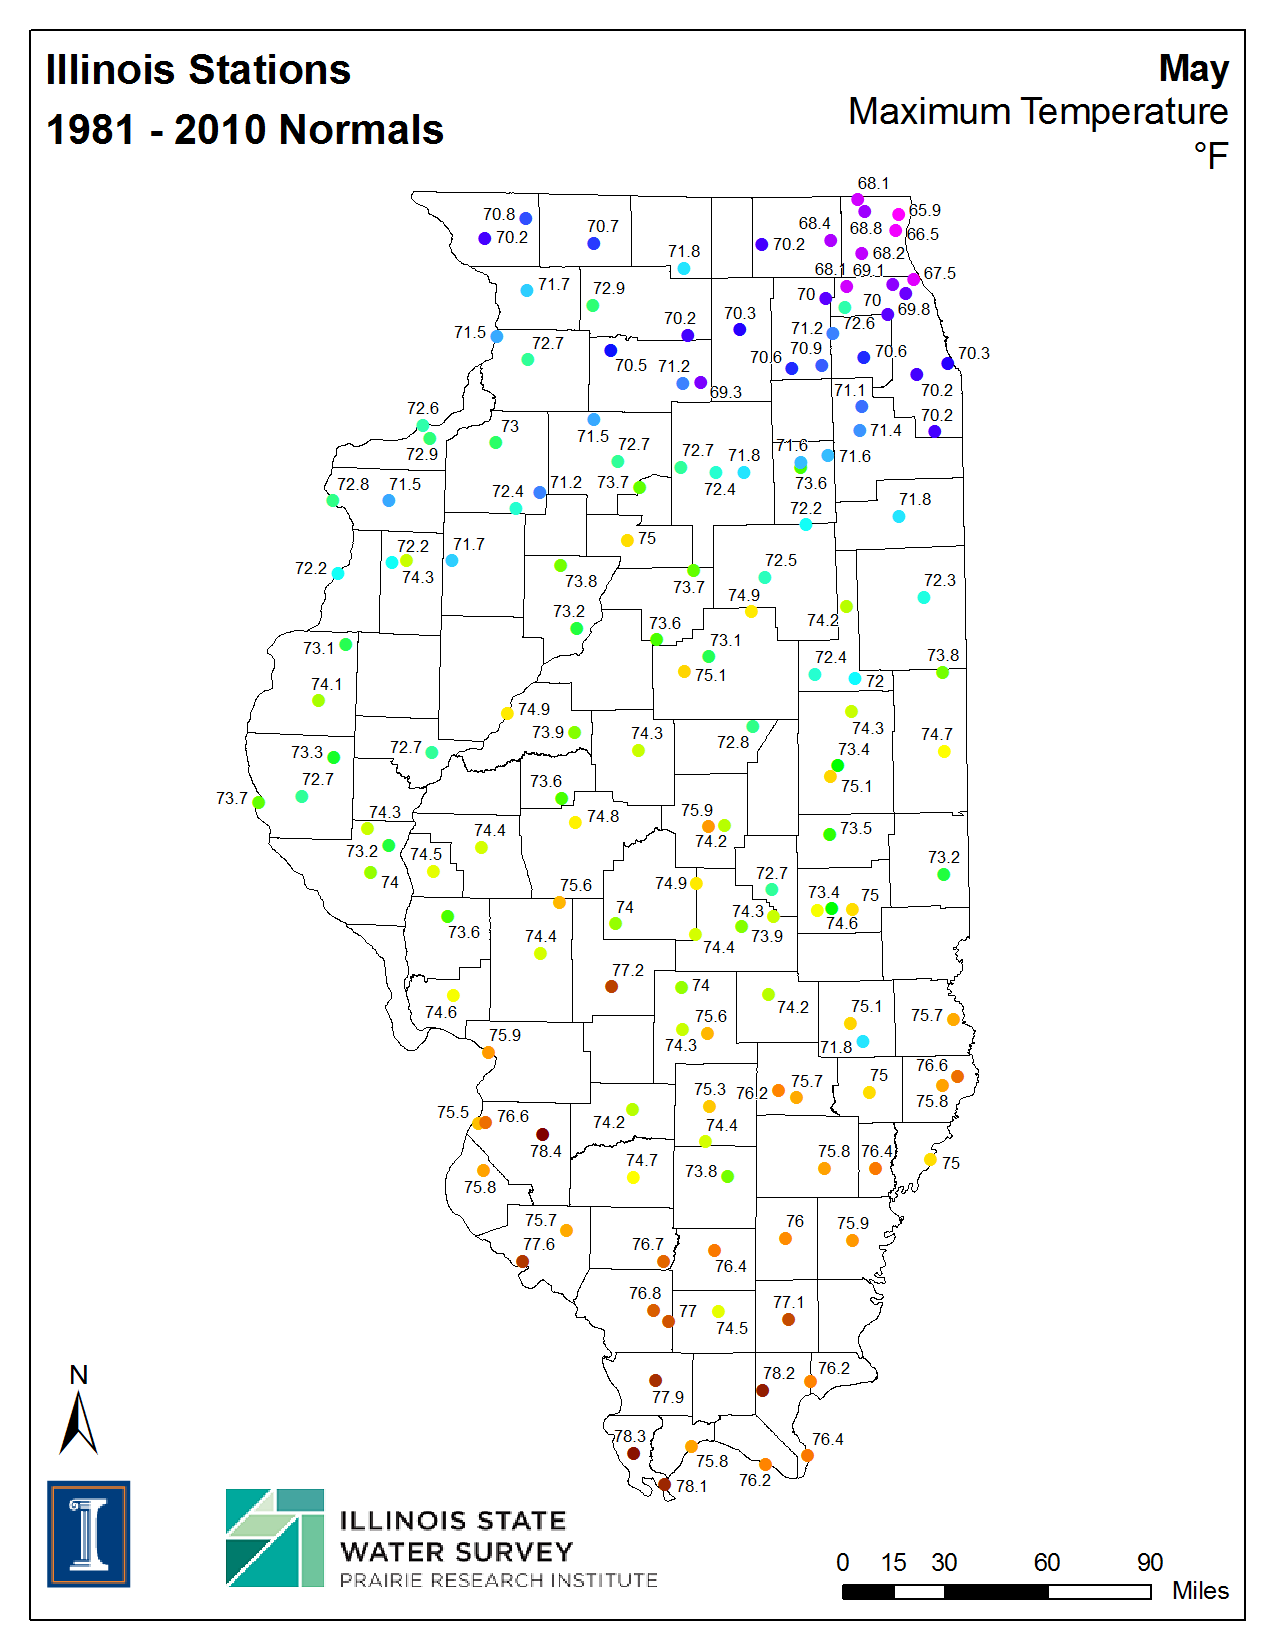
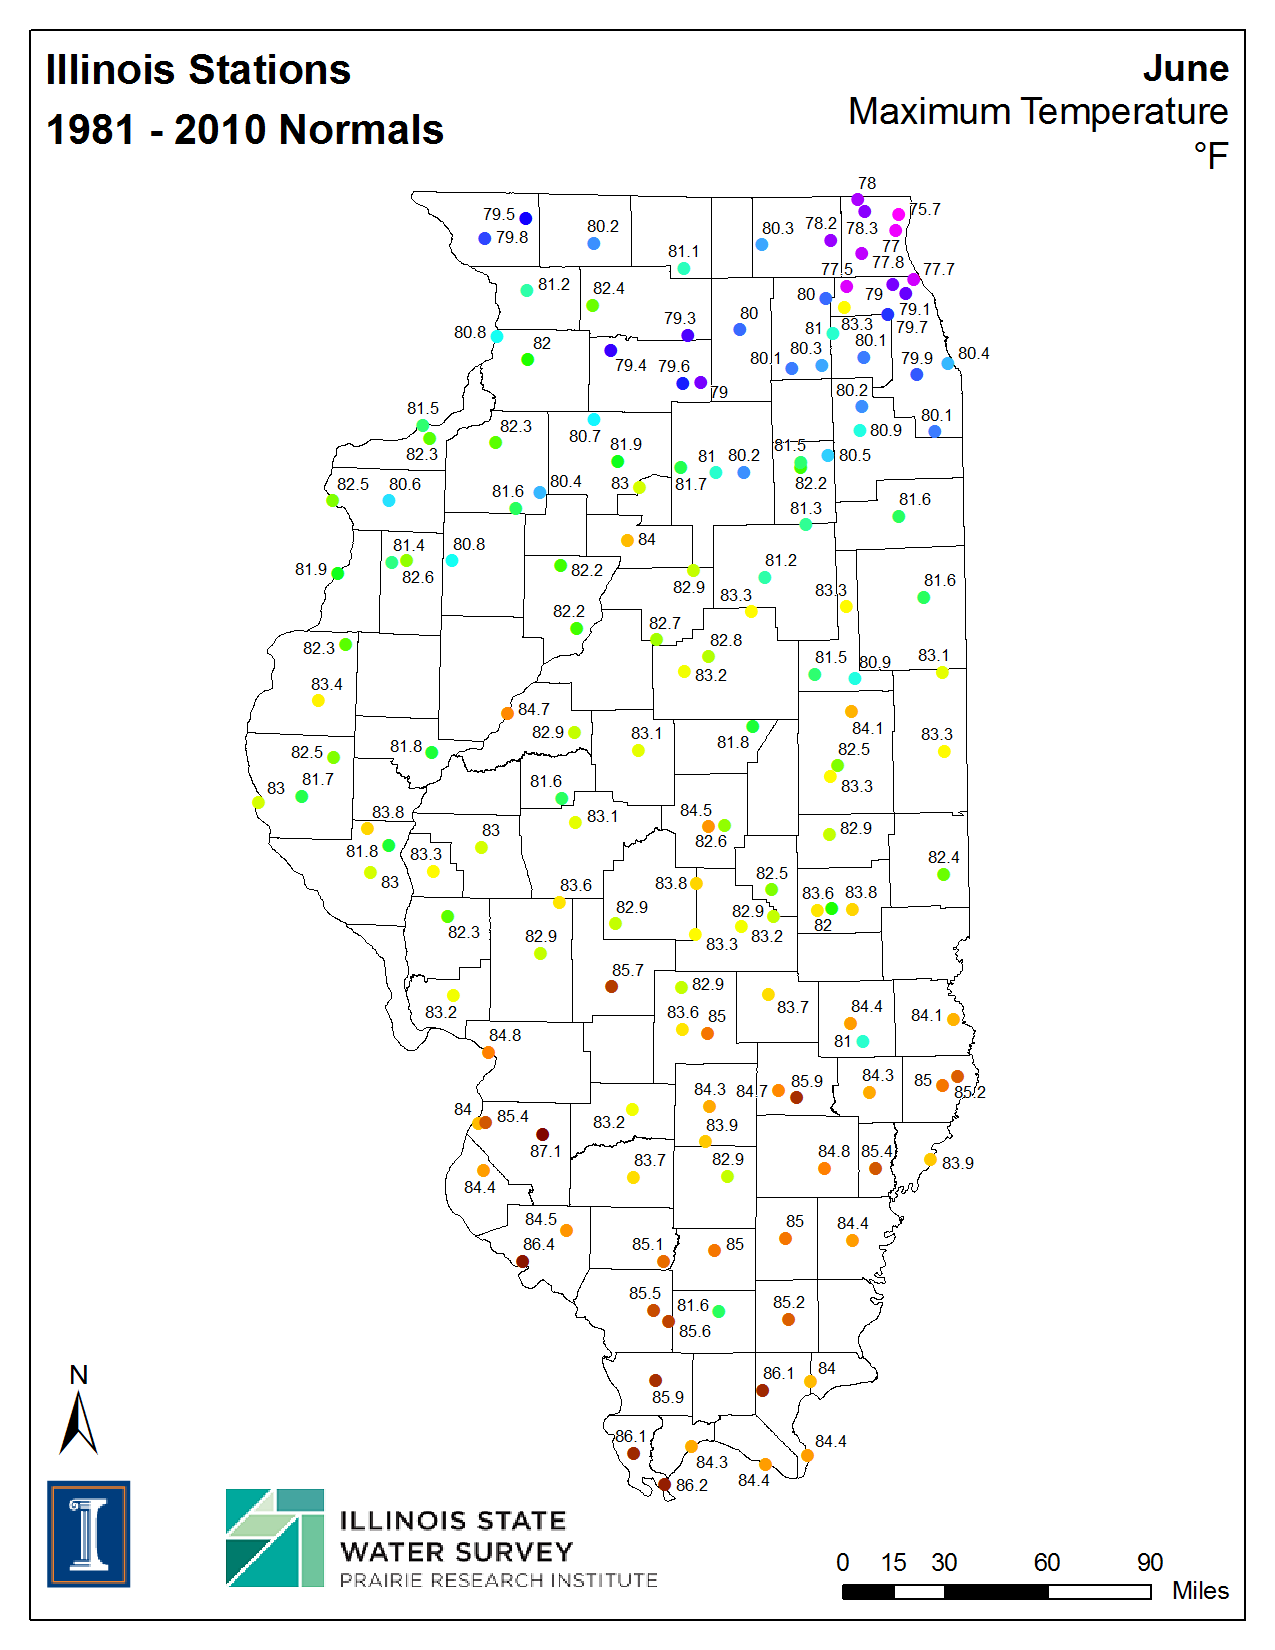
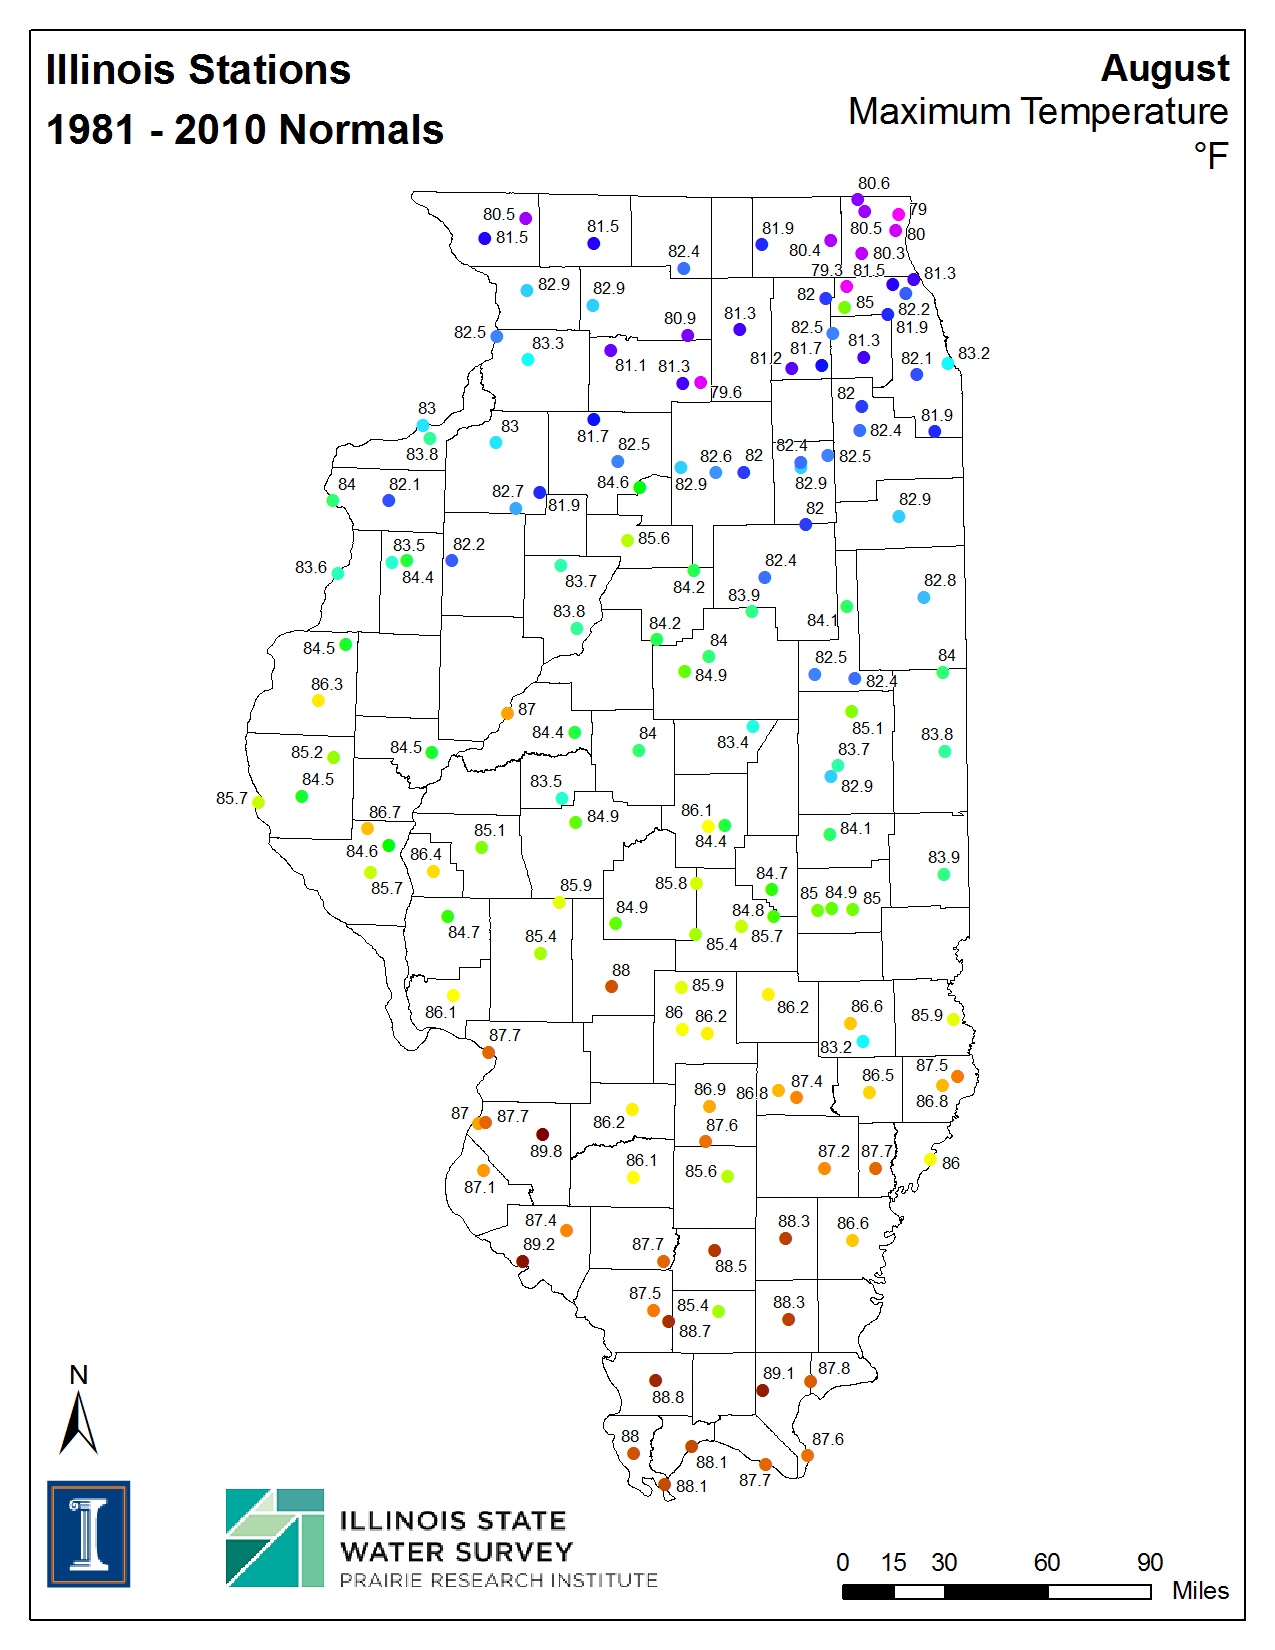
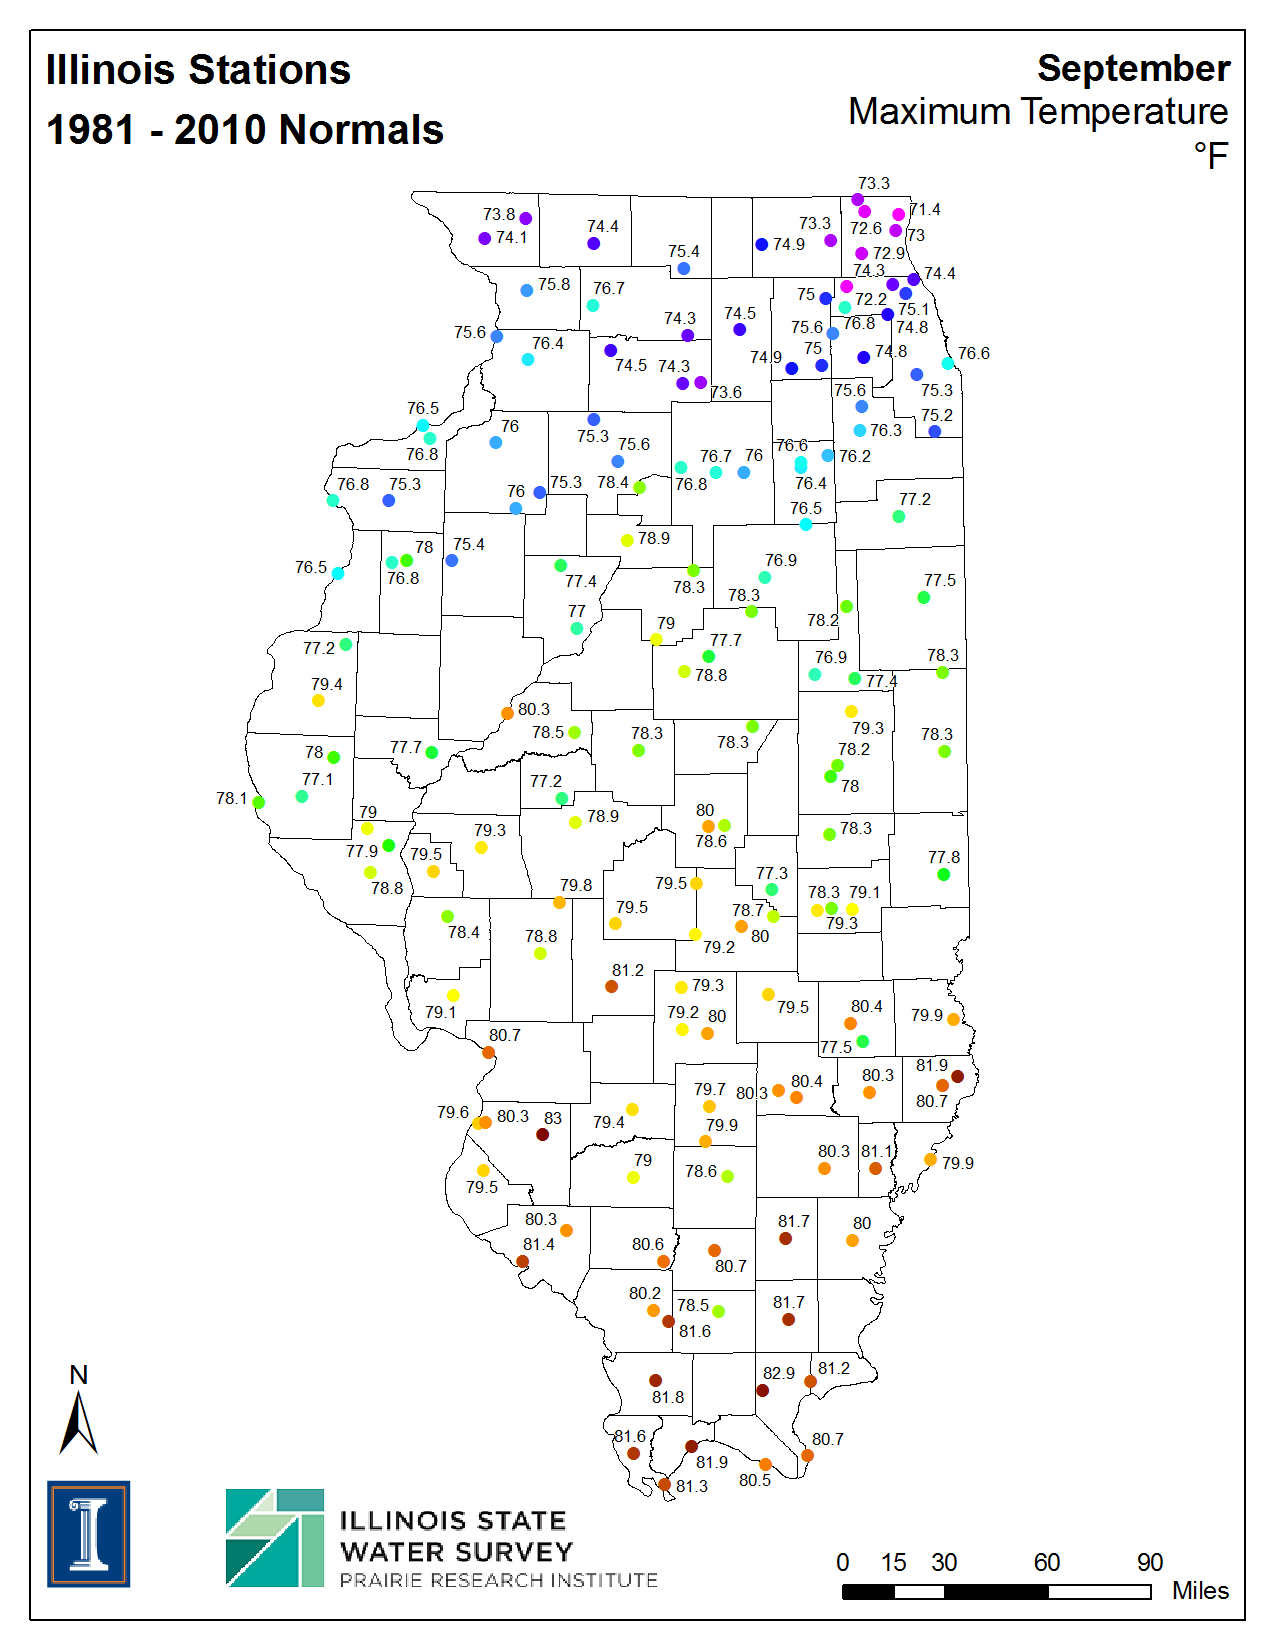
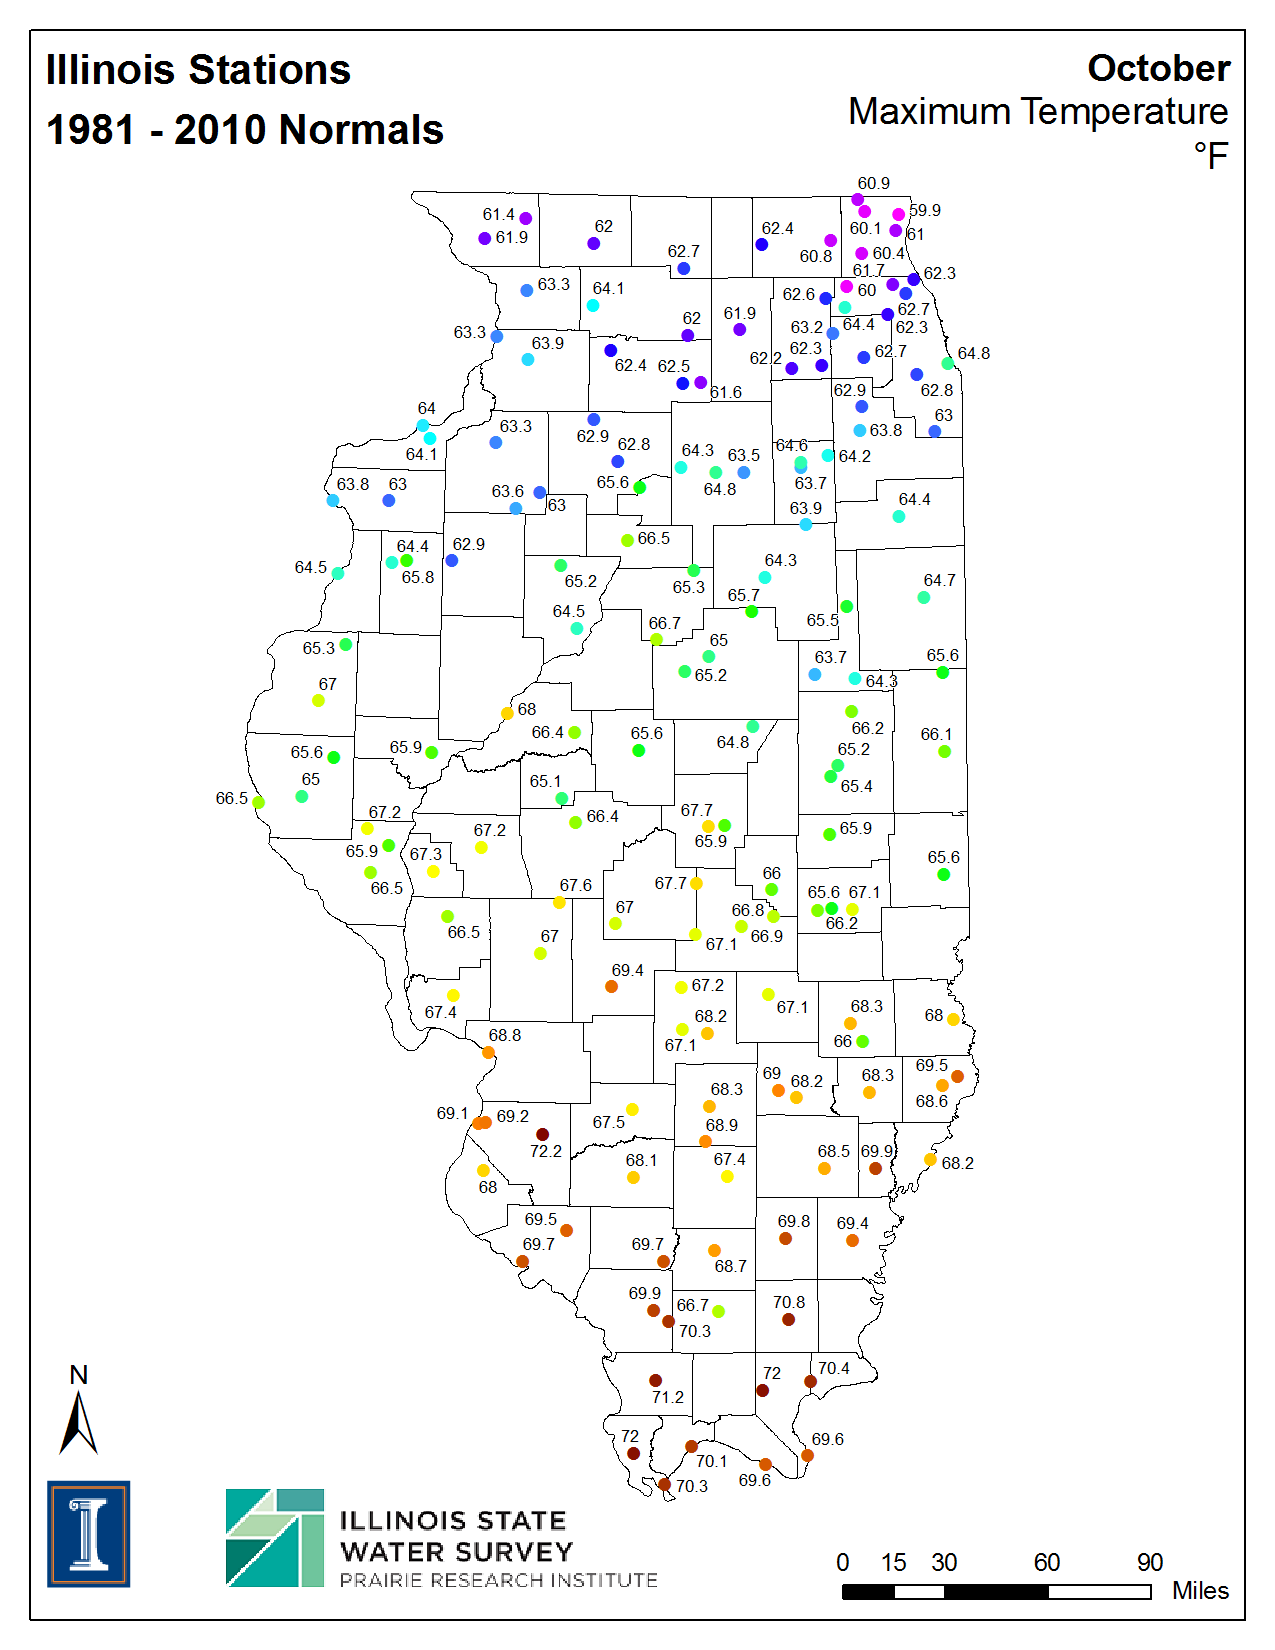
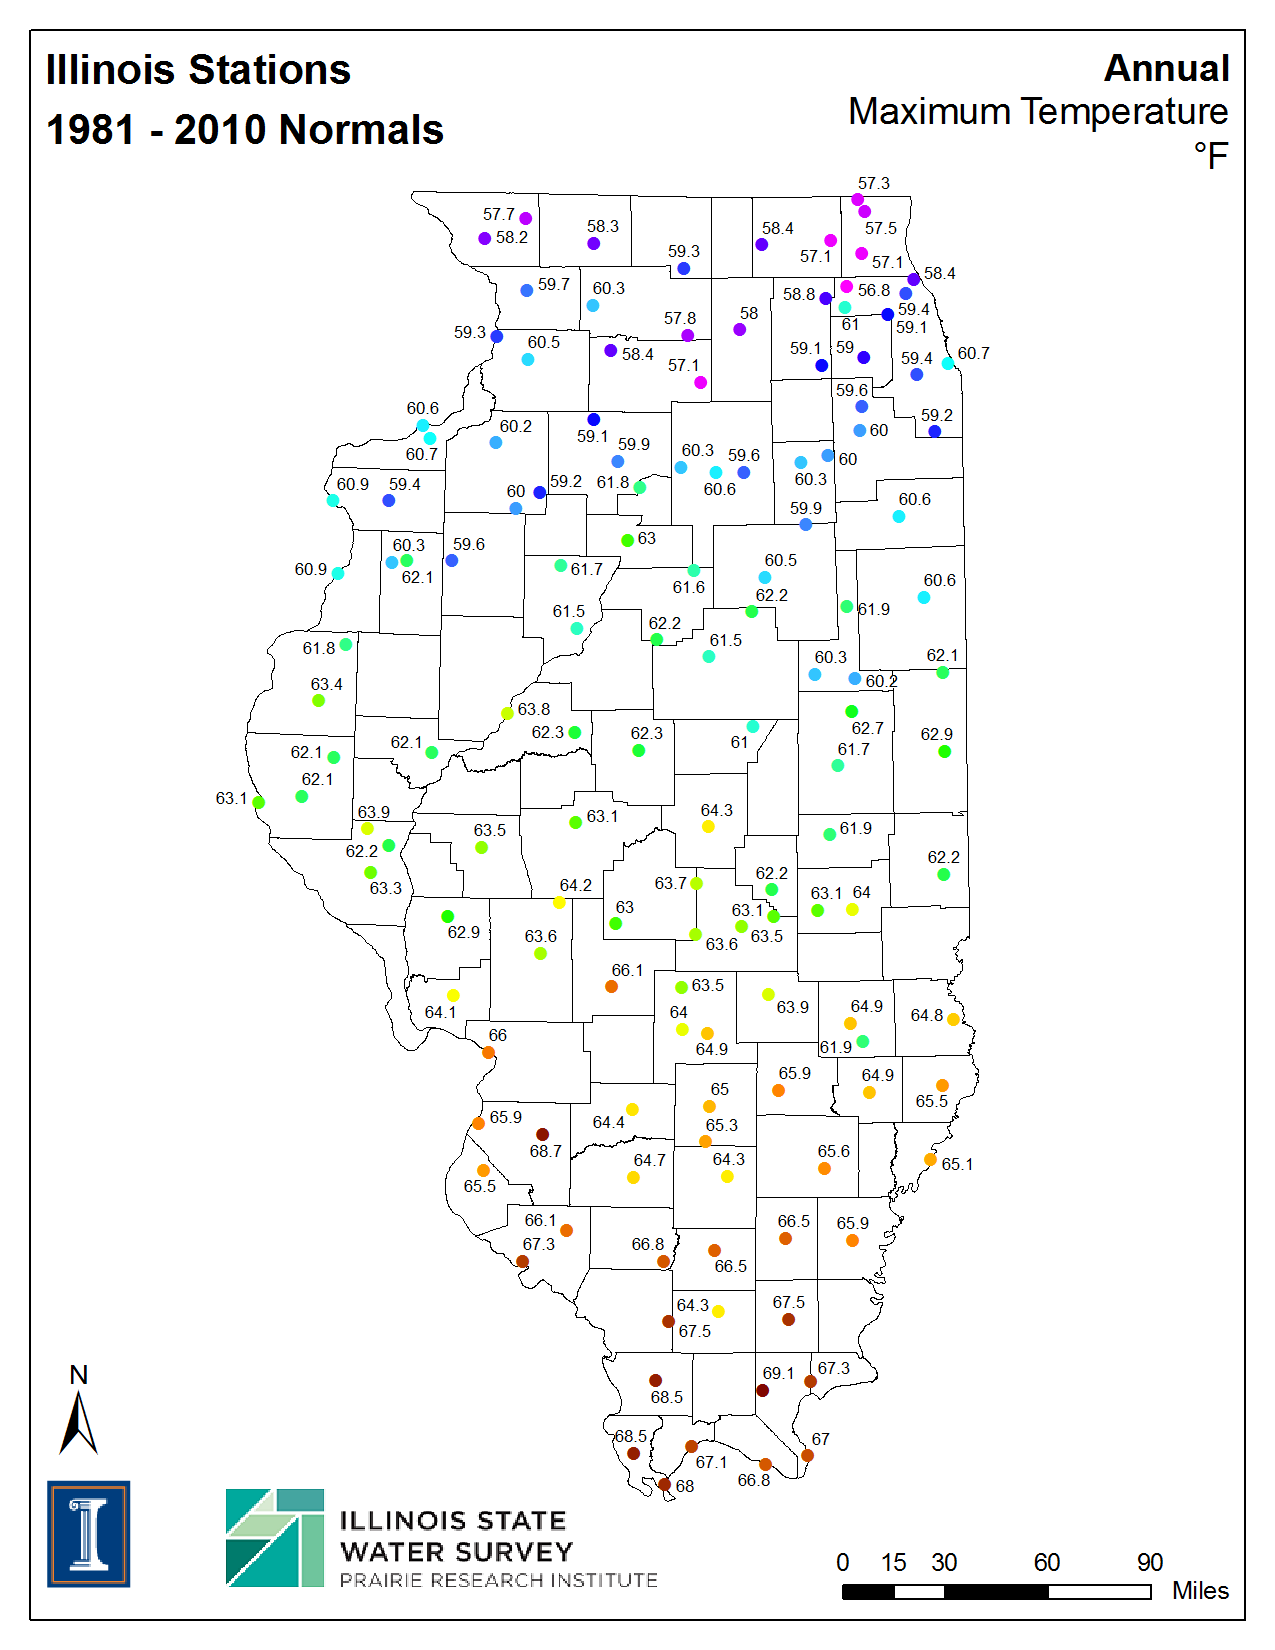
| Mean Daily High Temperature (degrees F) | ||||||
| Jan | Feb | Mar | Apr | May | Jun | |
| Jul | Aug | Sep | Oct | Nov | Dec | Annual |
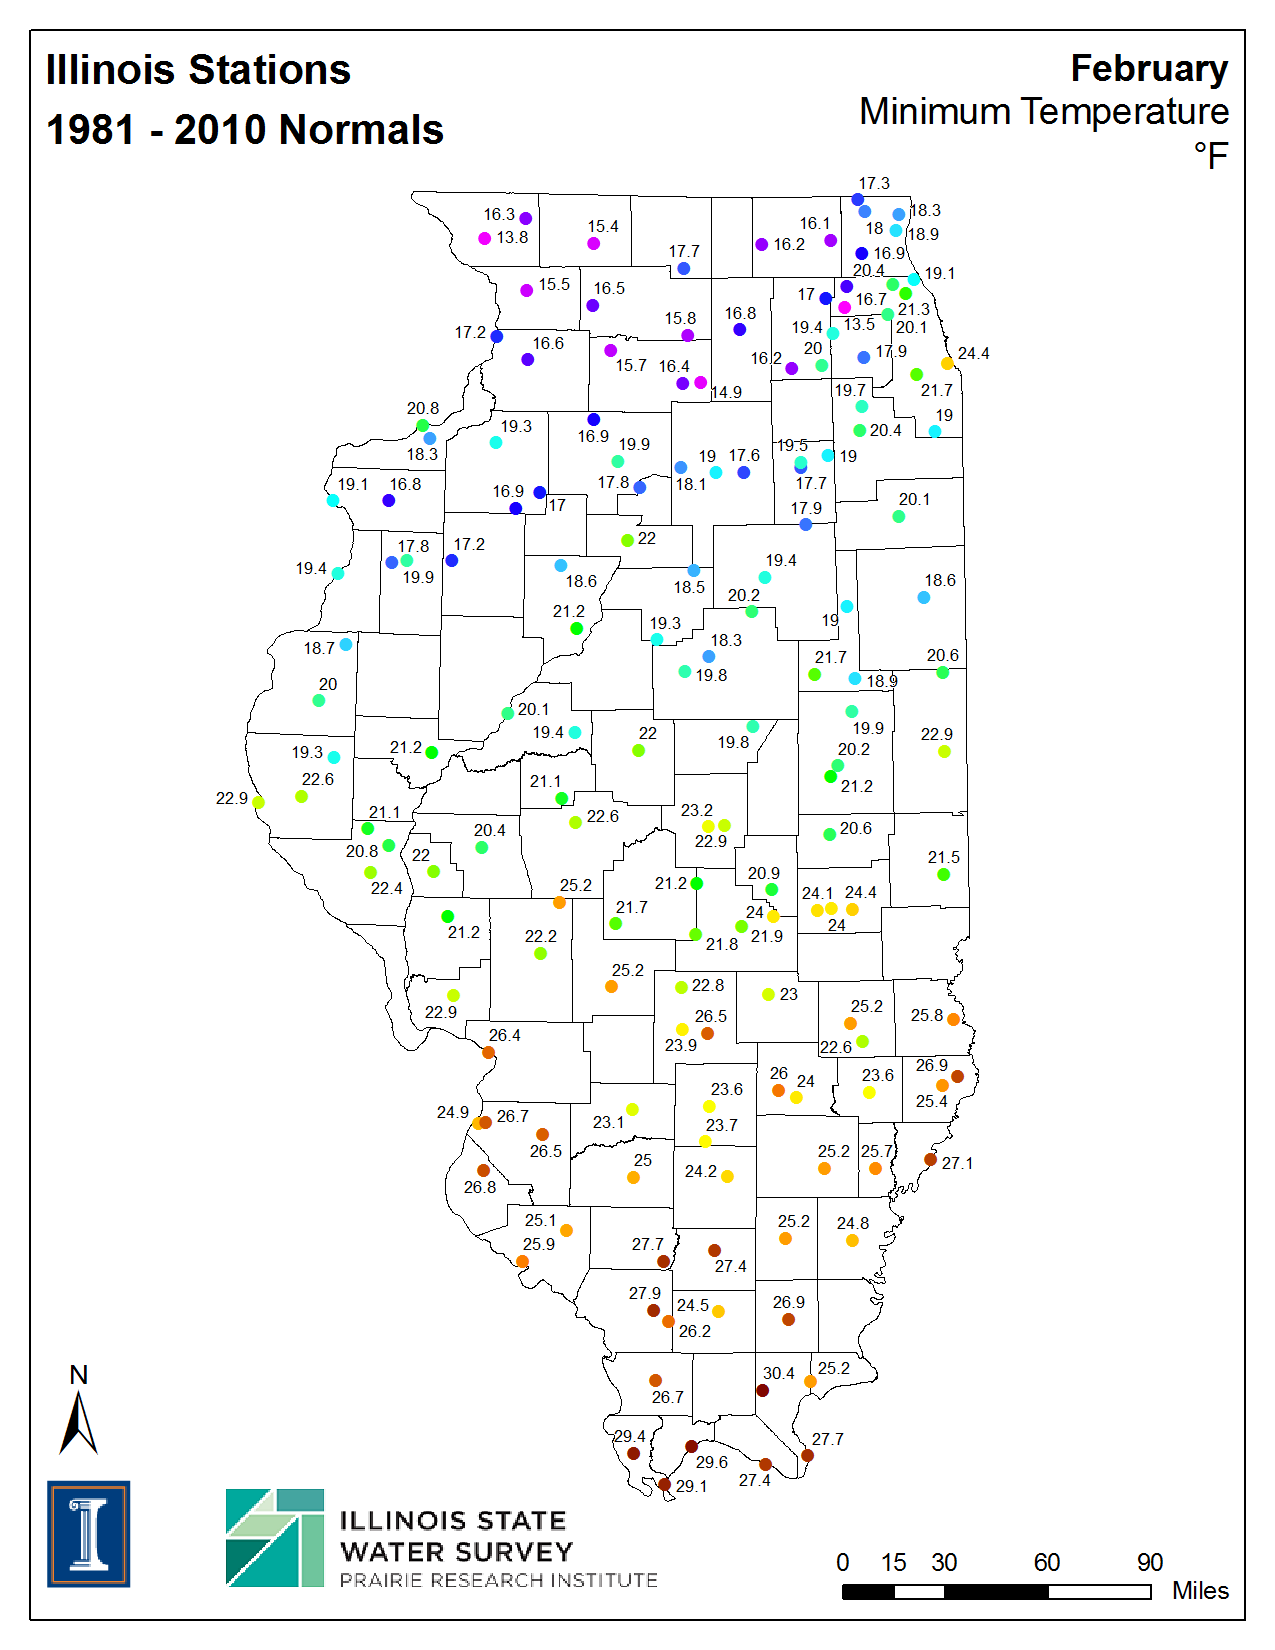
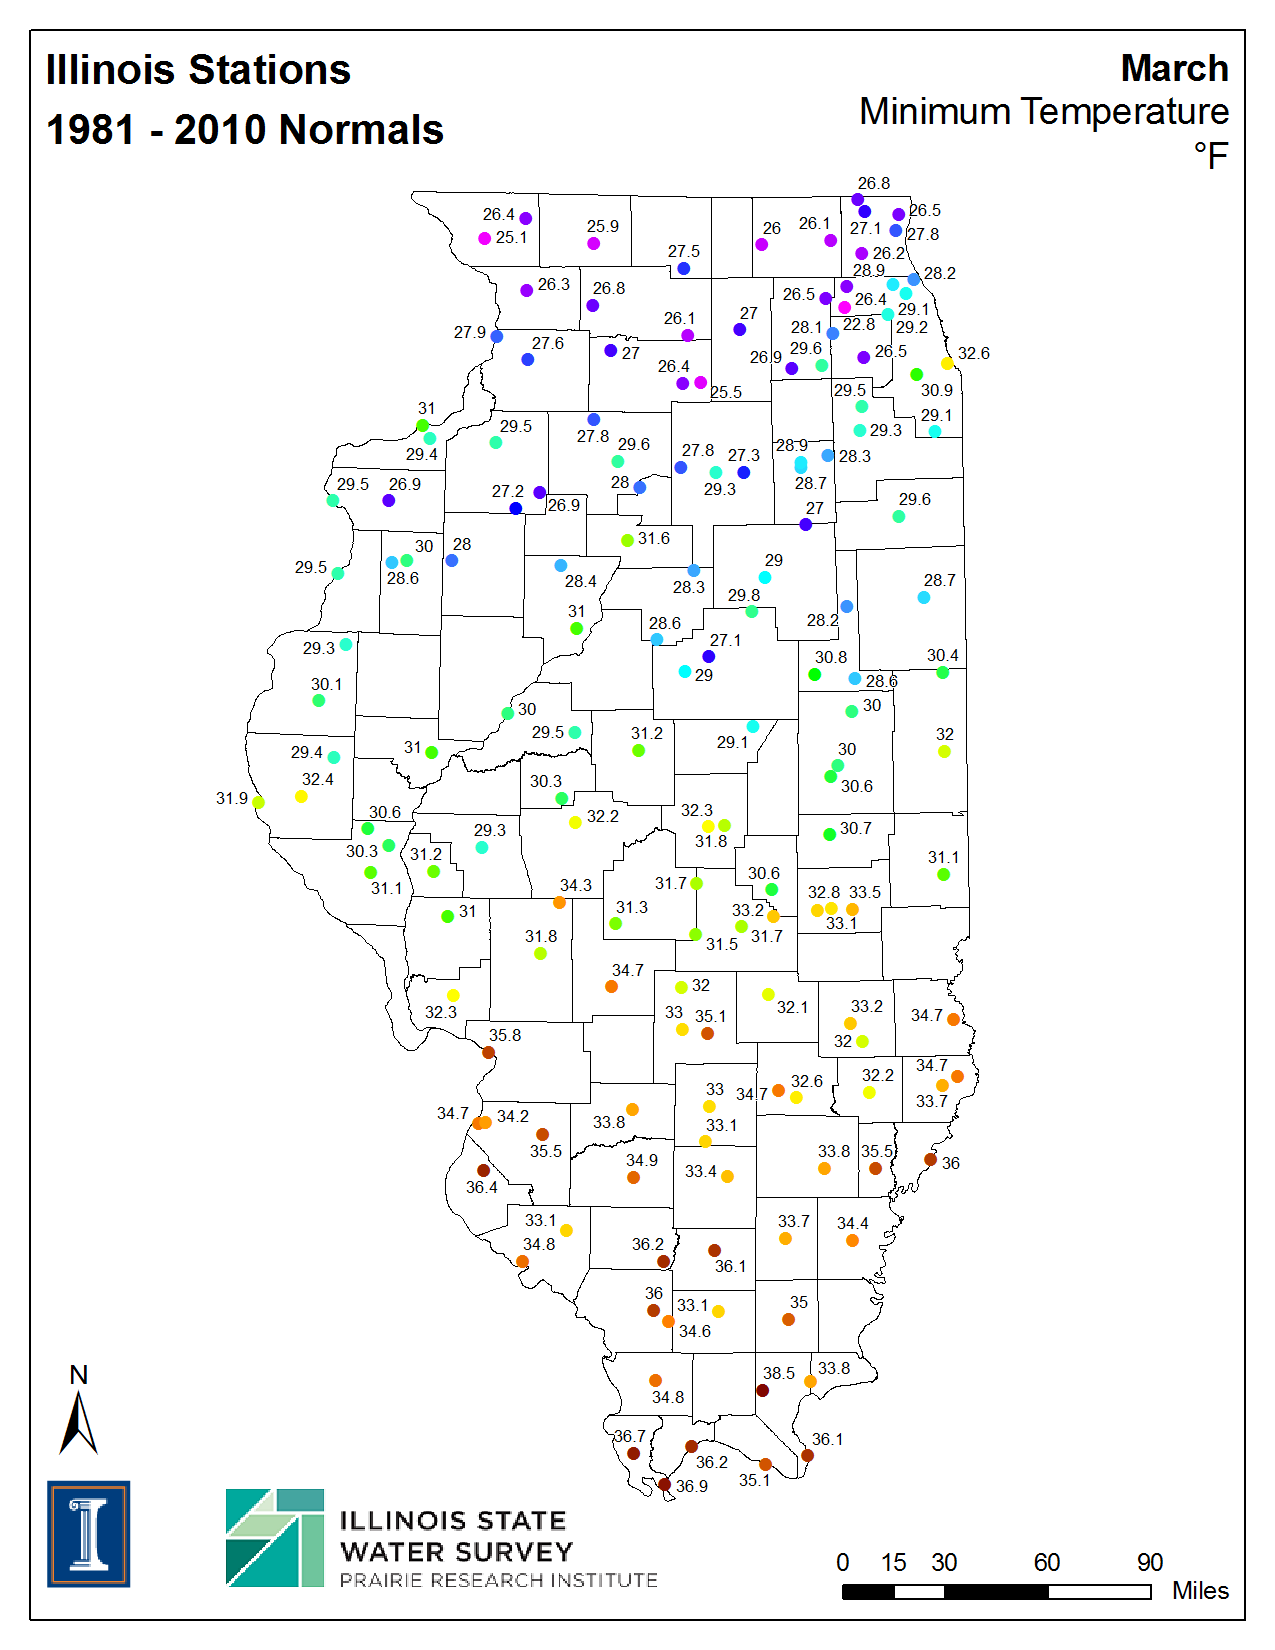
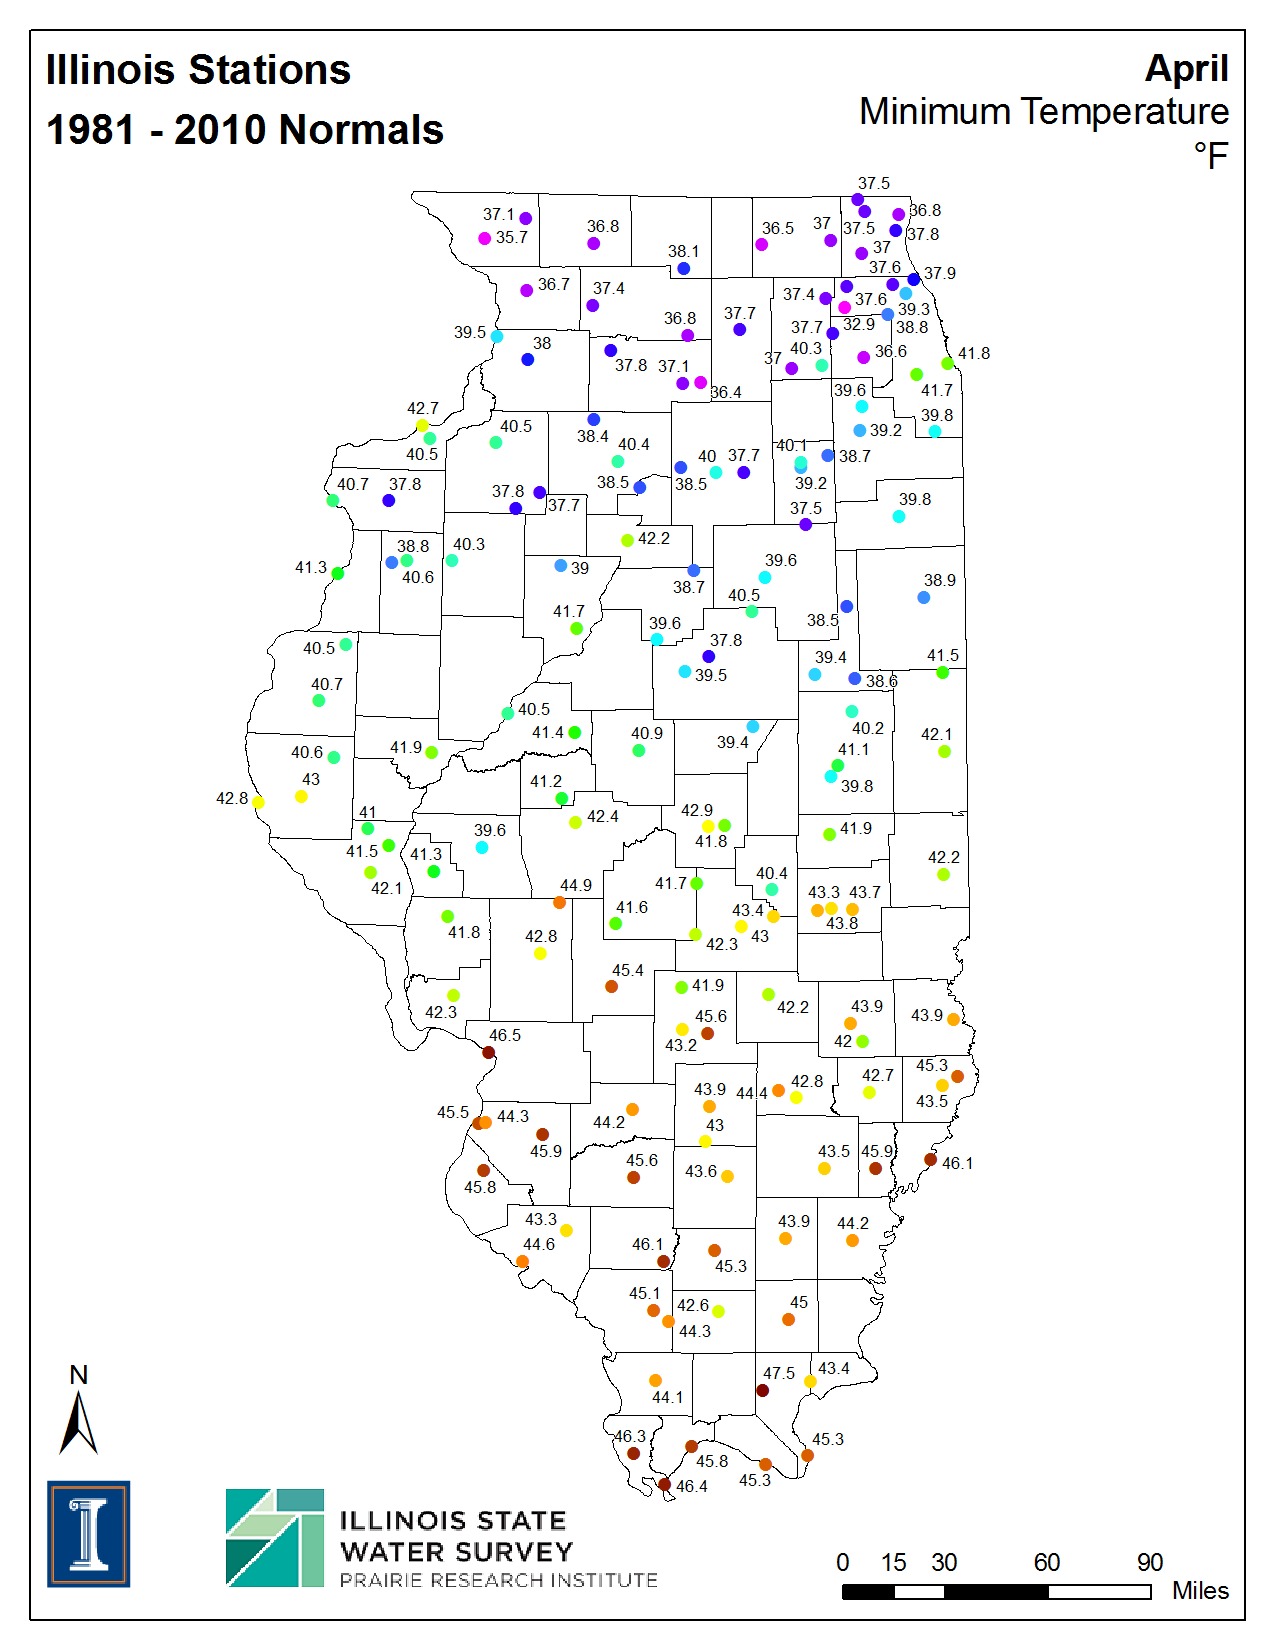
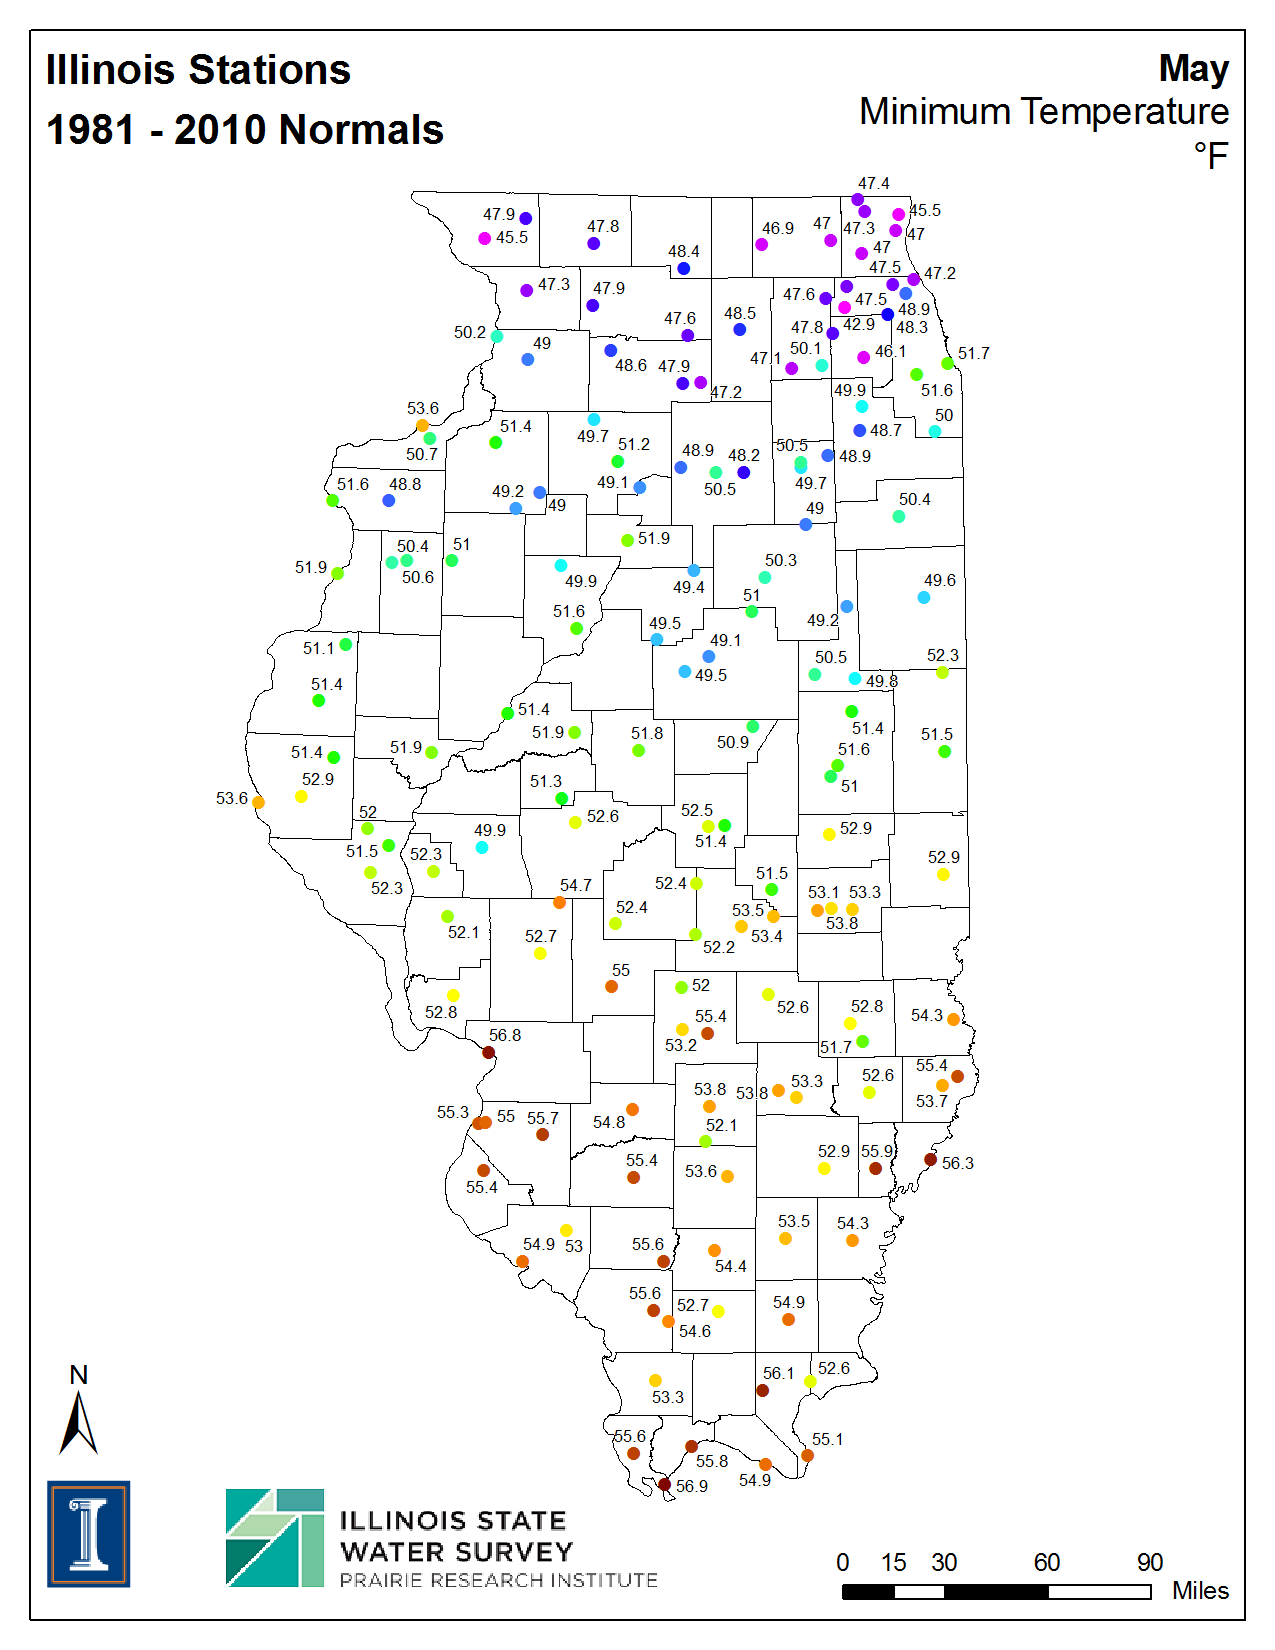
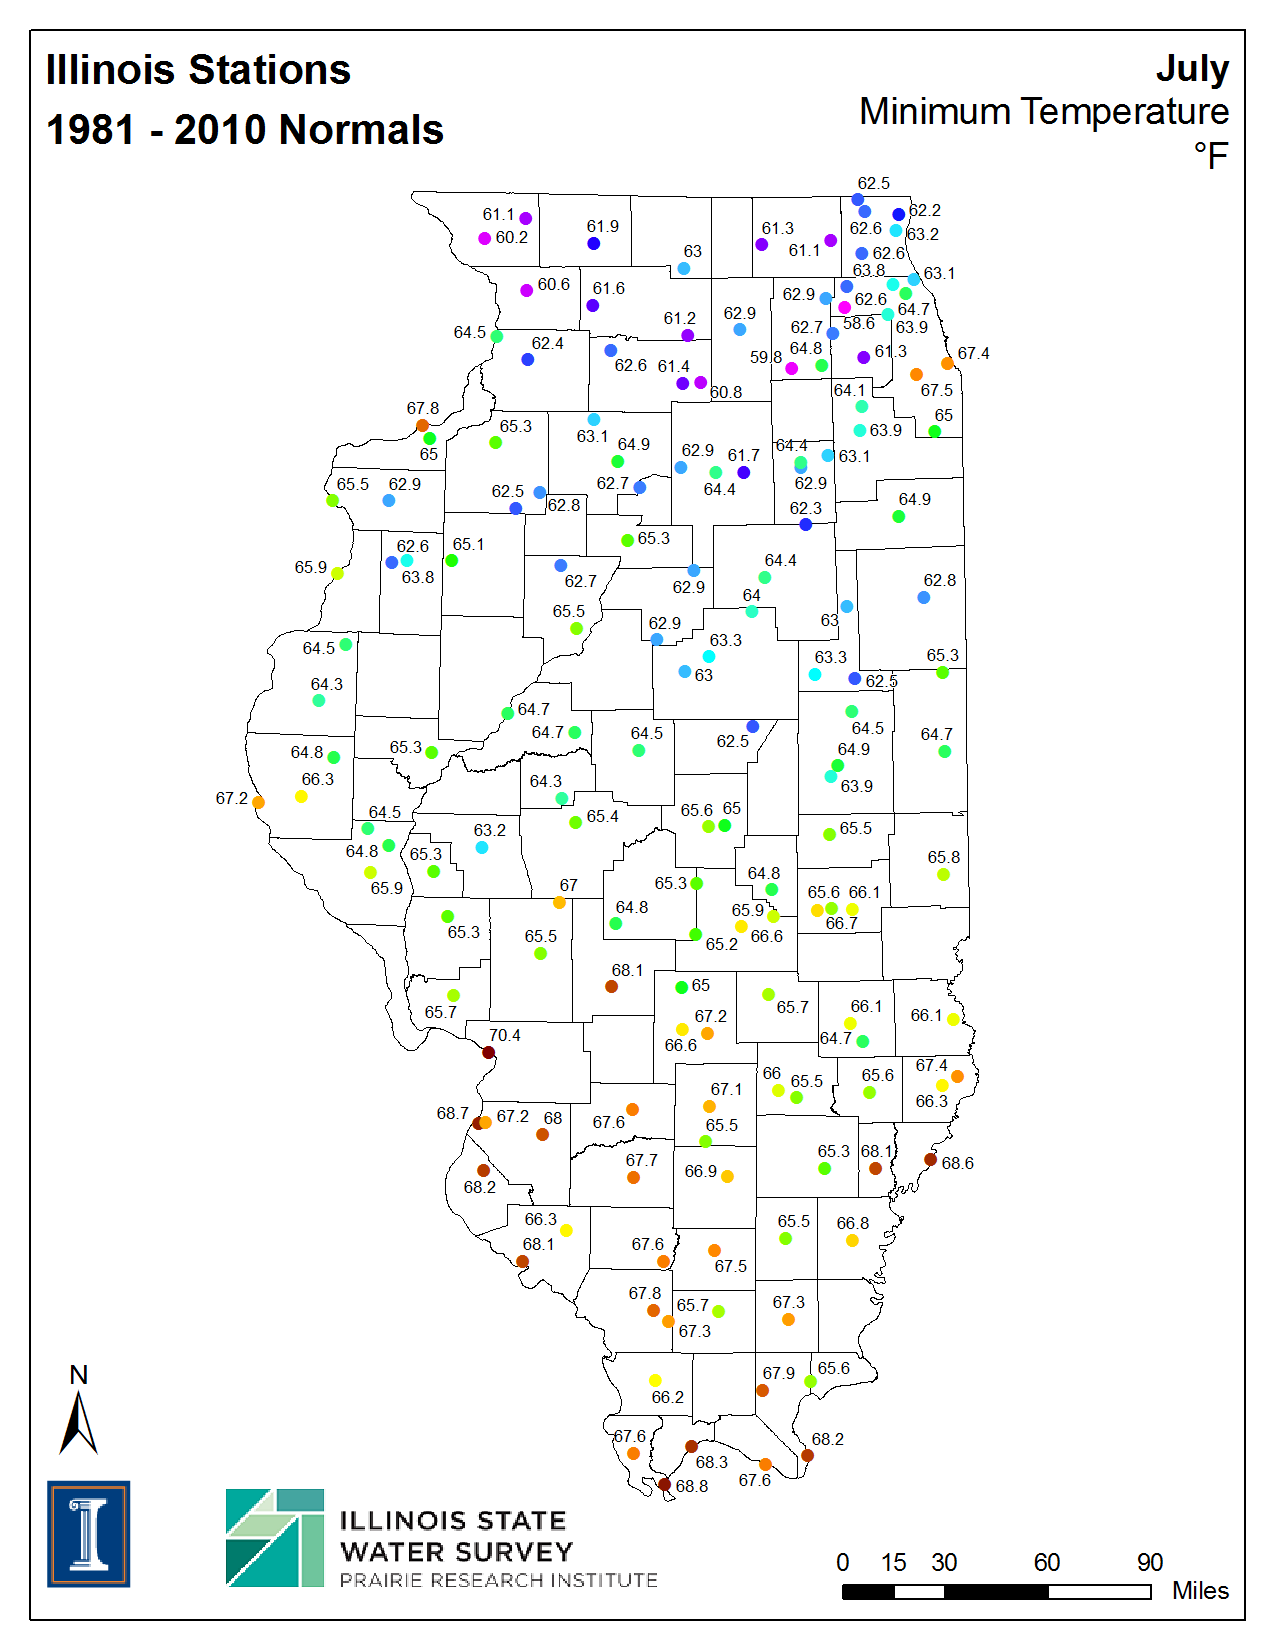
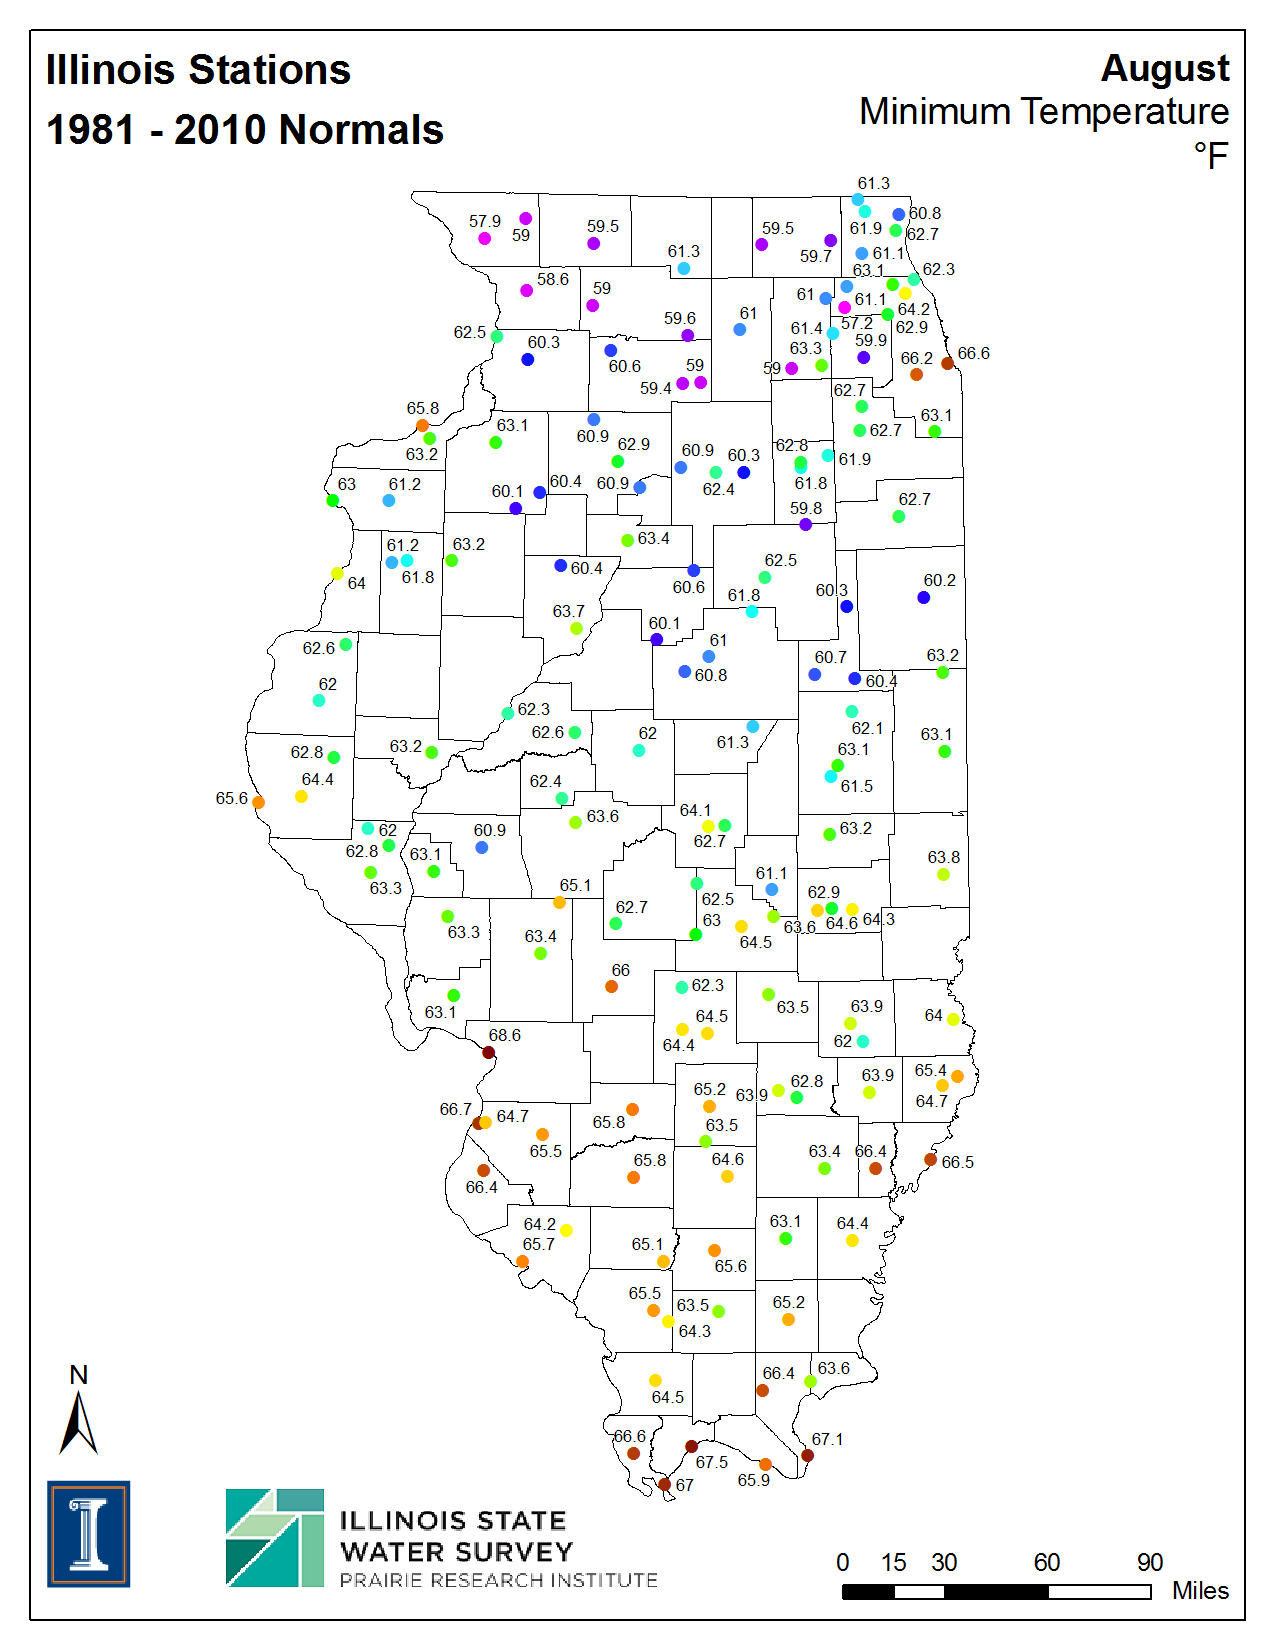
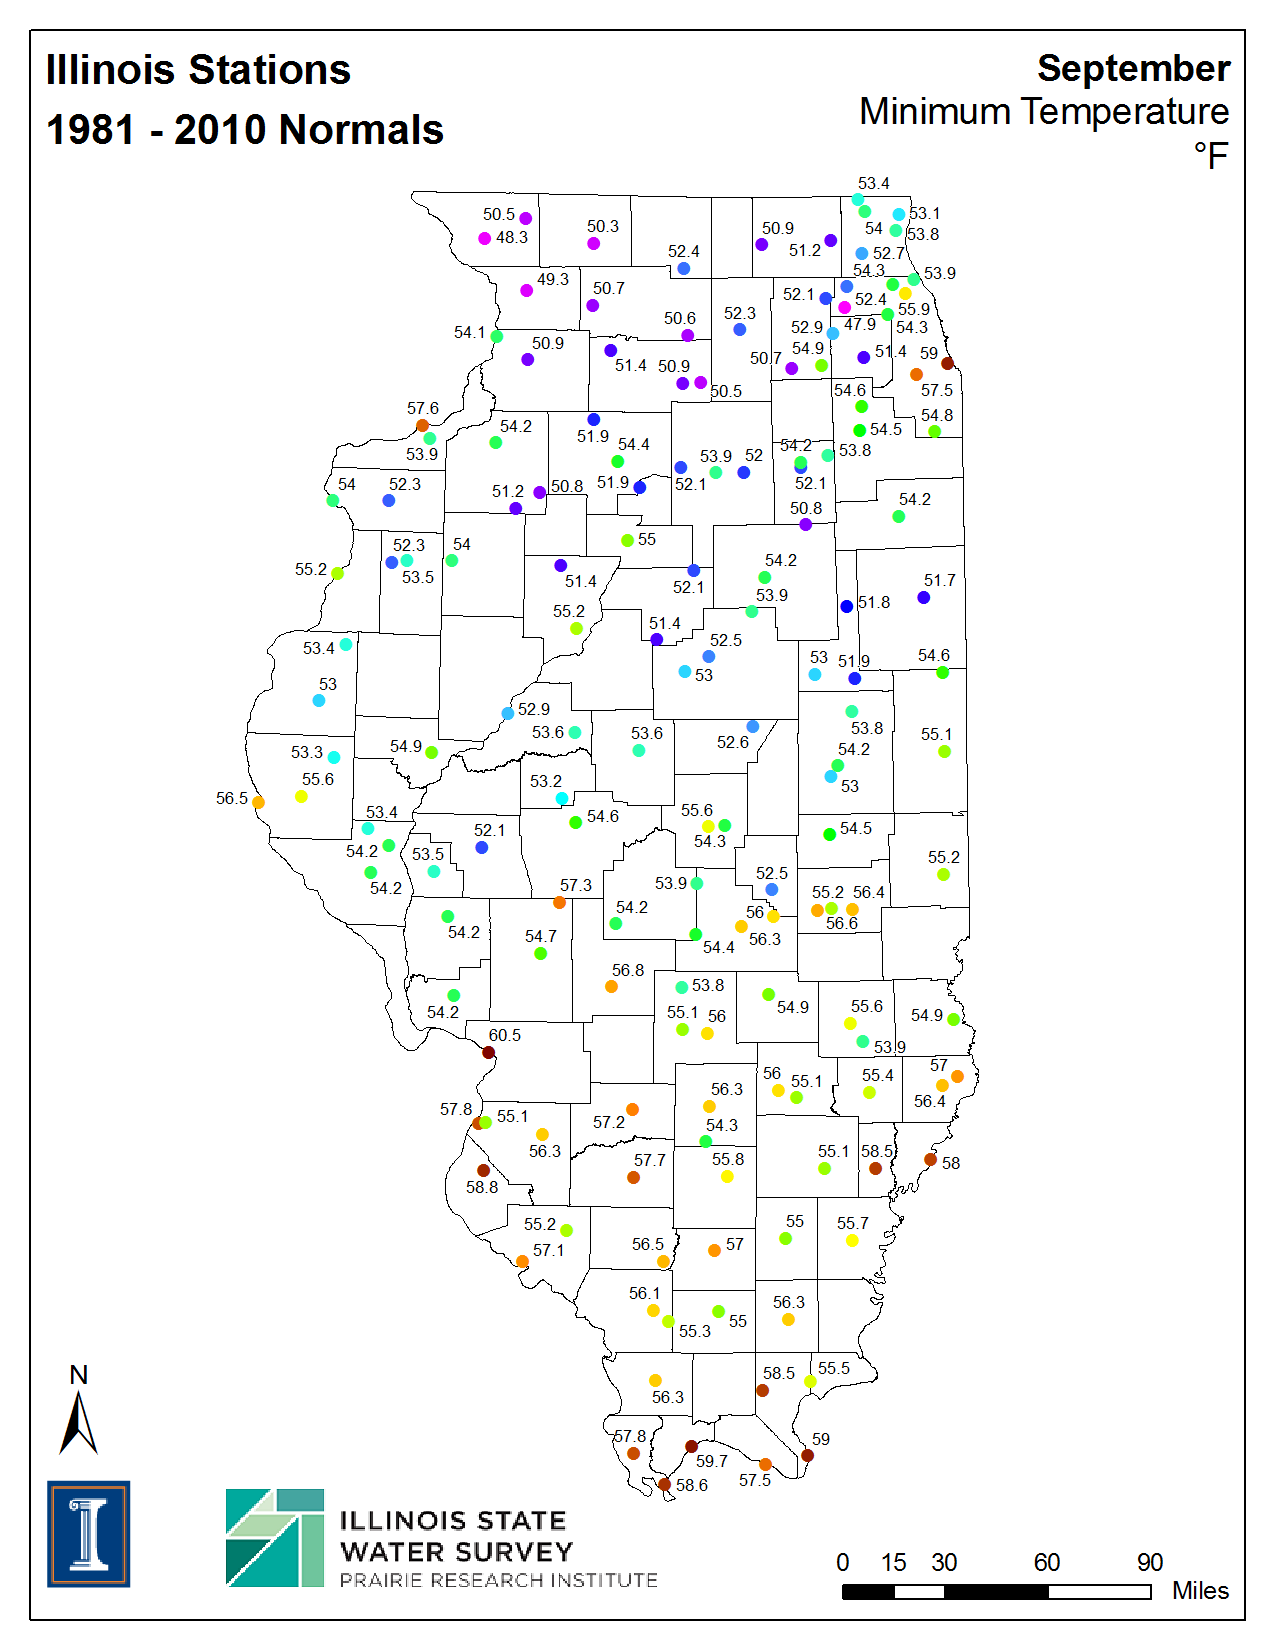
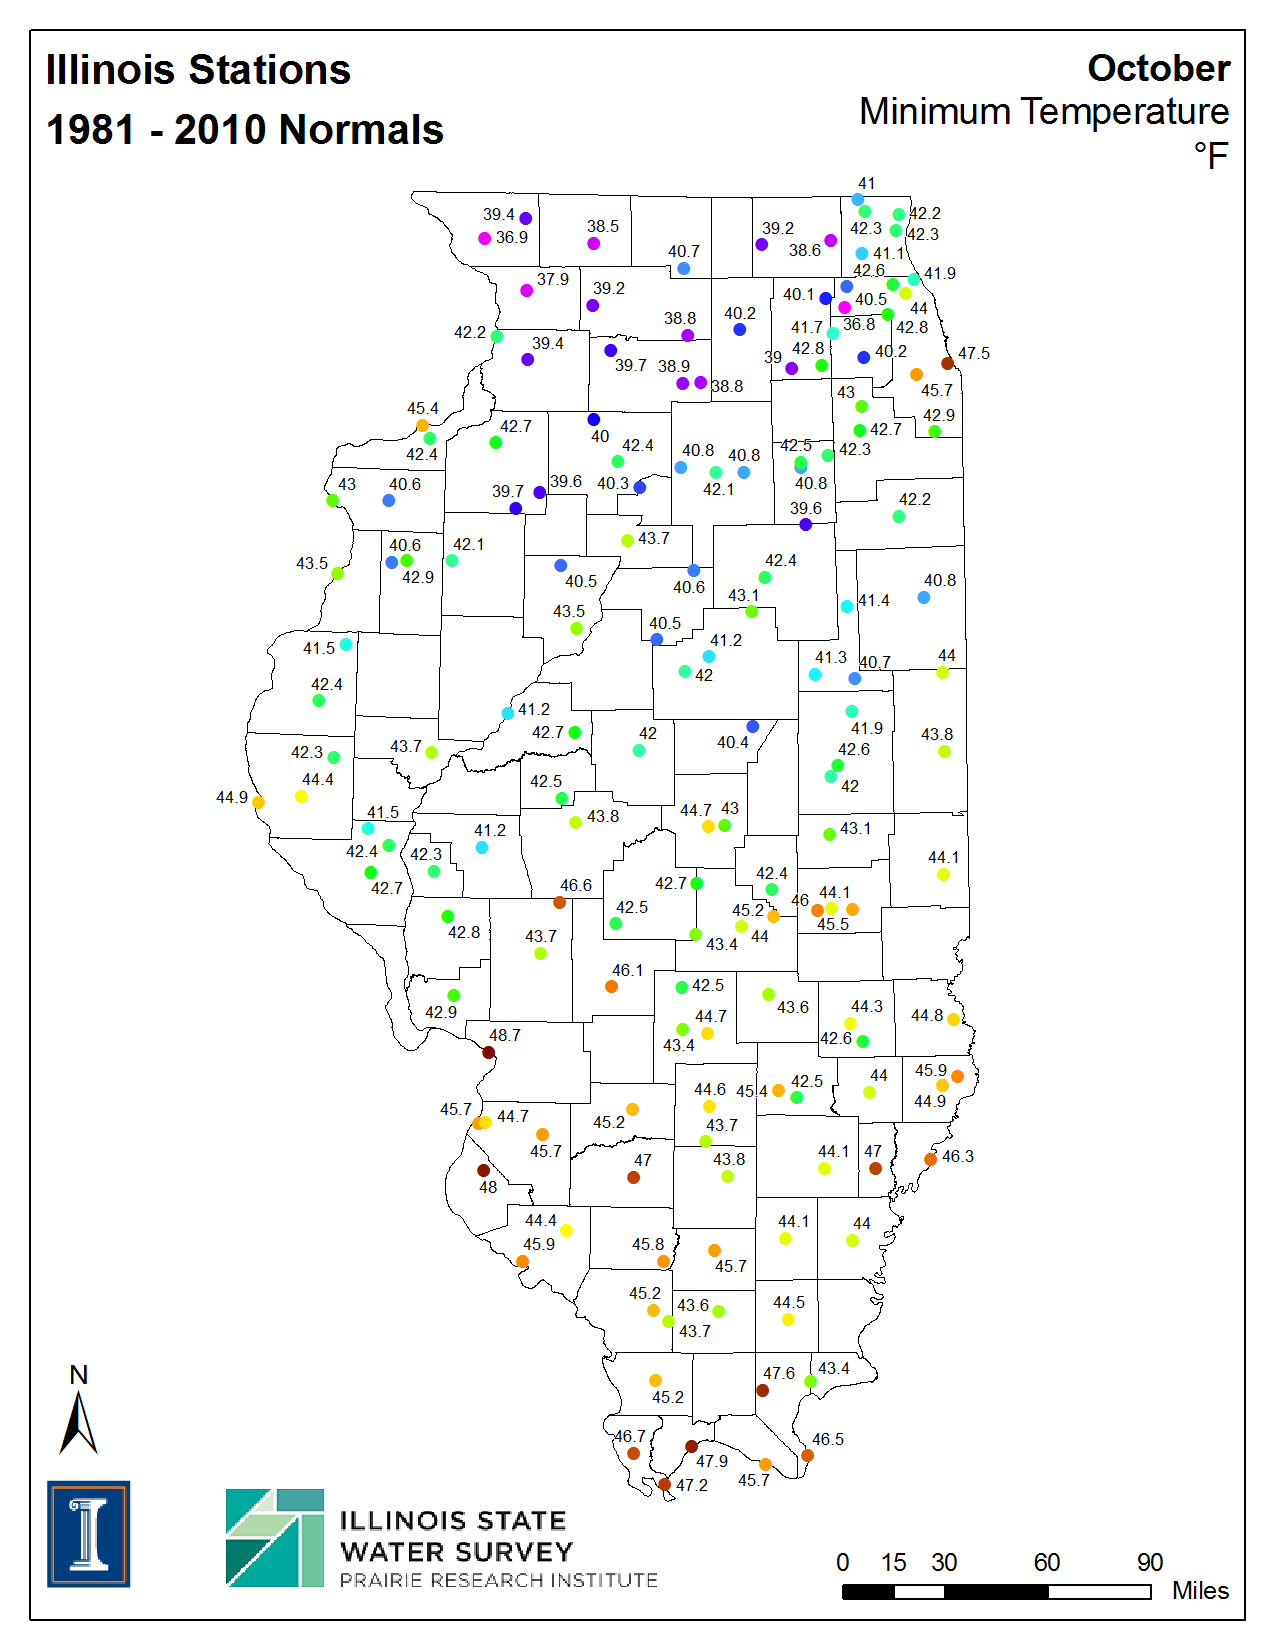
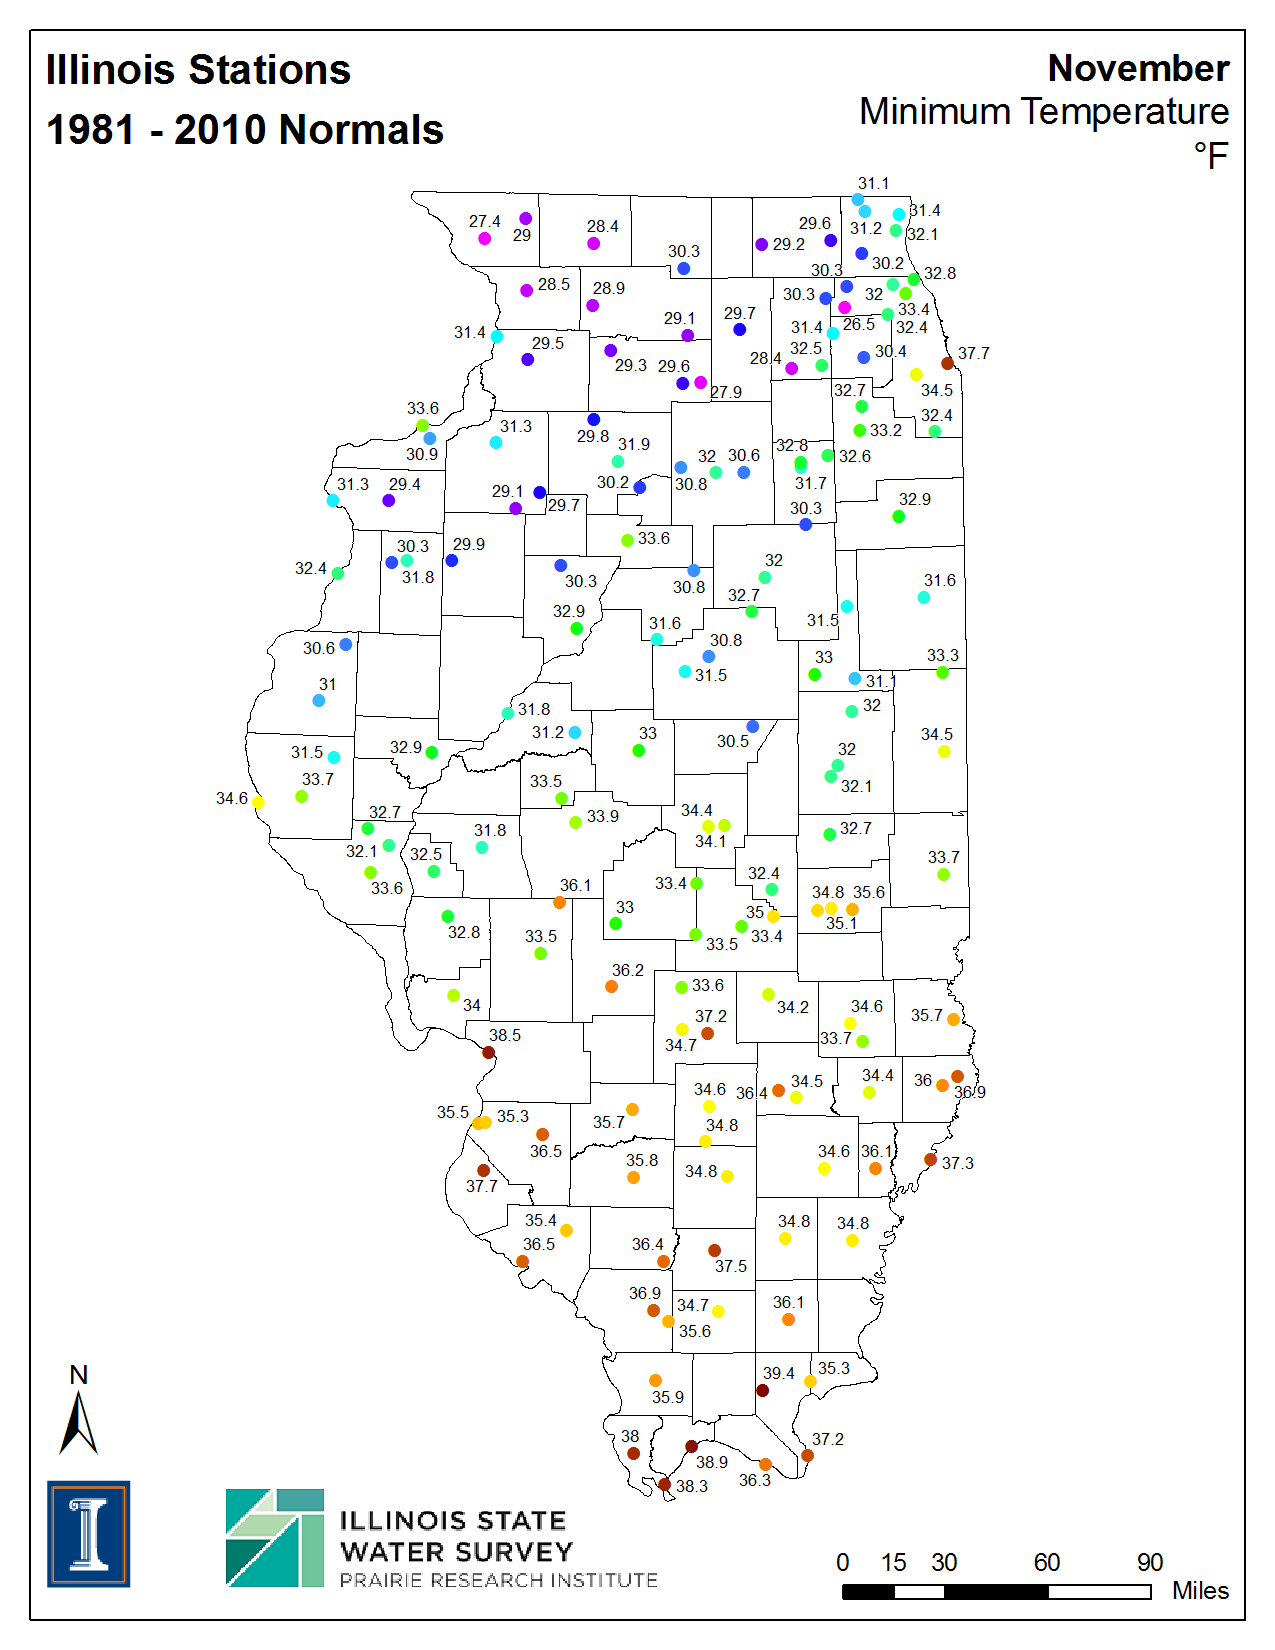
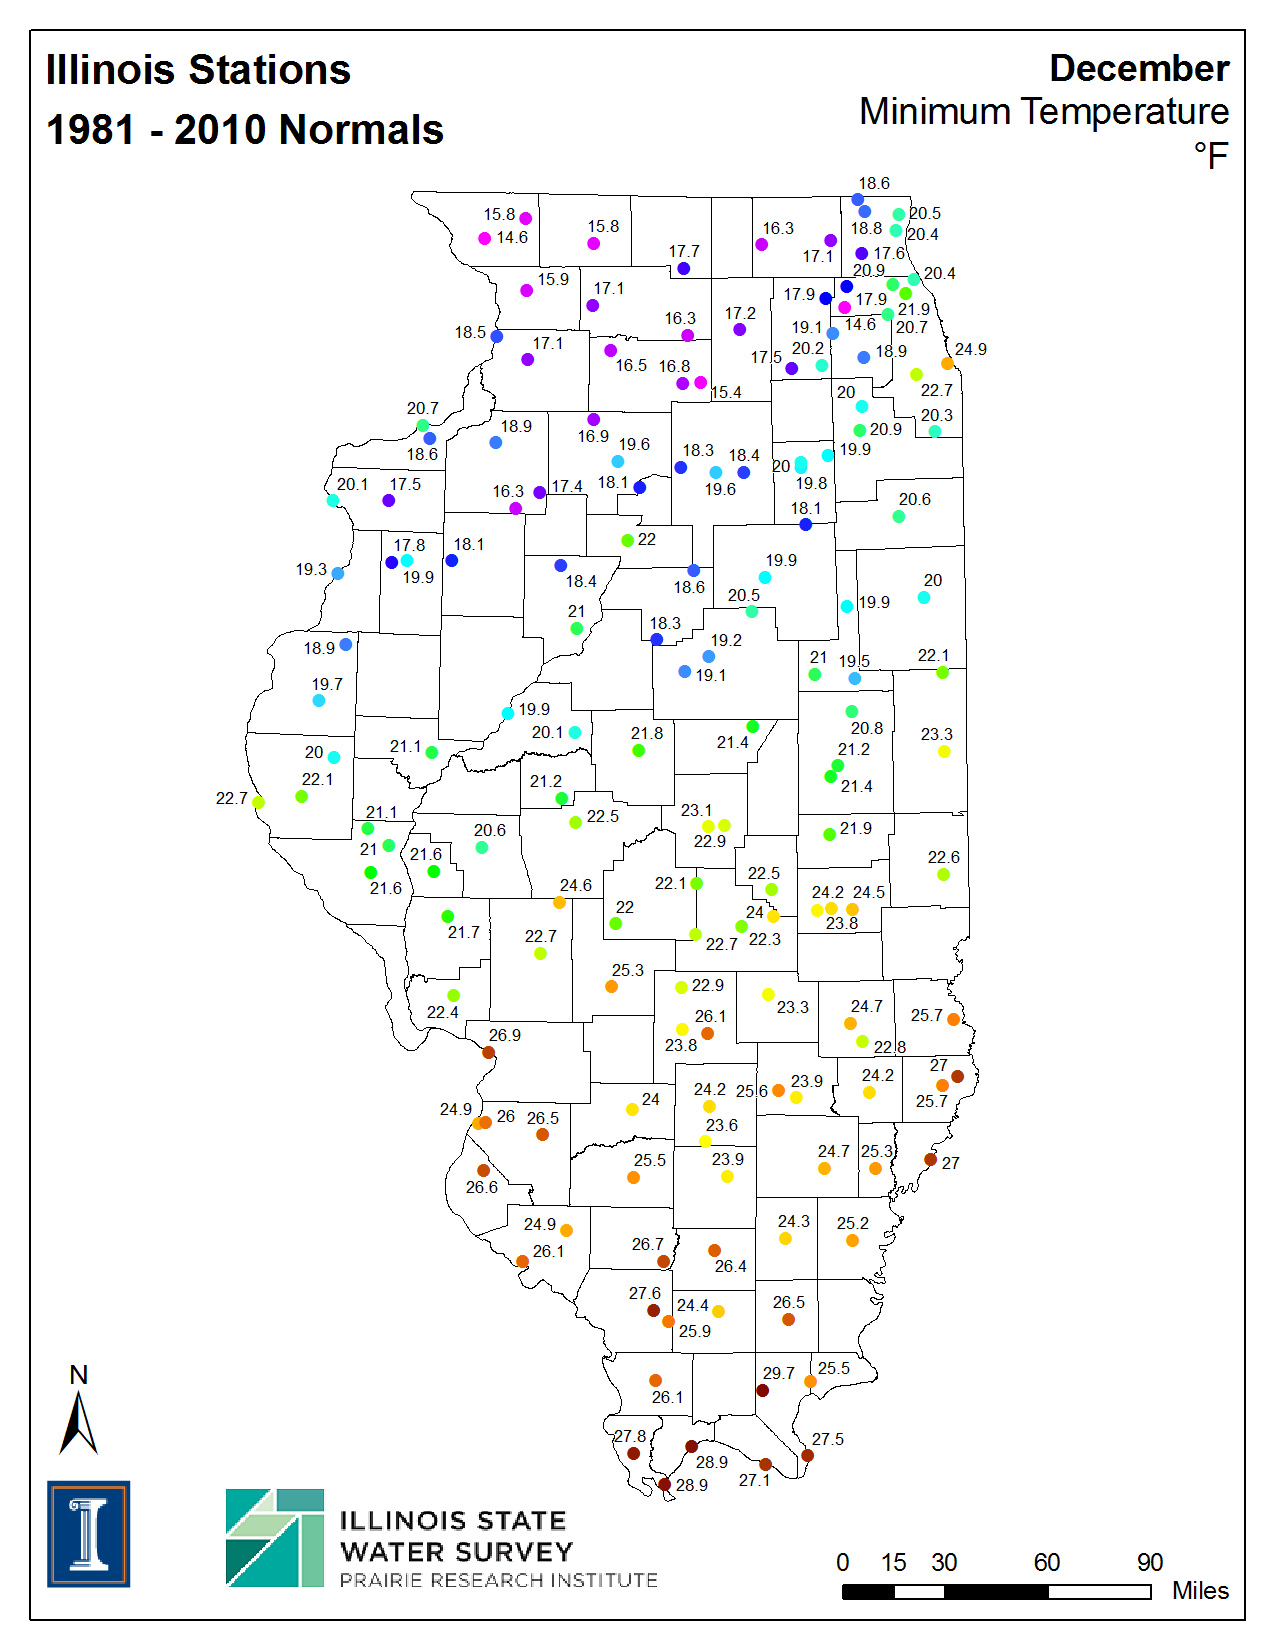
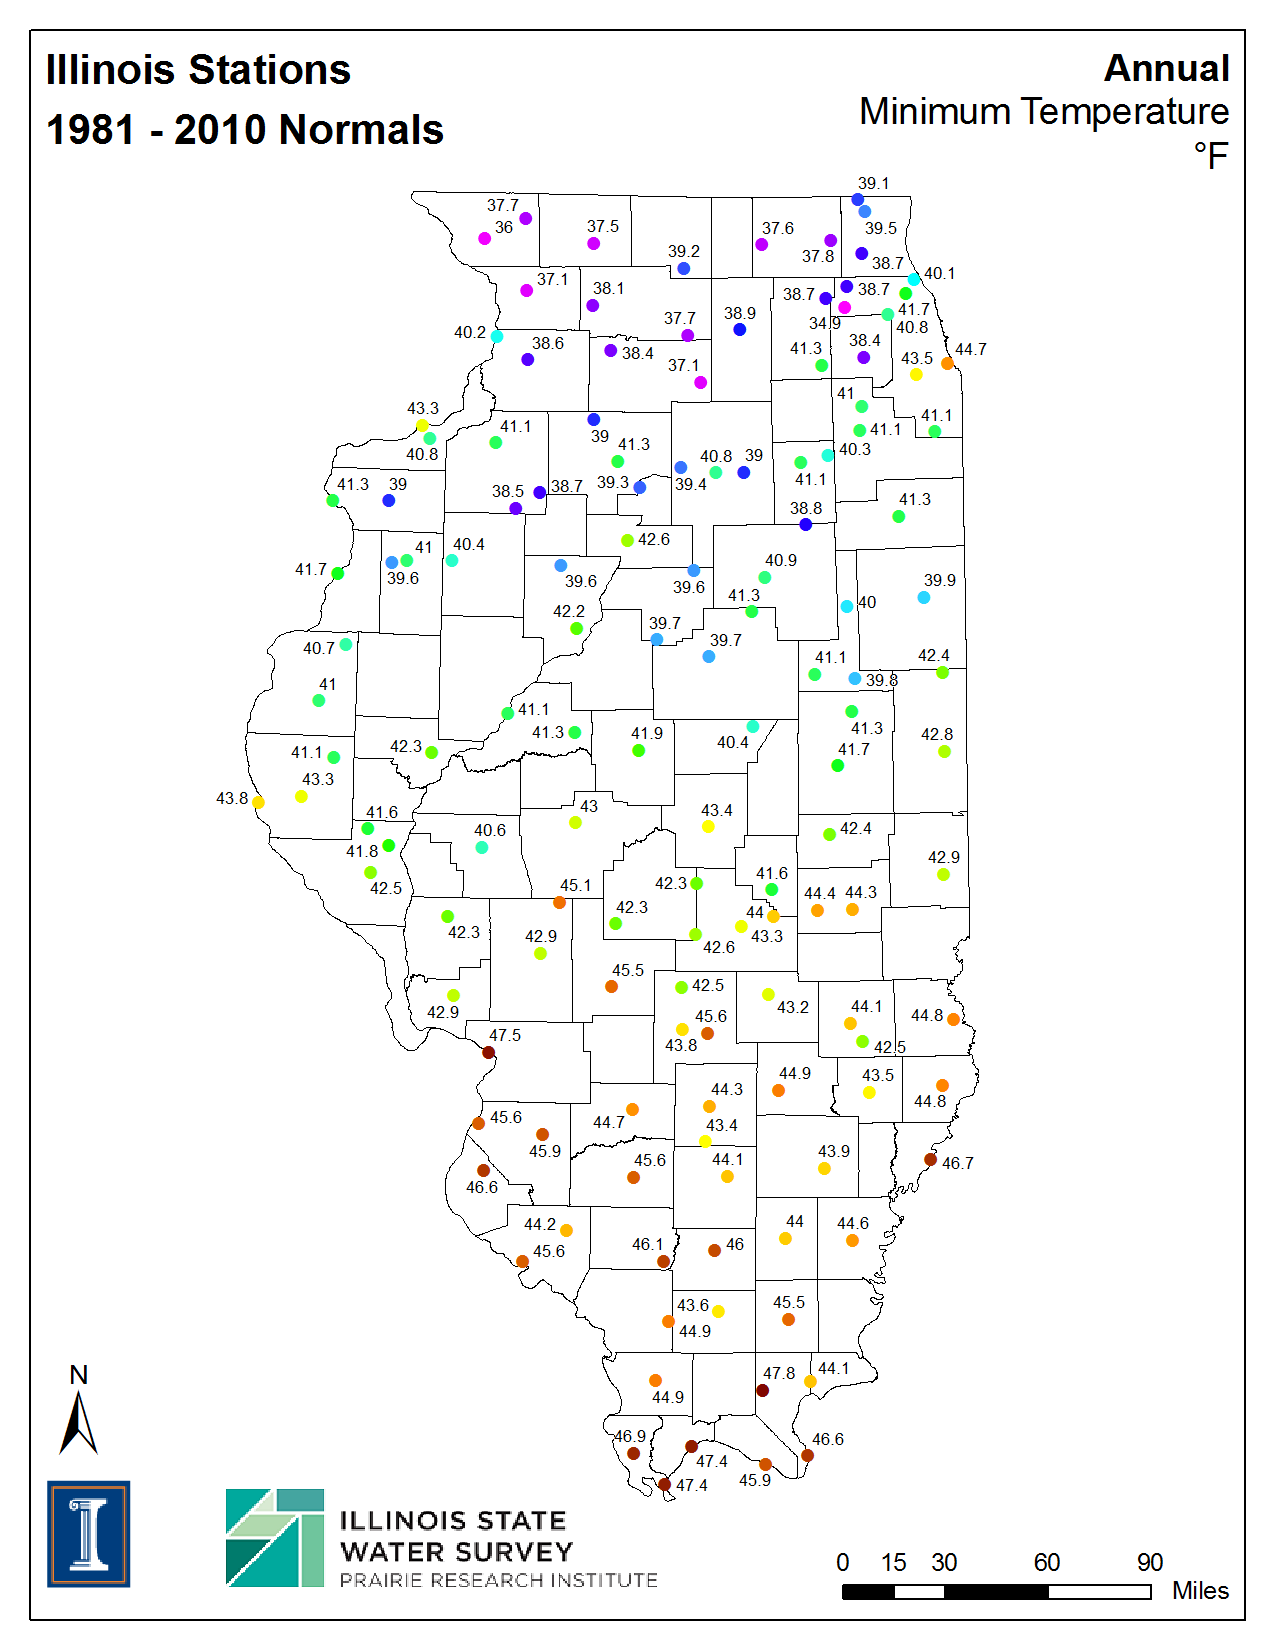
| Mean Daily Low Temperature (degrees F) | ||||||
| Jan | Feb | Mar | Apr | May | Jun | |
| Jul | Aug | Sep | Oct | Nov | Dec | Annual |
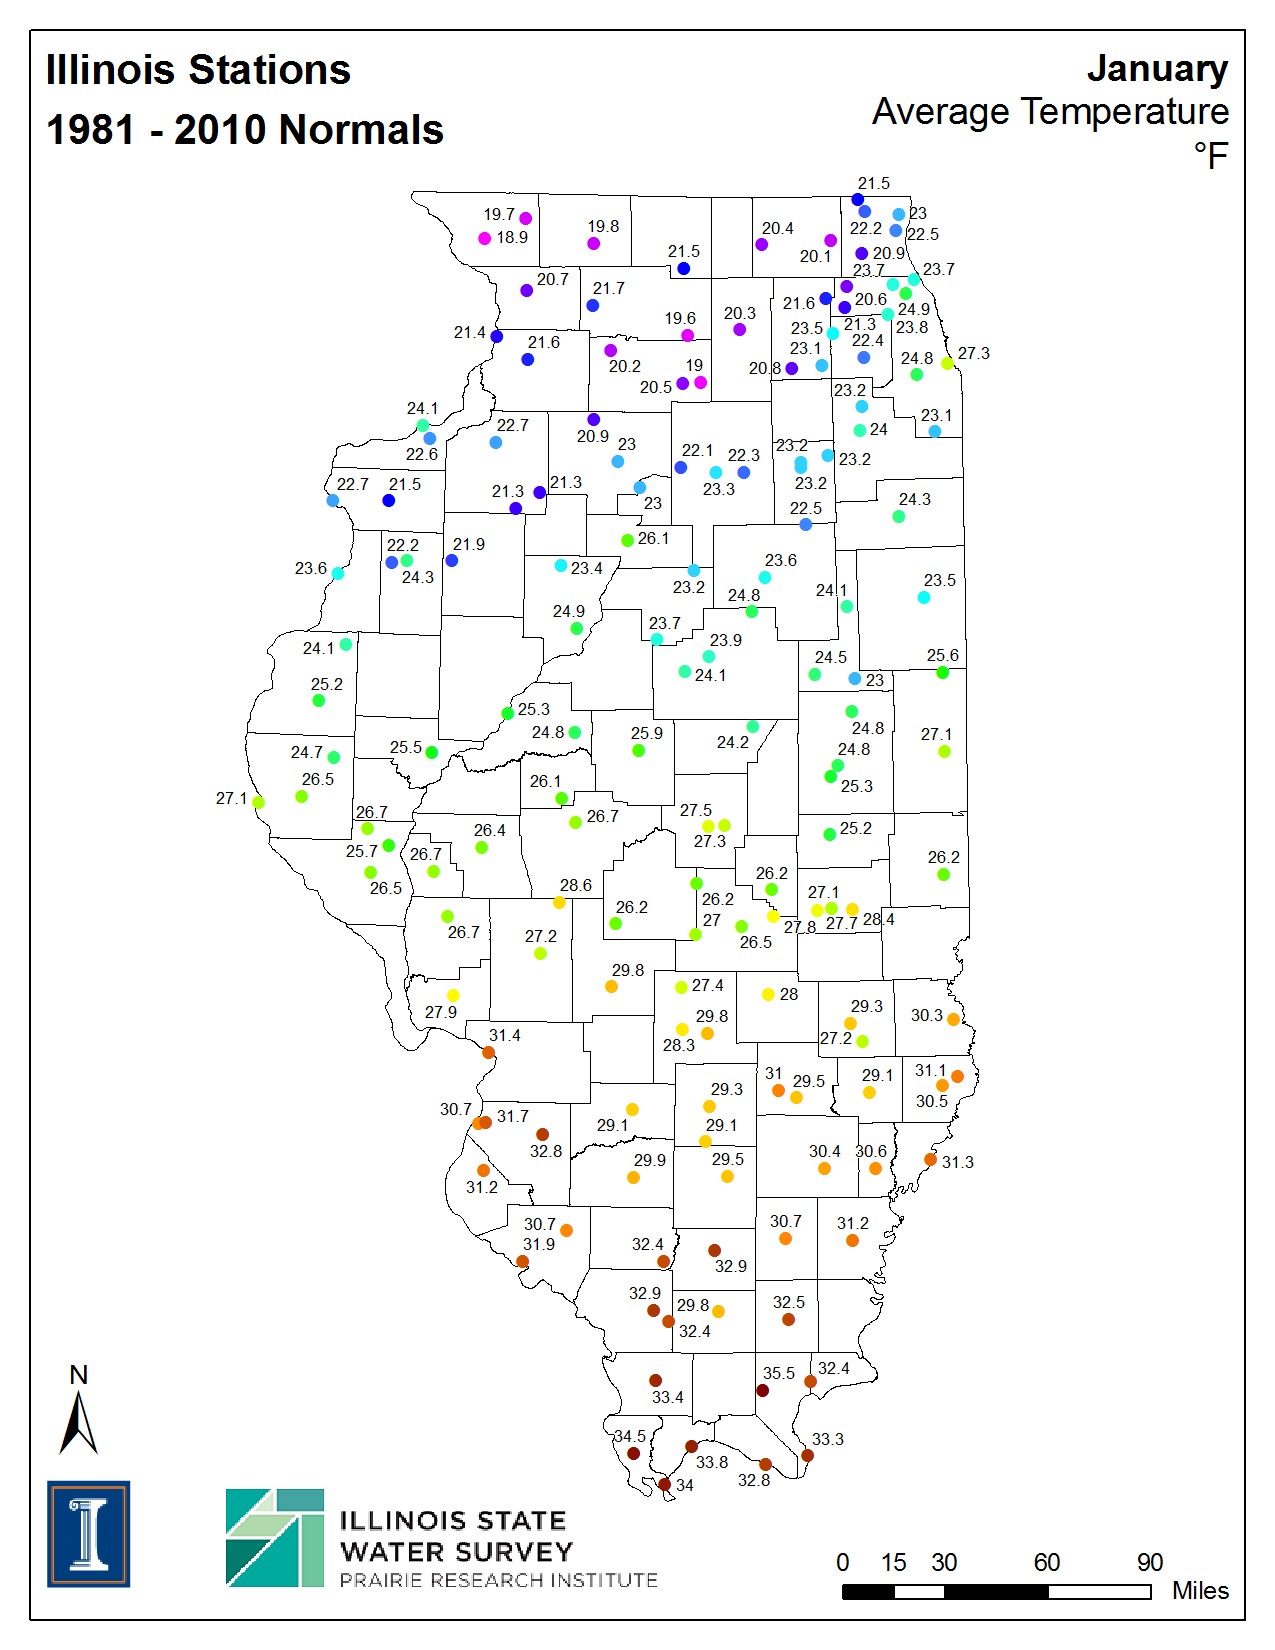
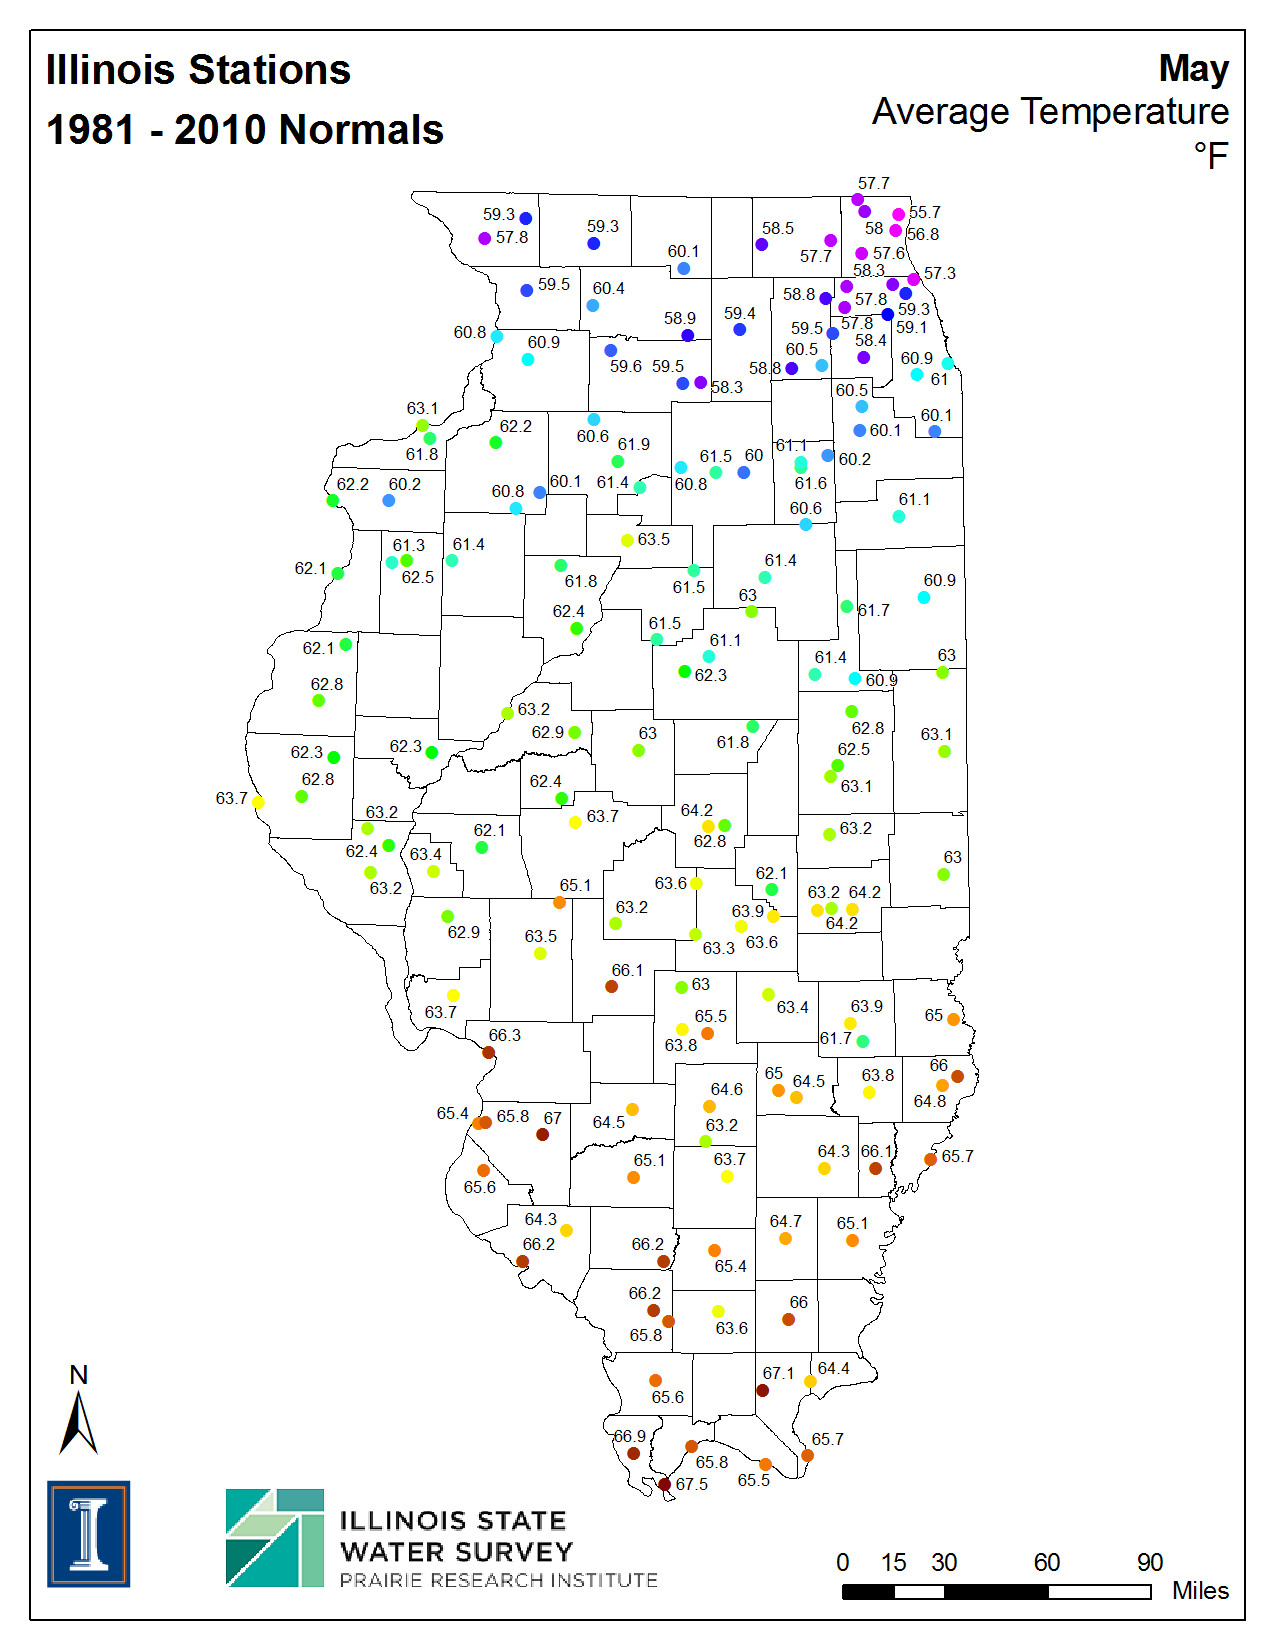
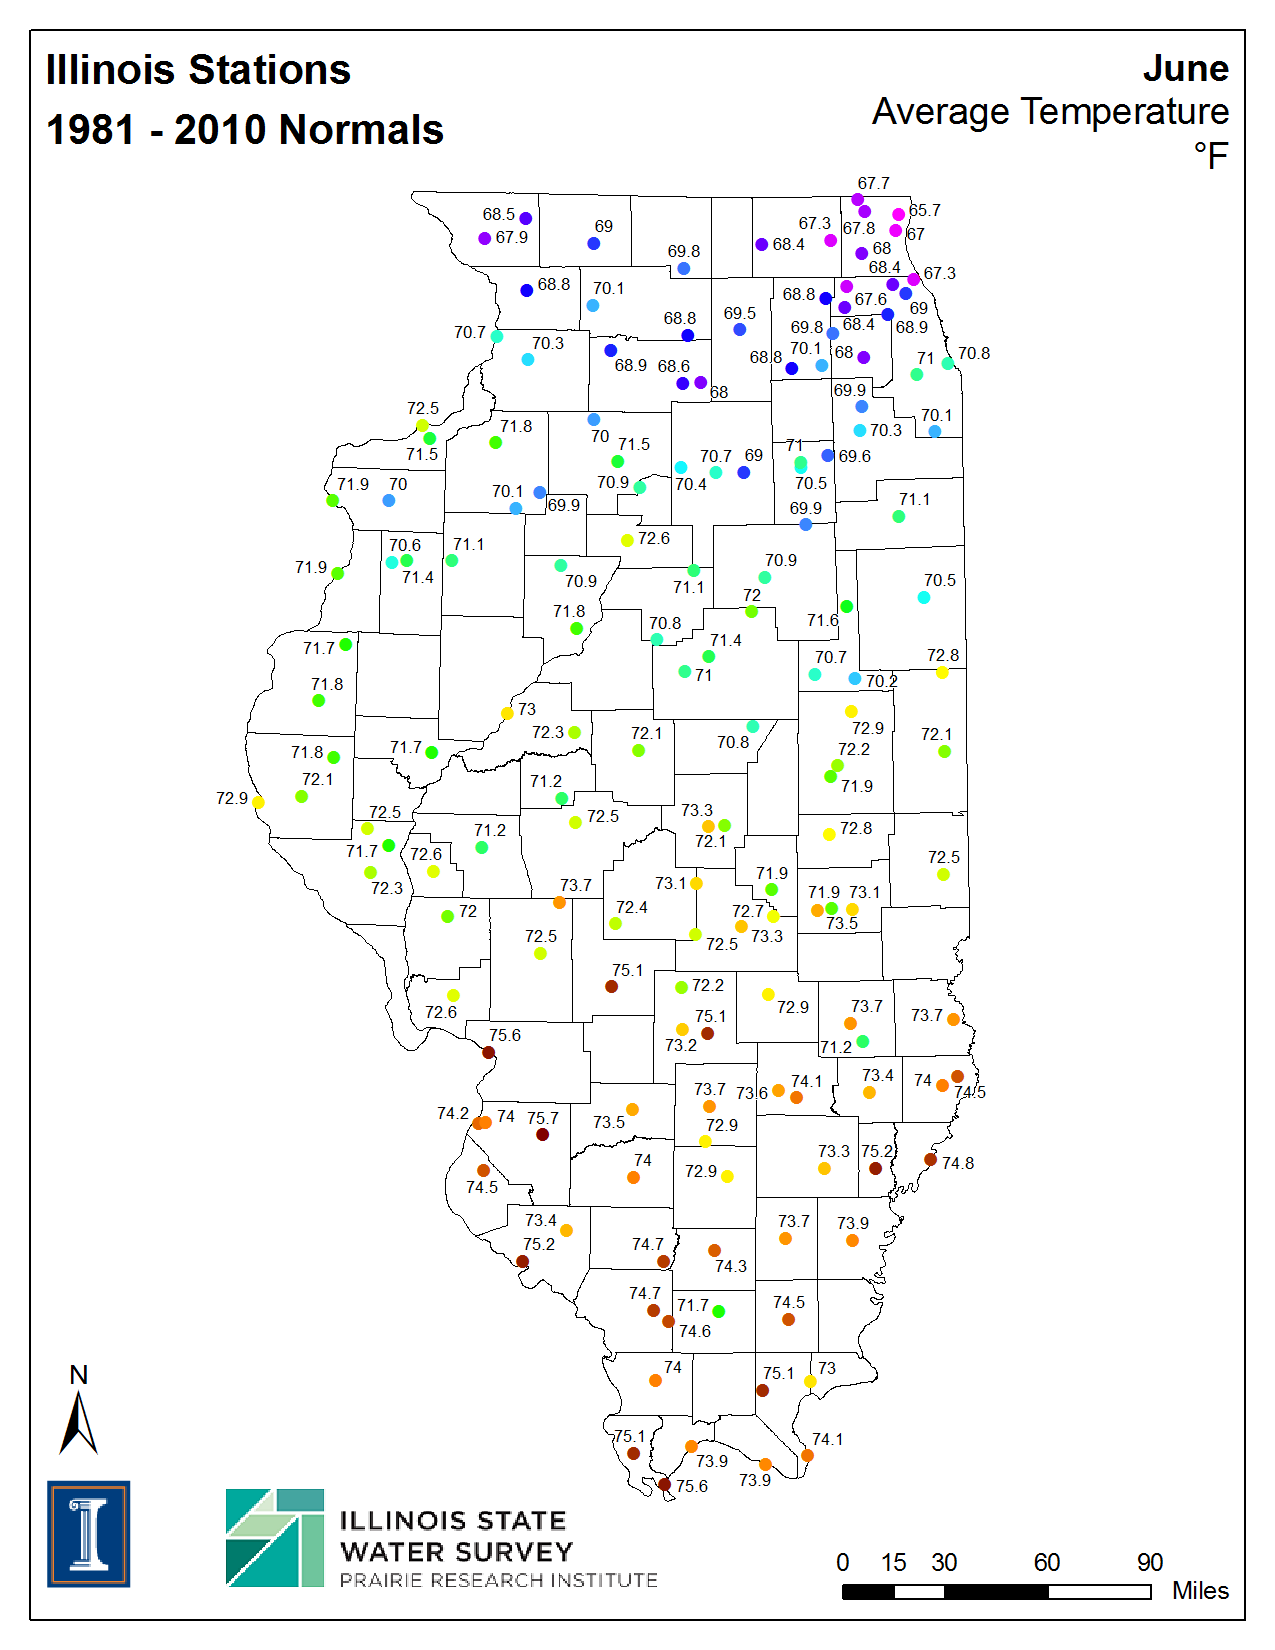
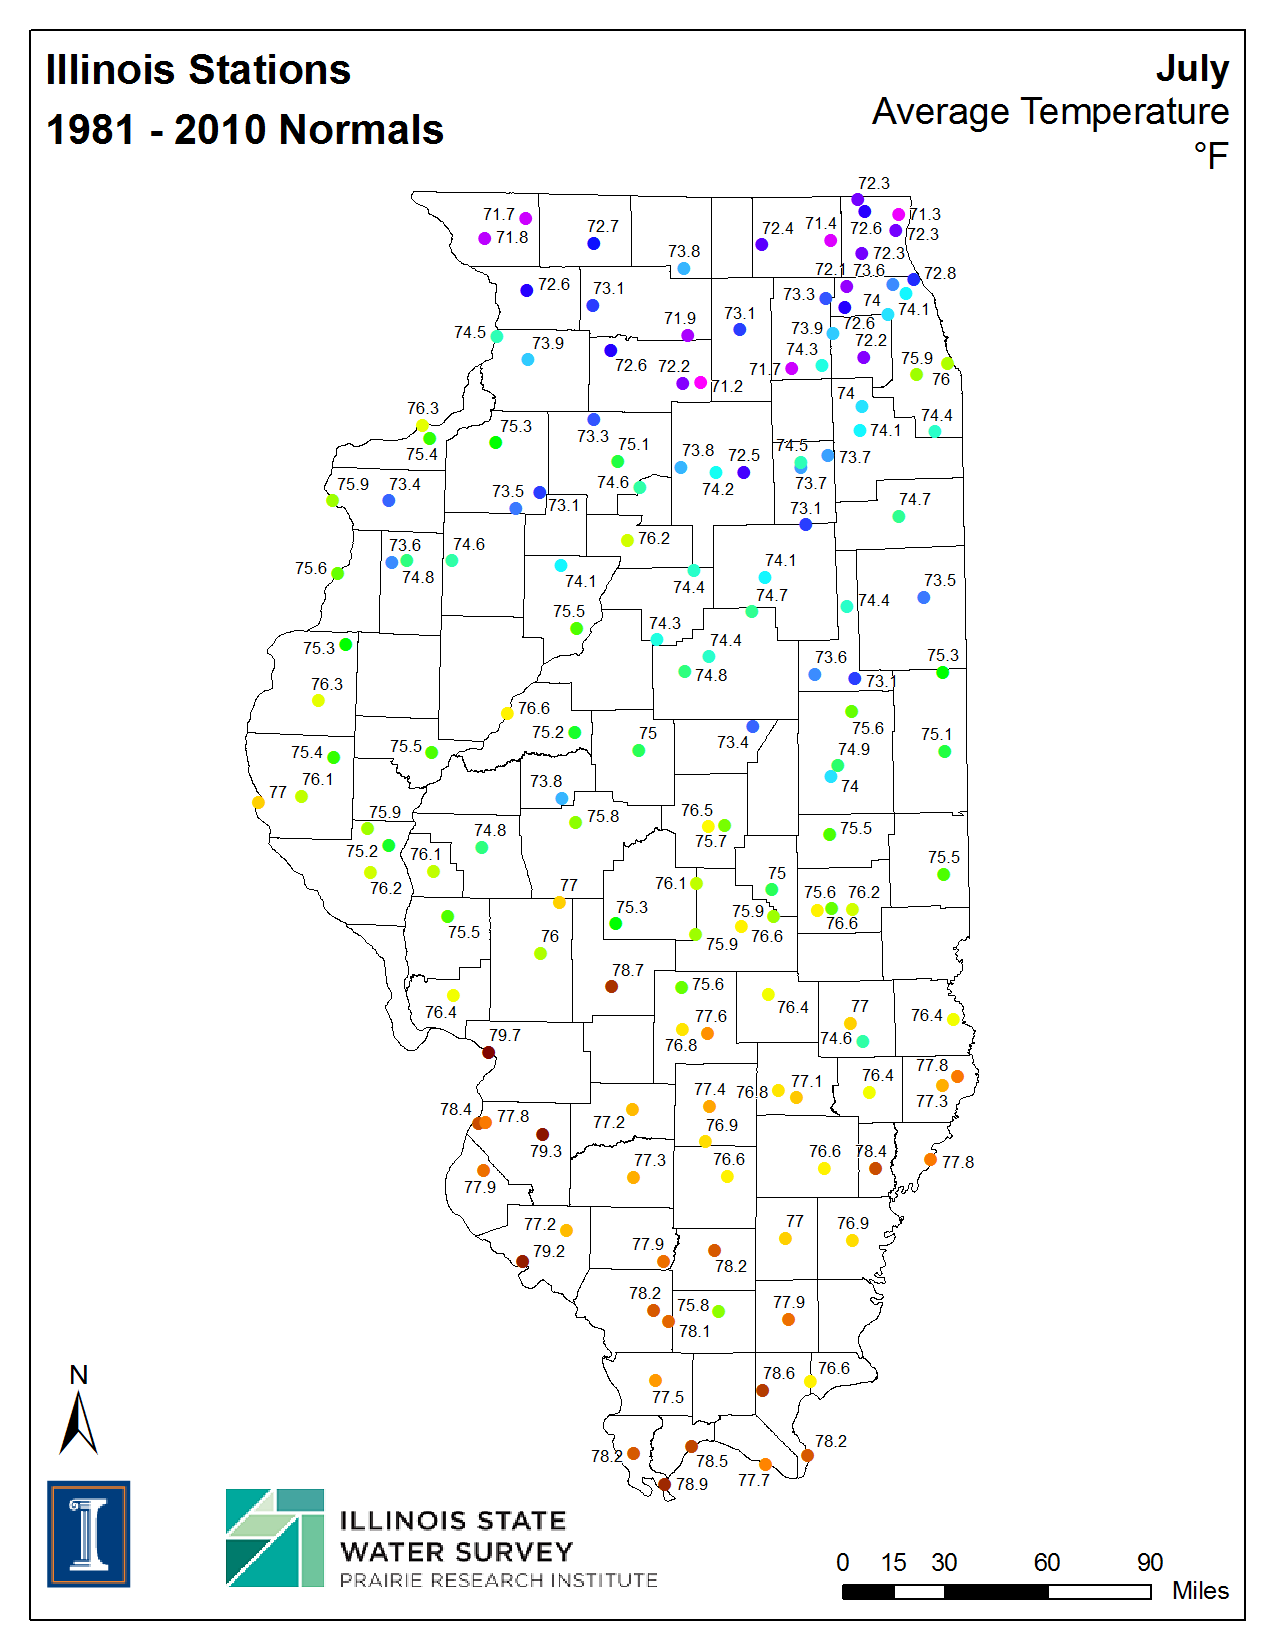
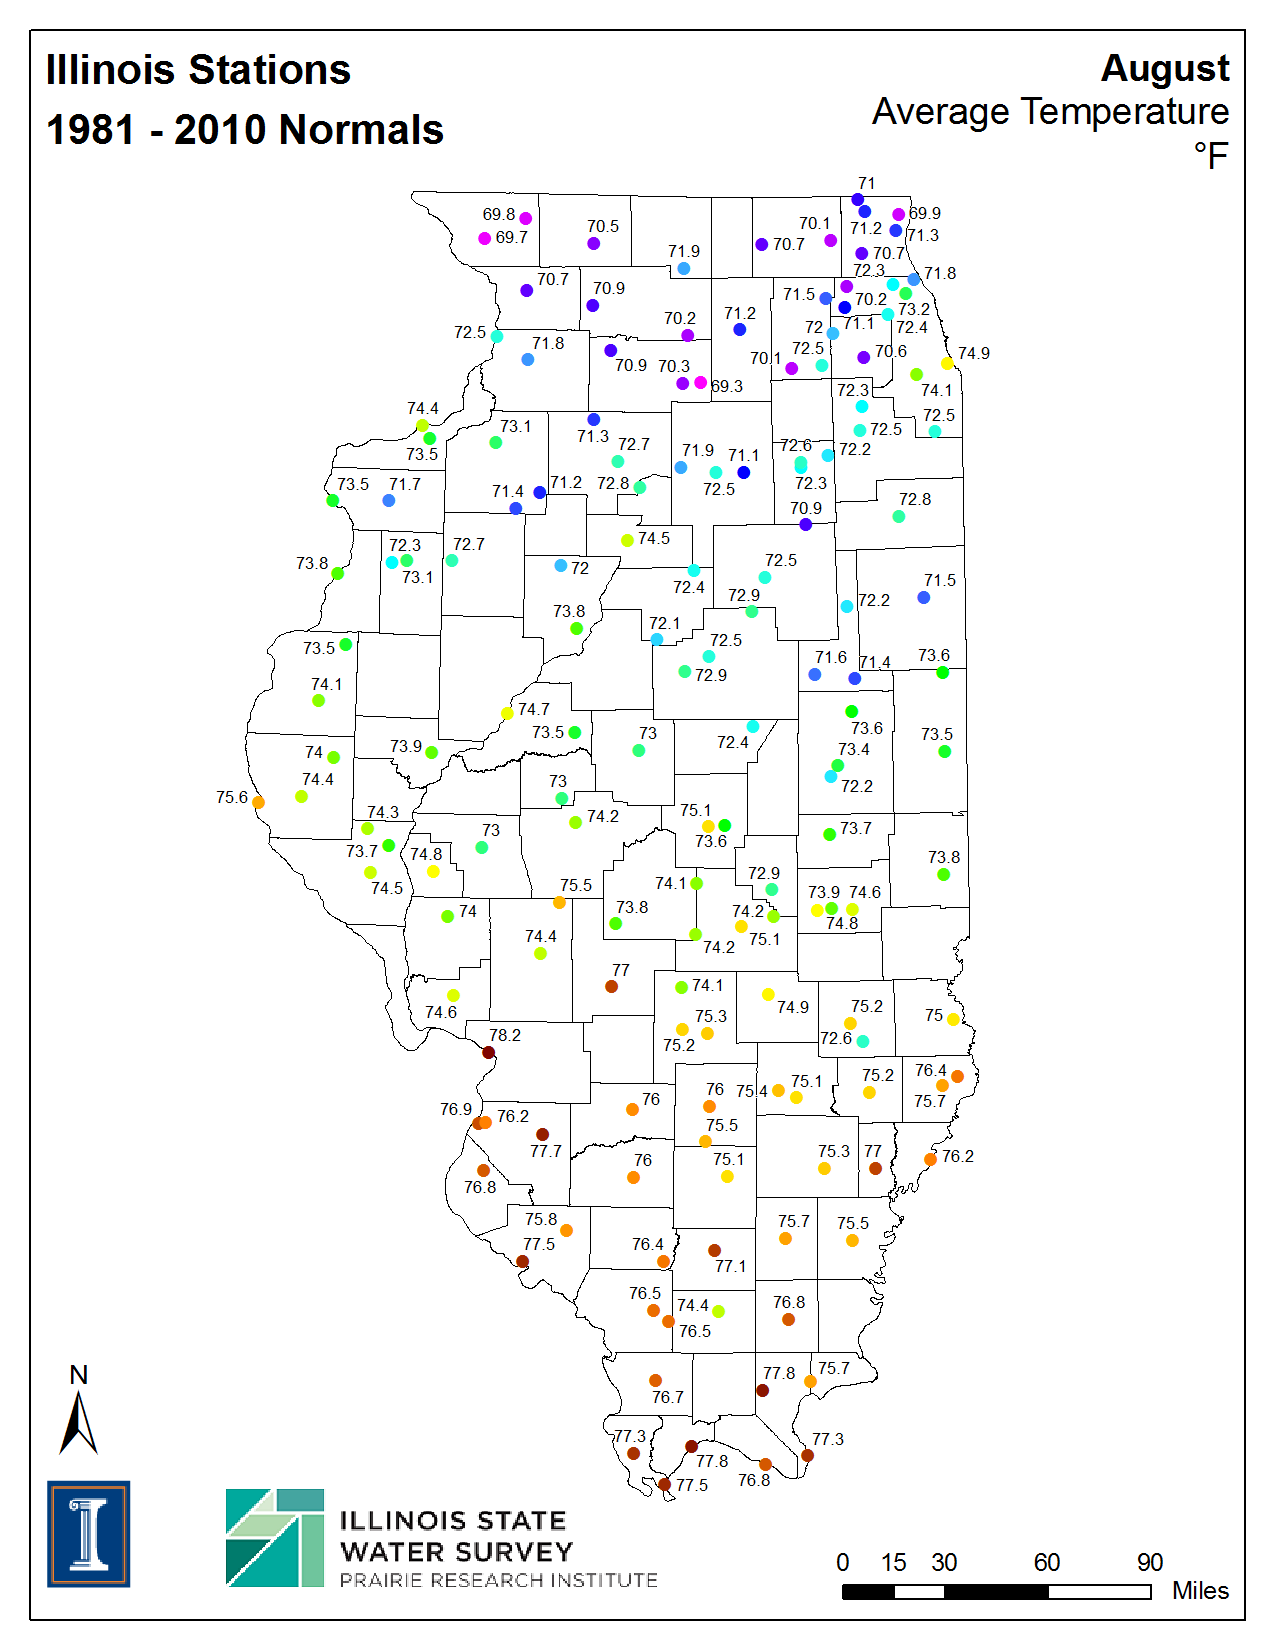
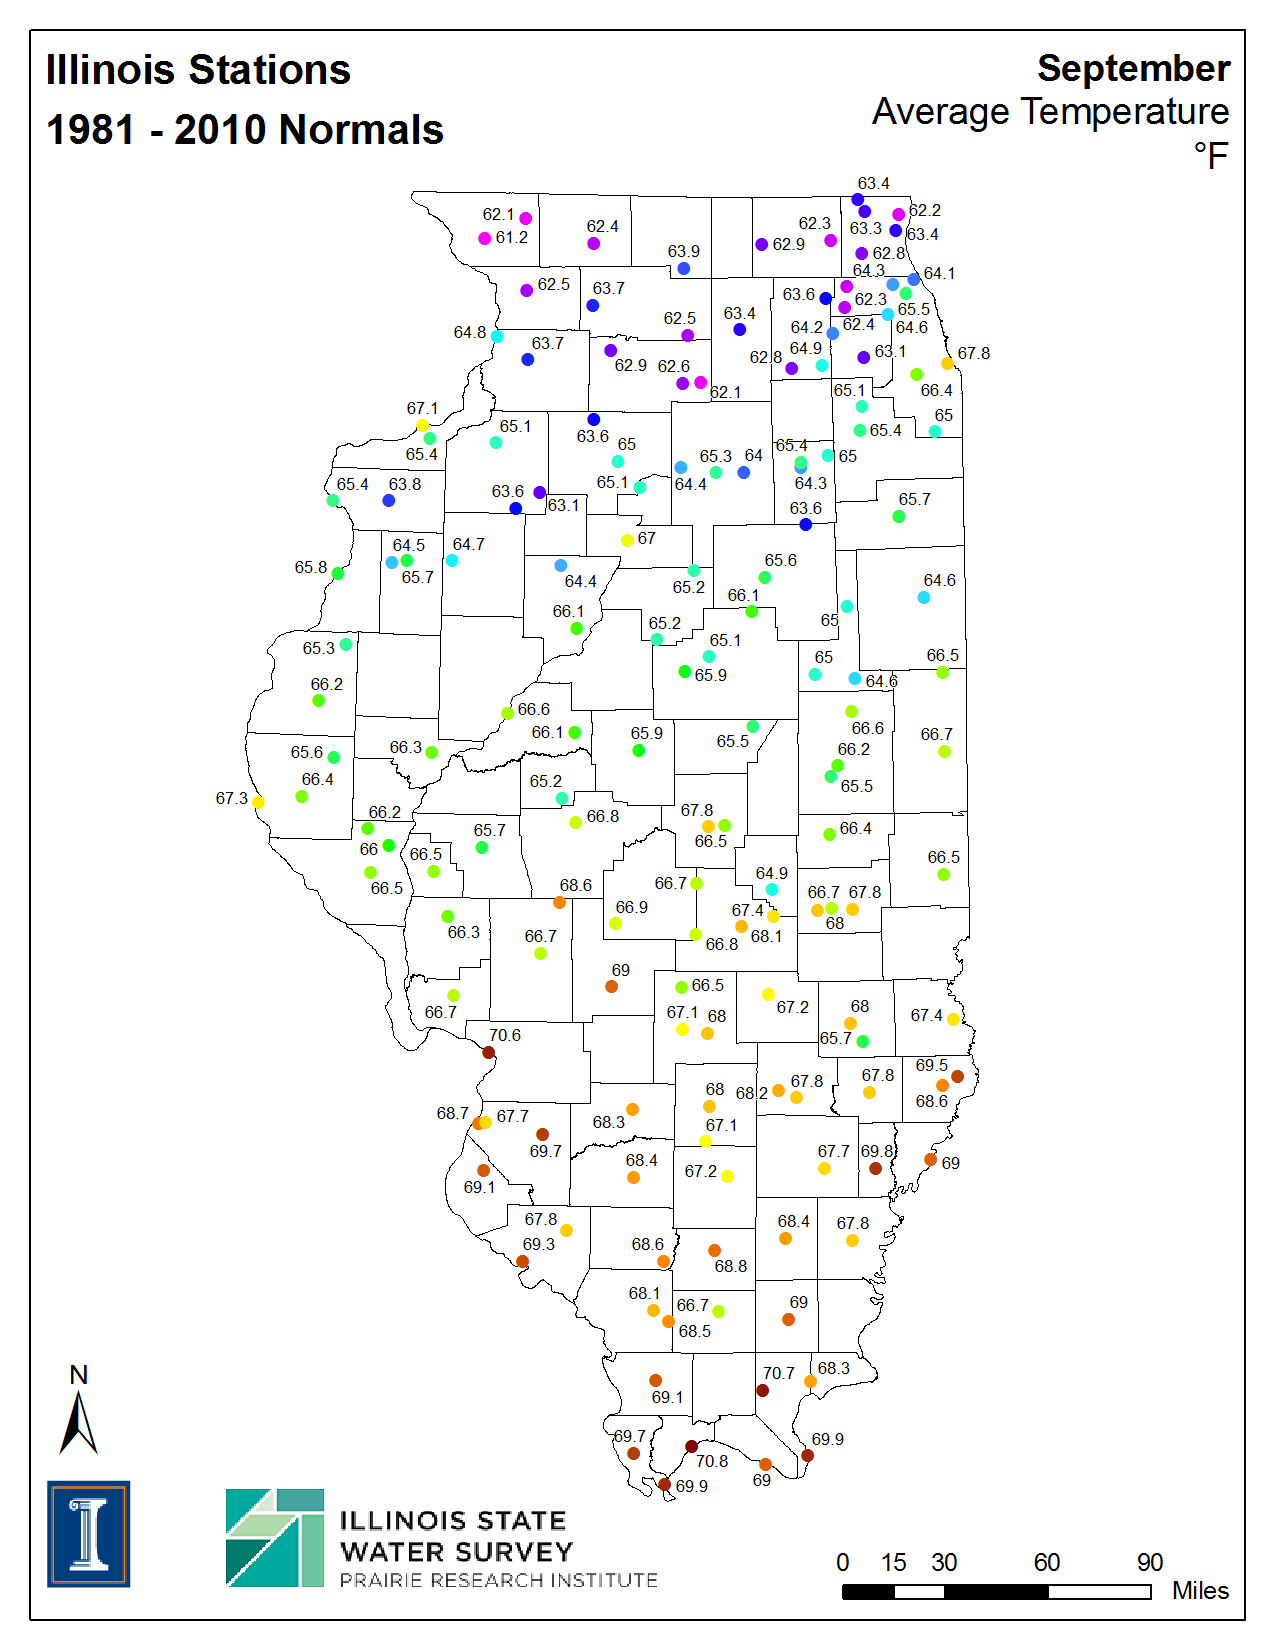
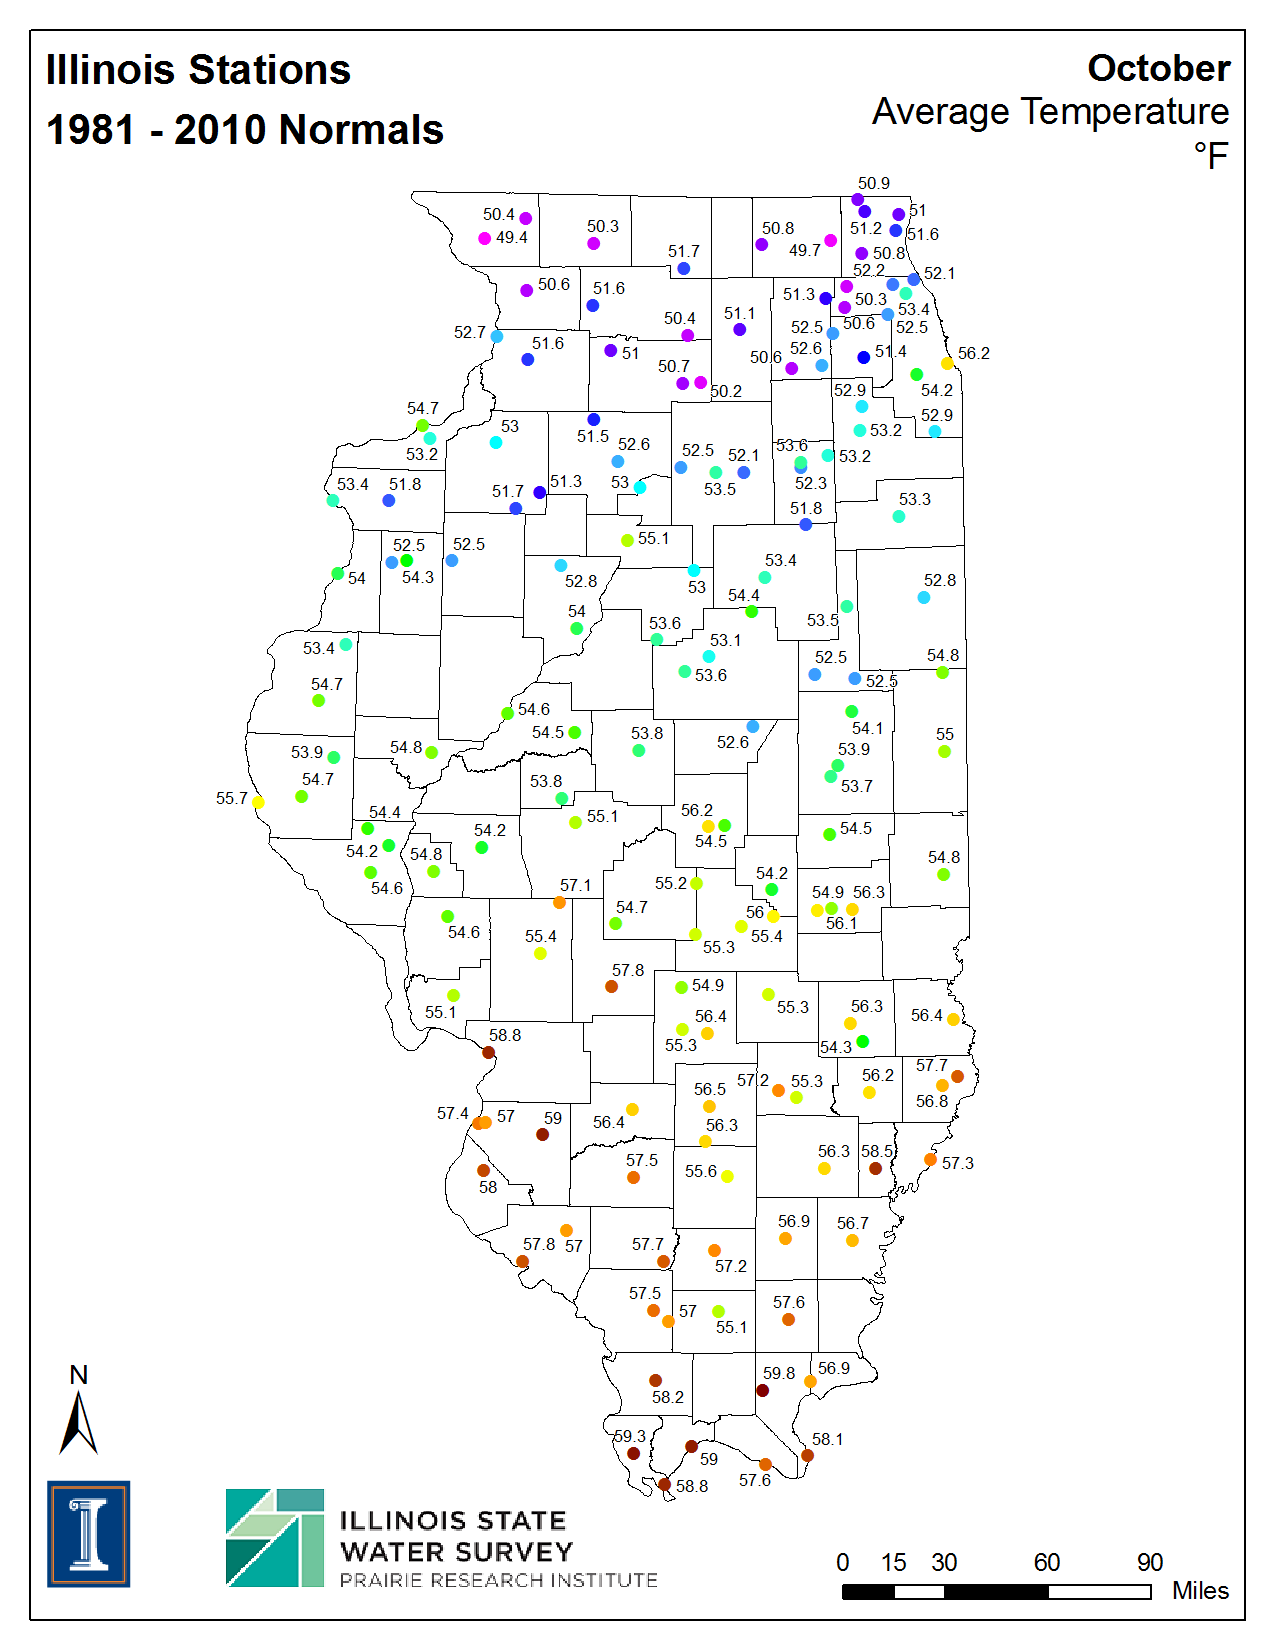
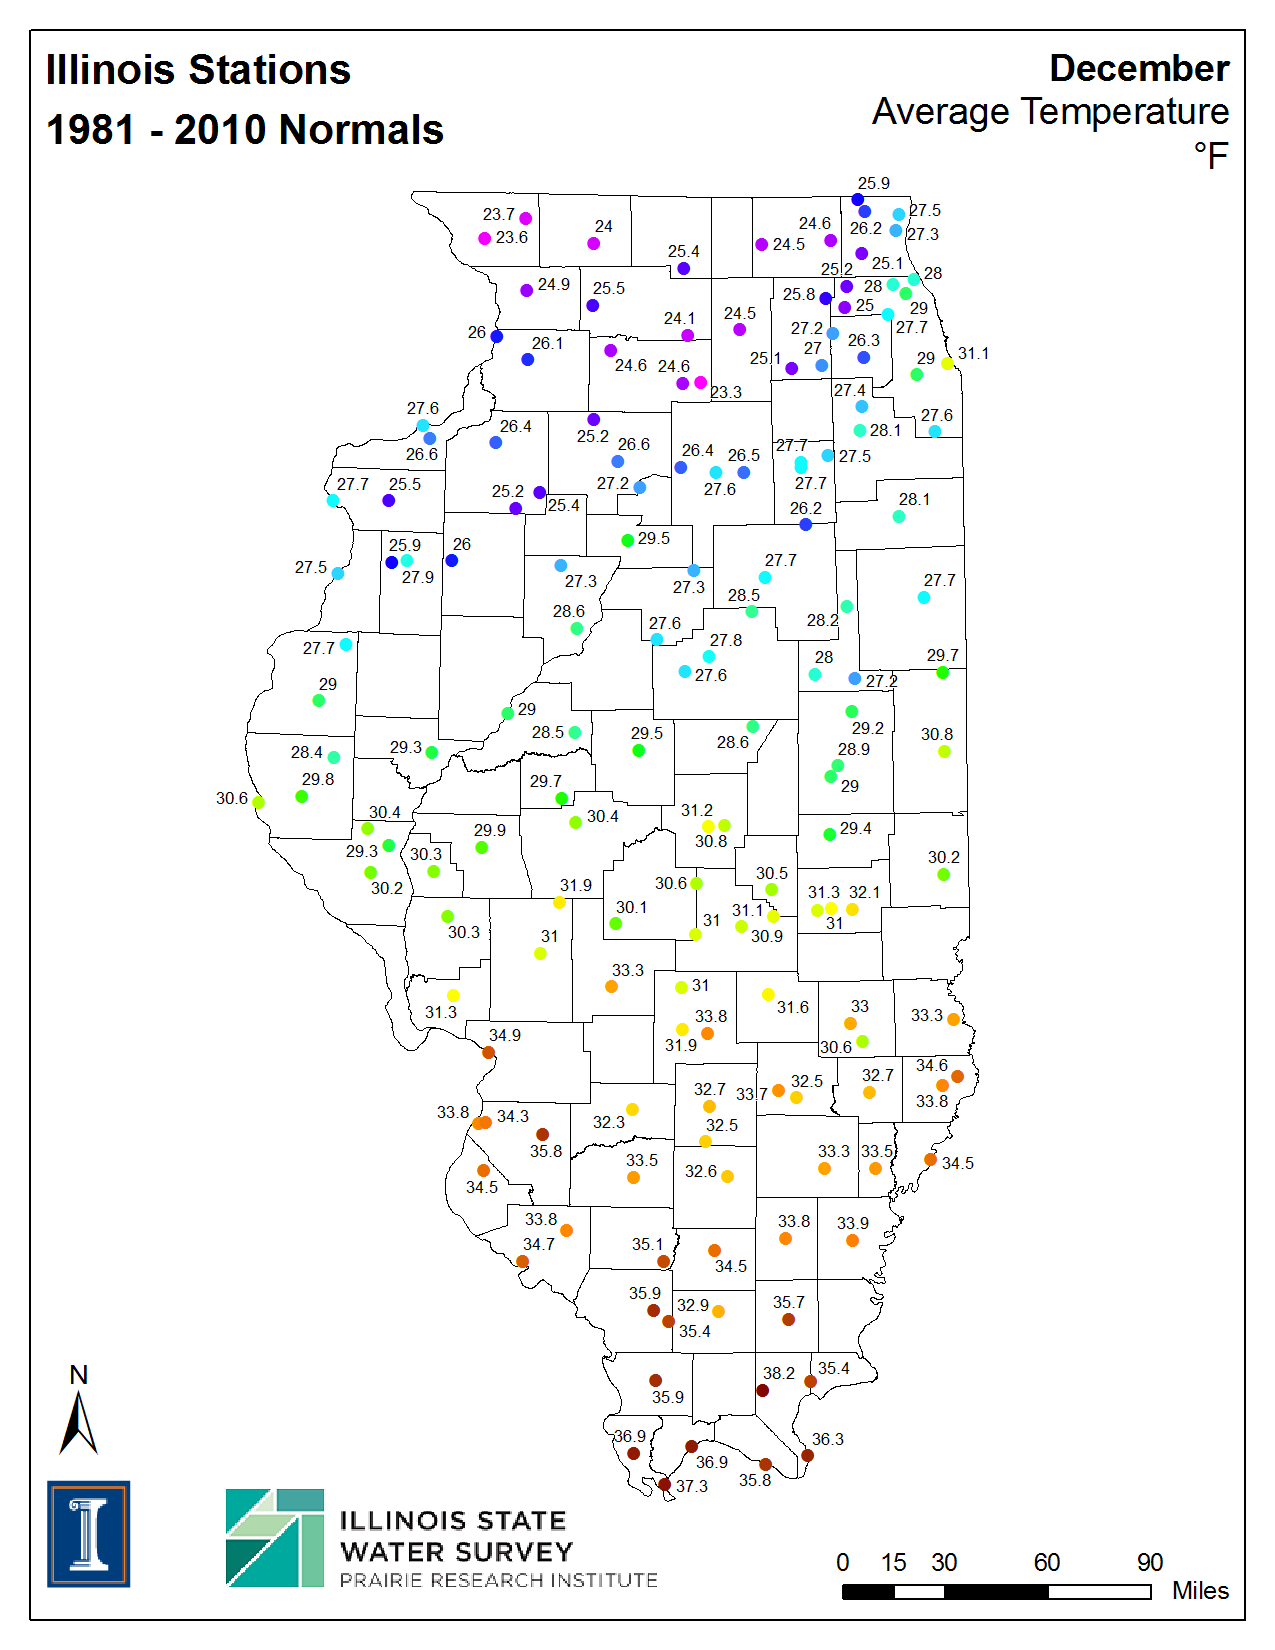
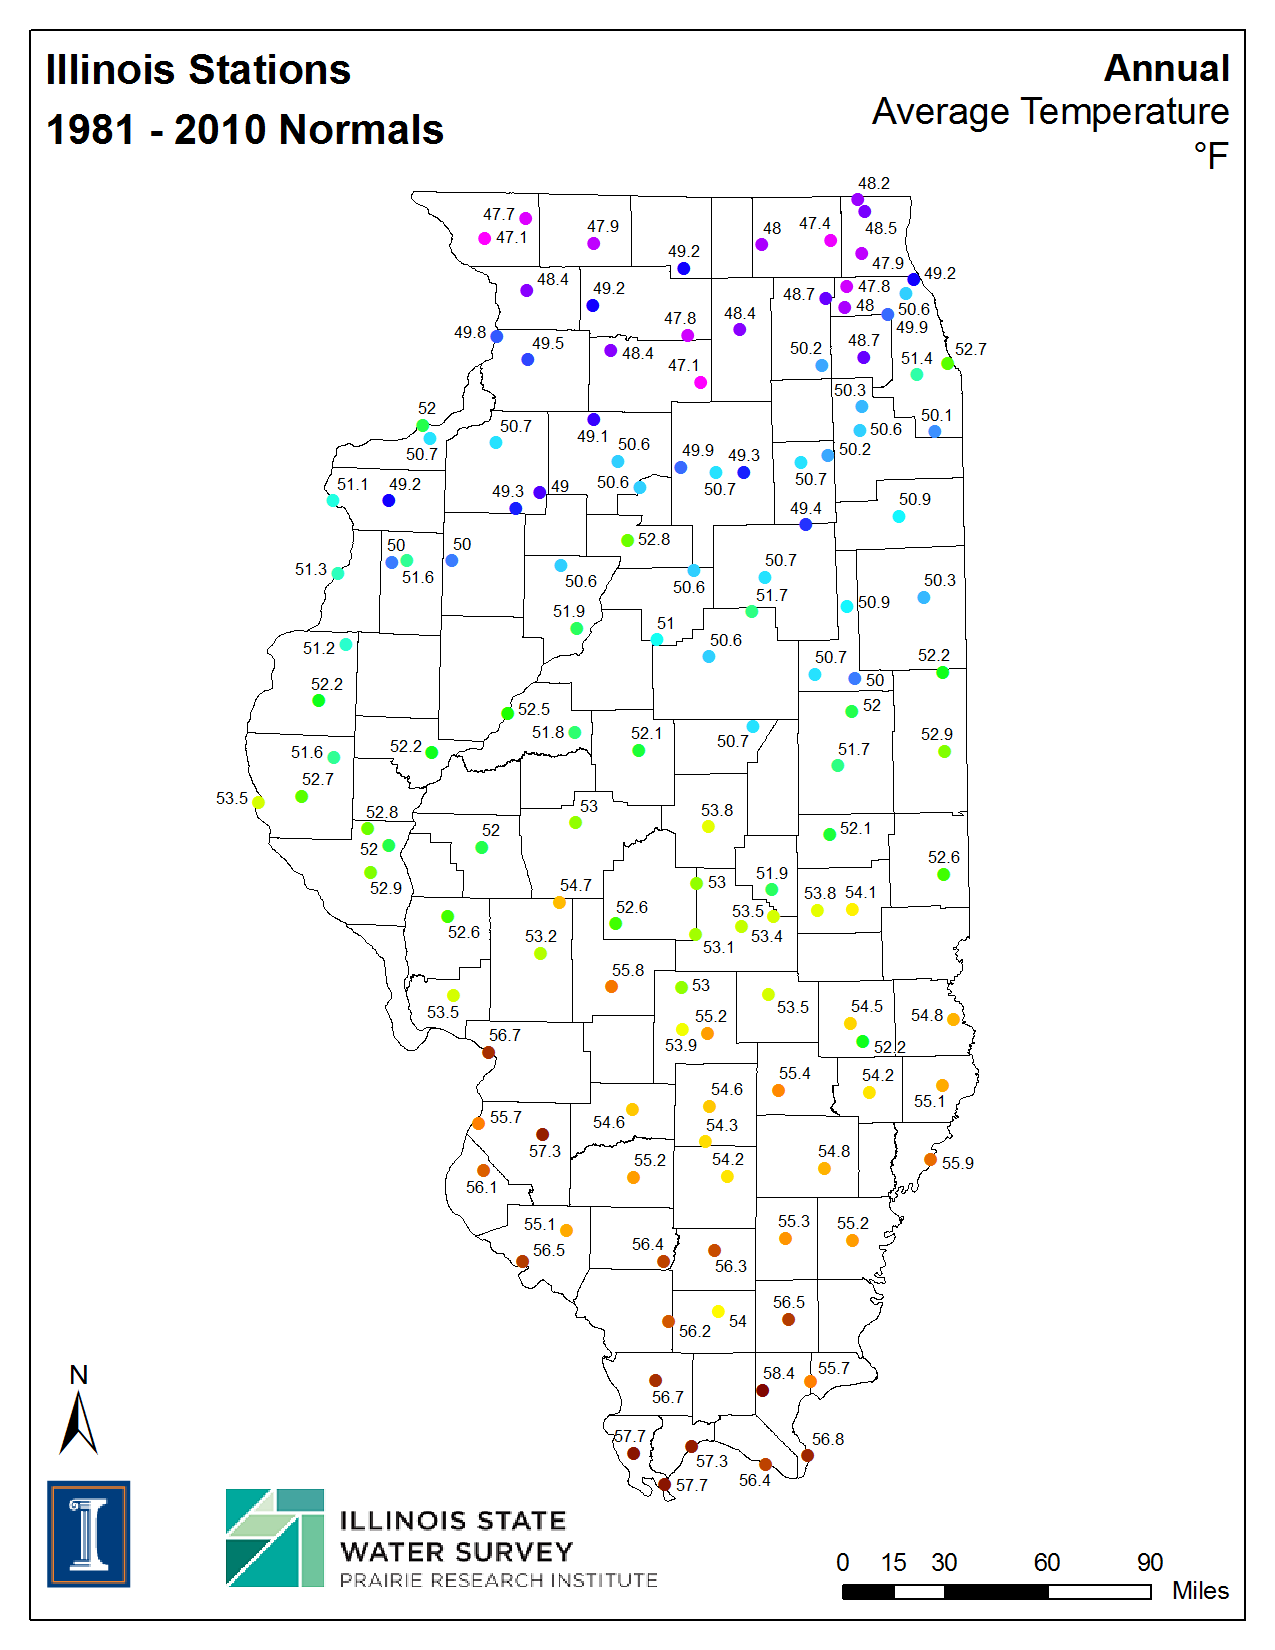
| Mean Daily Temperature (degrees F) | ||||||
| Jan | Feb | Mar | Apr | May | Jun | |
| Jul | Aug | Sep | Oct | Nov | Dec | Annual |
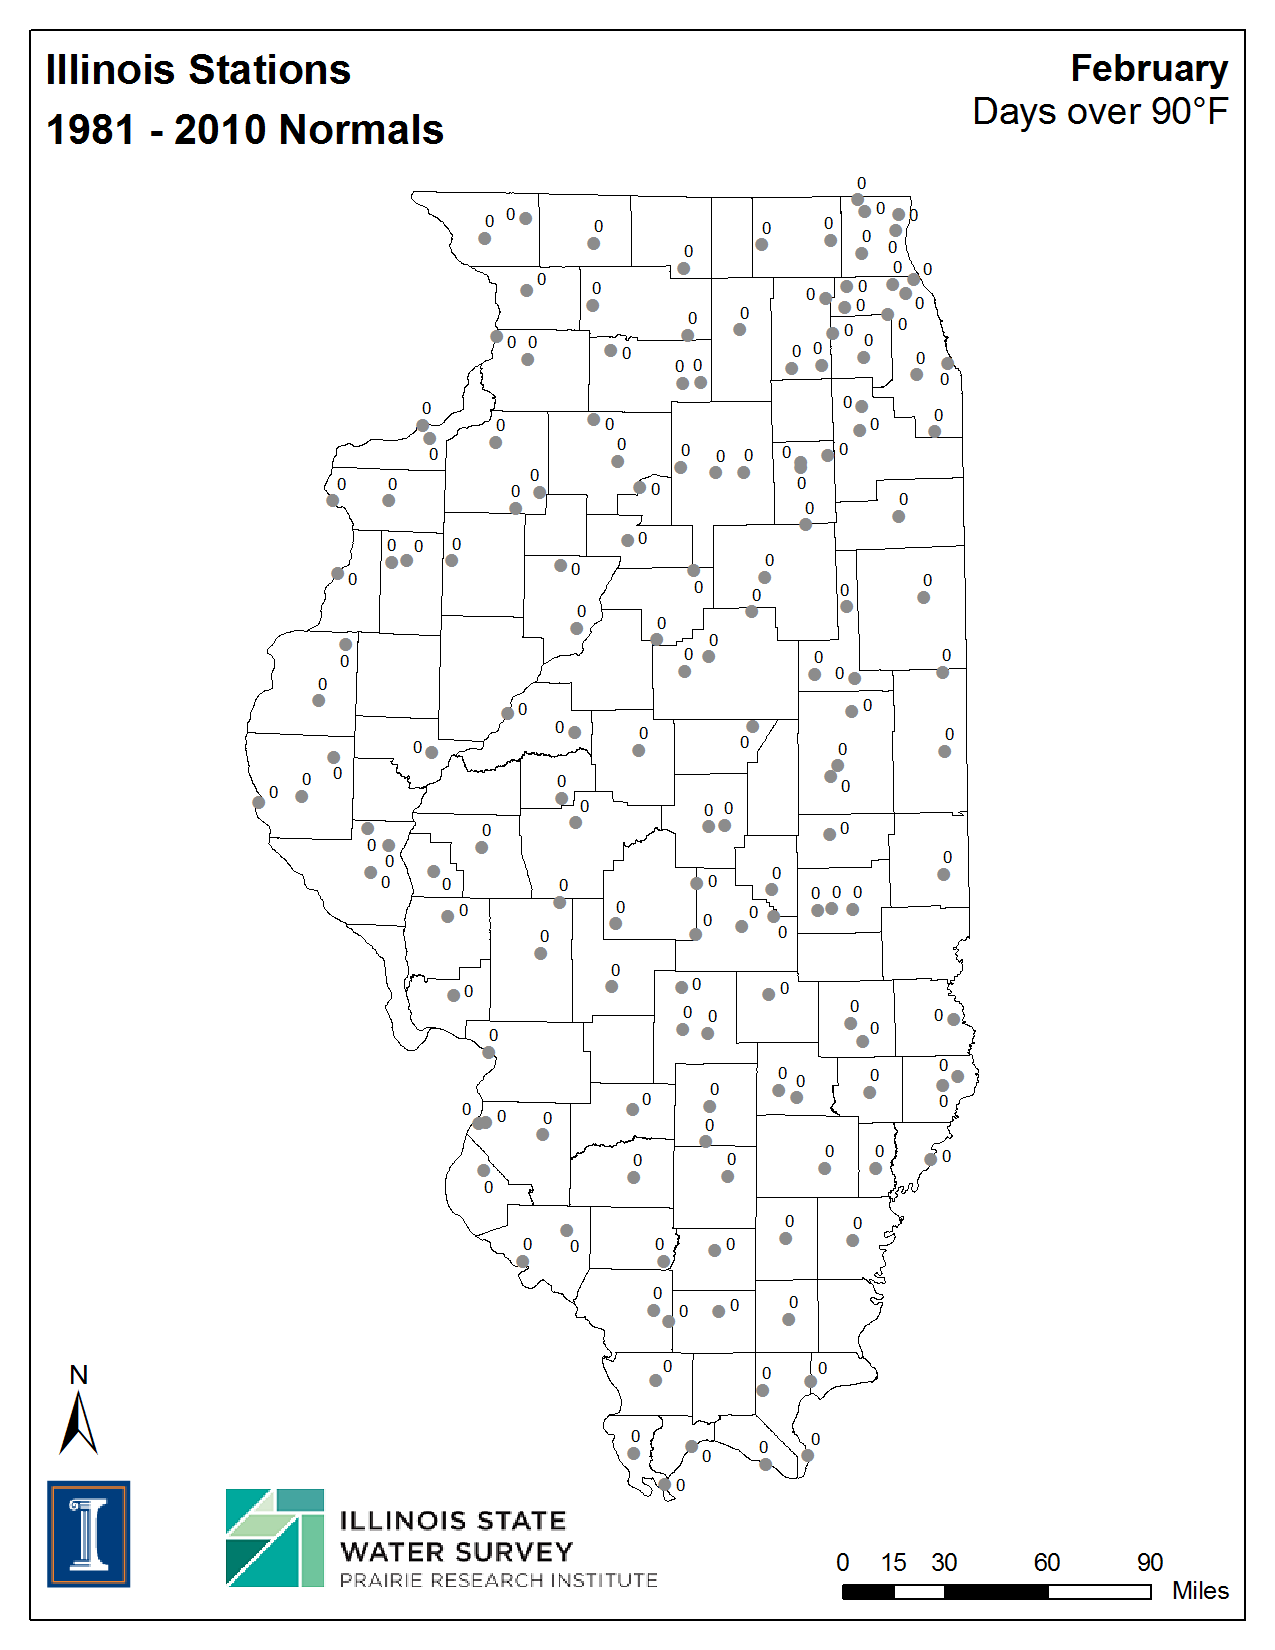
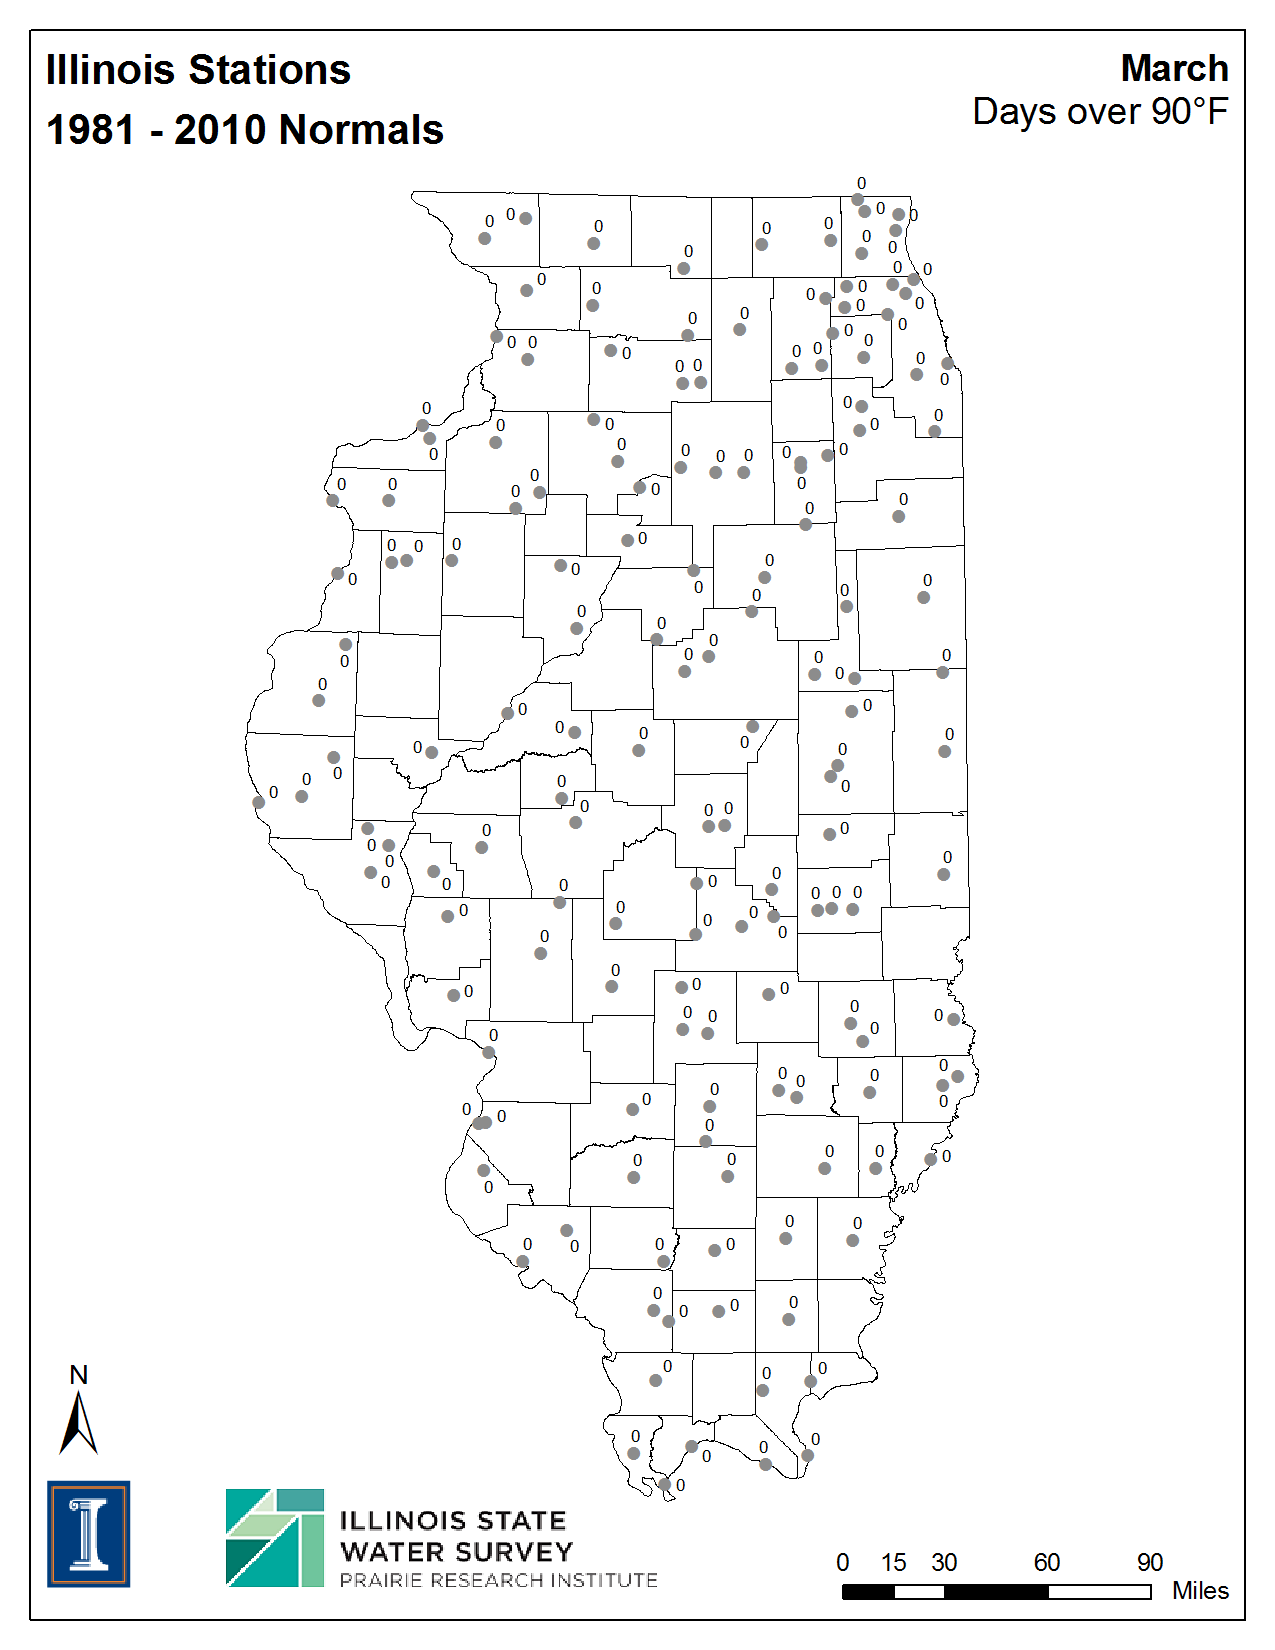
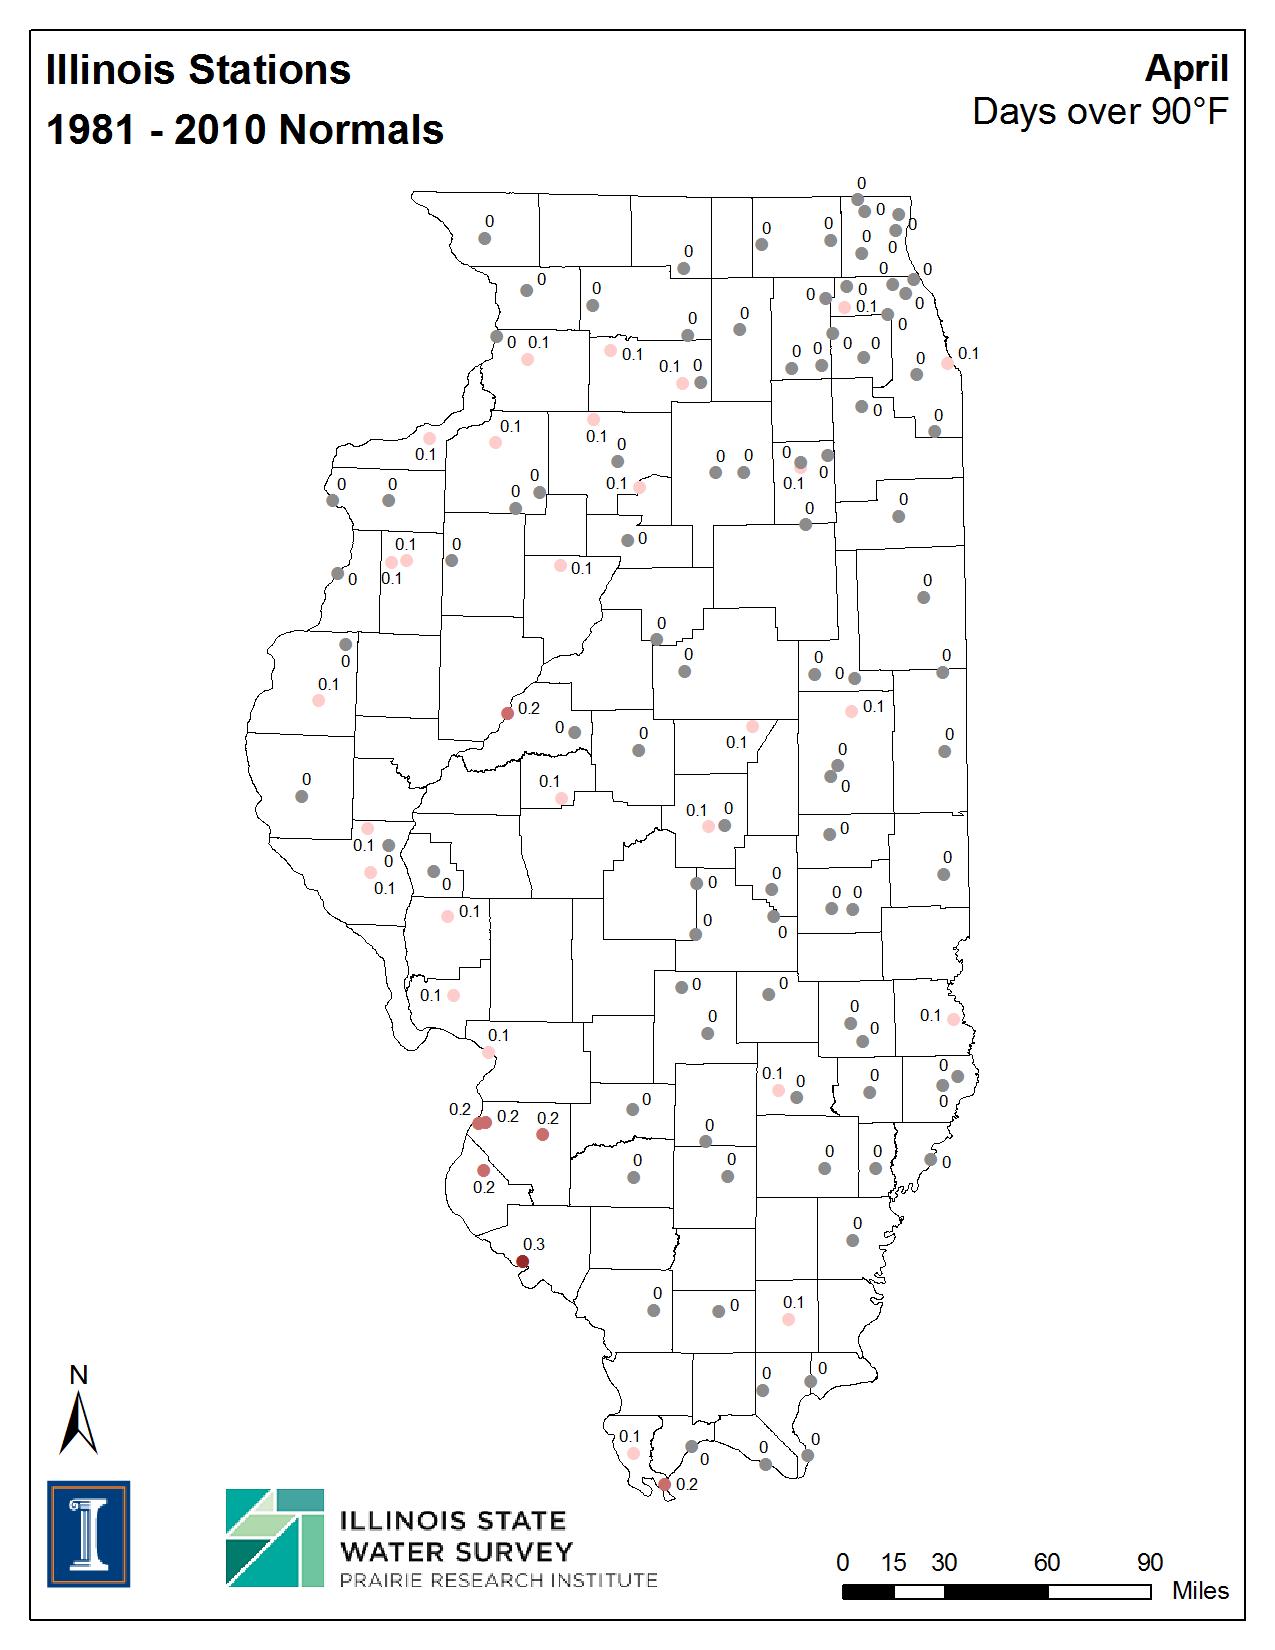
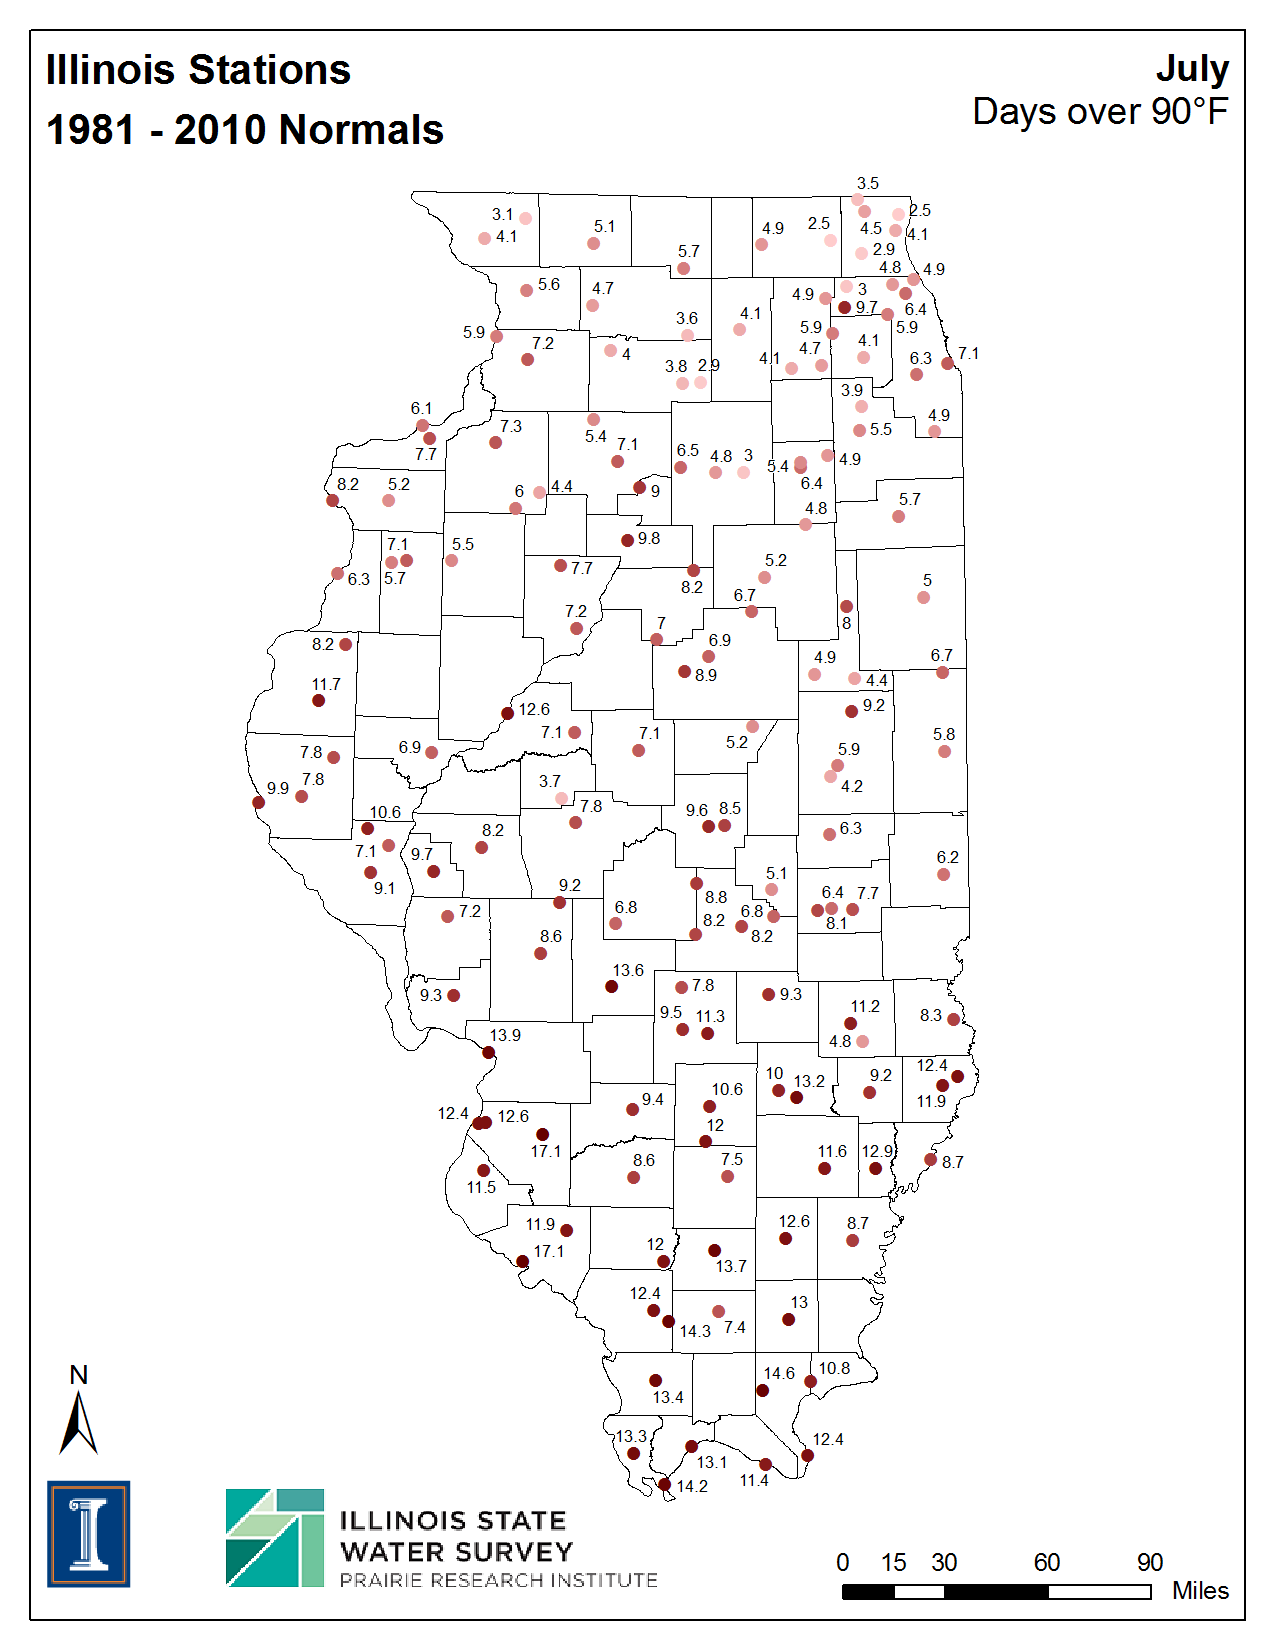
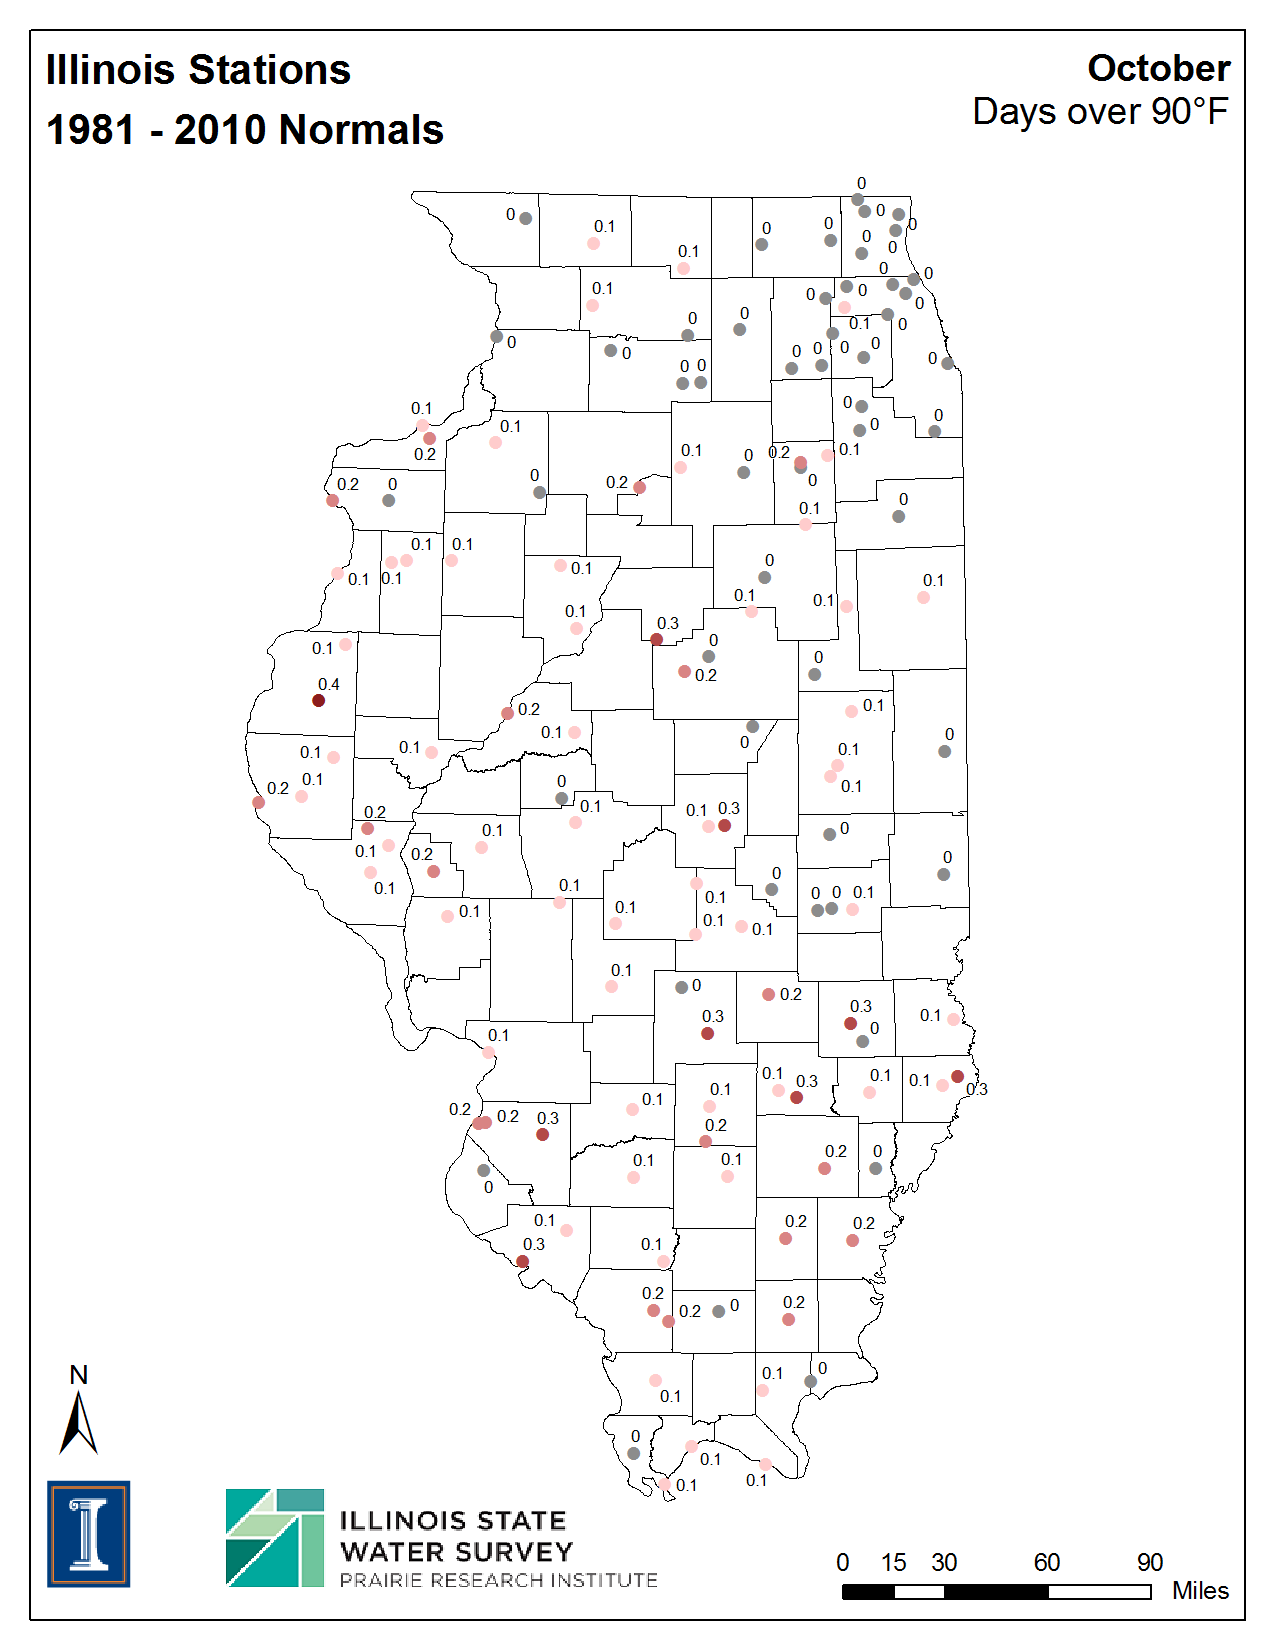
| Days Above 90 degrees F | ||||||
| Jan | Feb | Mar | Apr | May | Jun | |
| Jul | Aug | Sep | Oct | Nov | Dec | Annual |
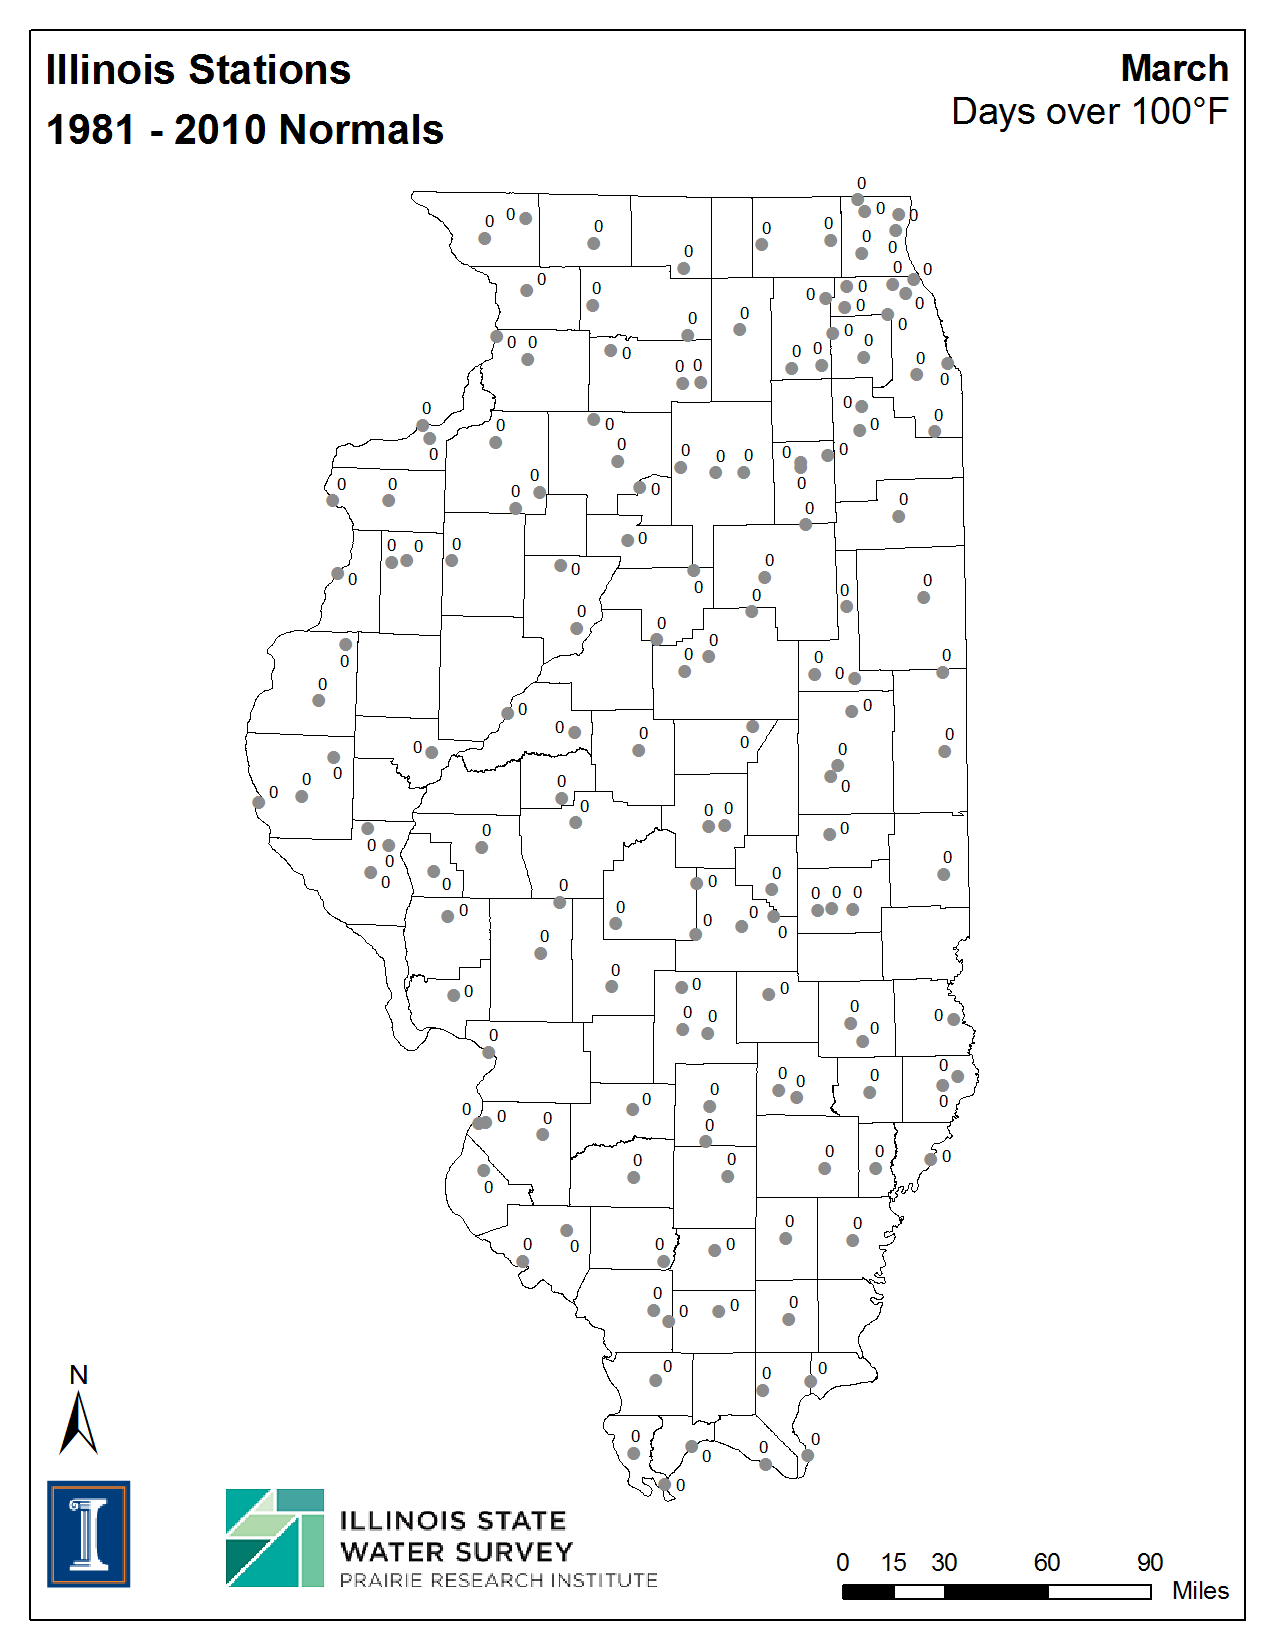
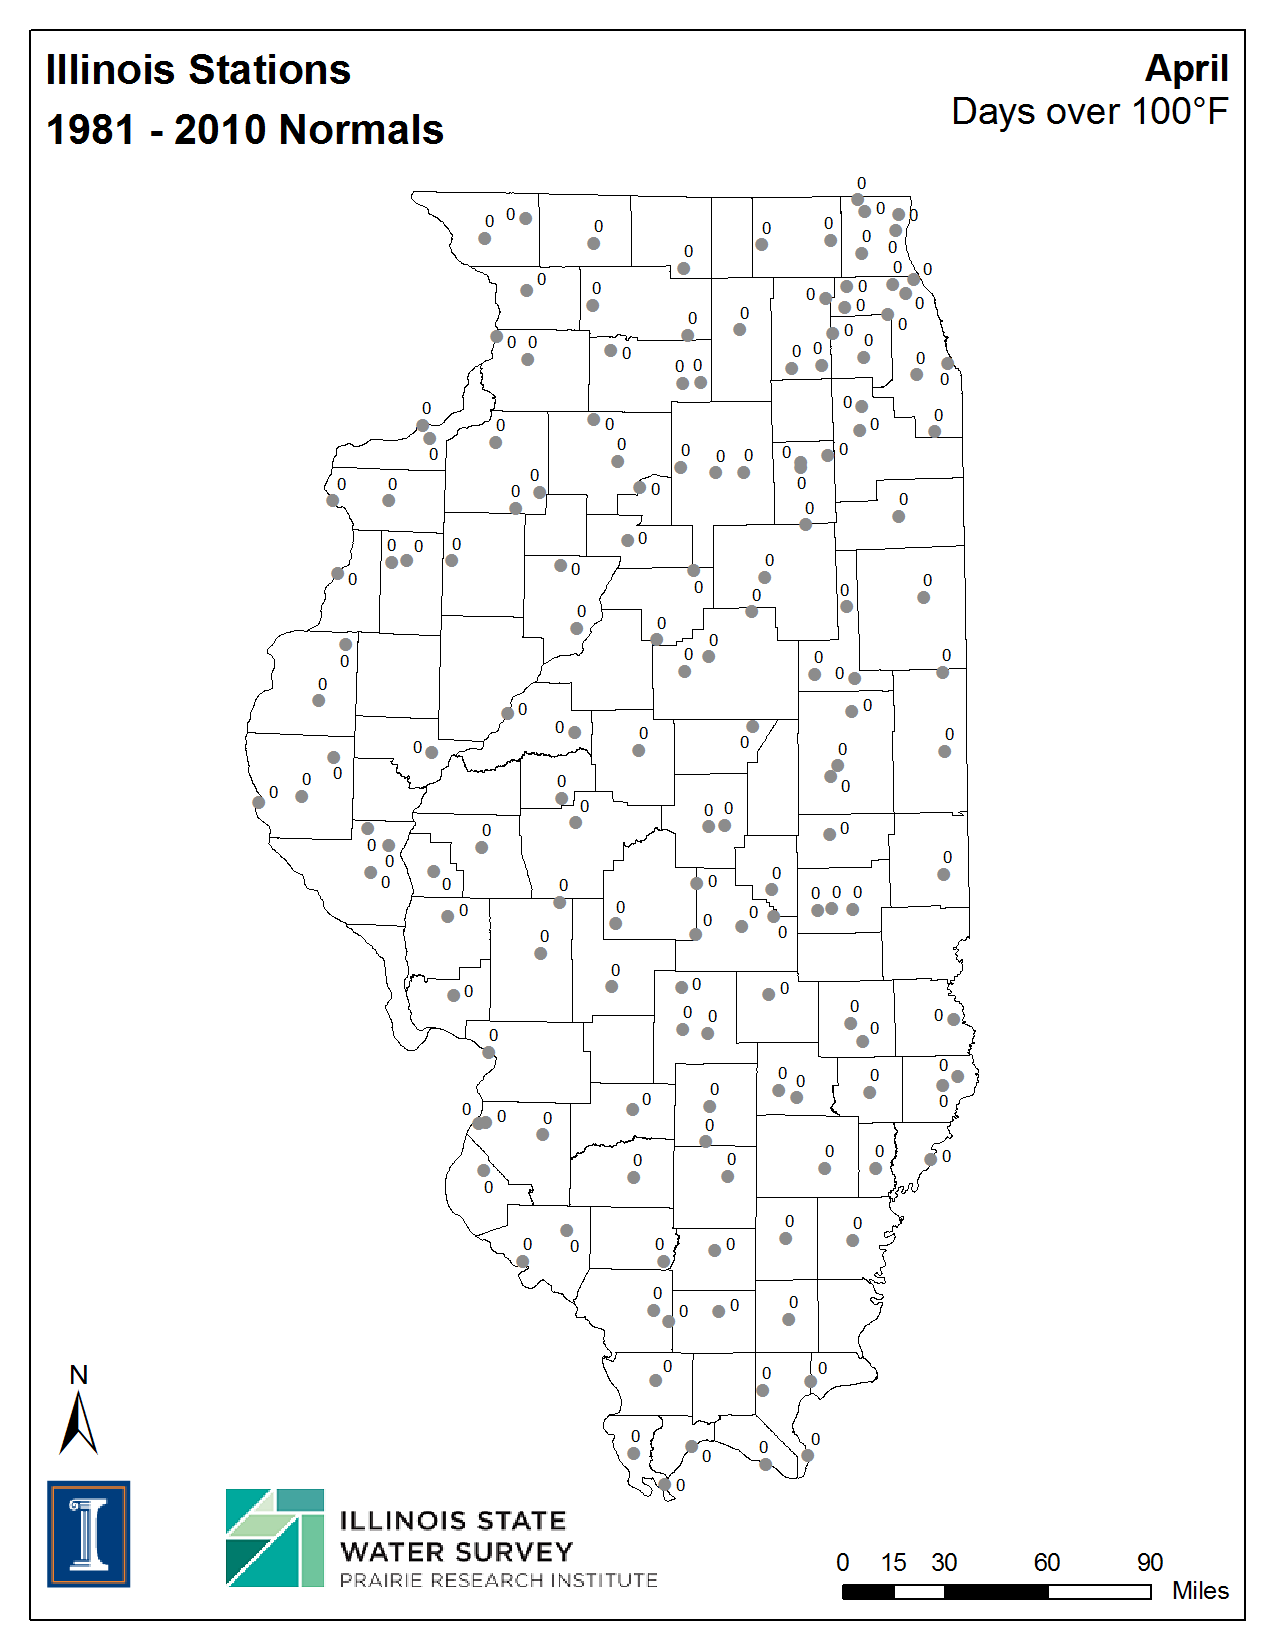
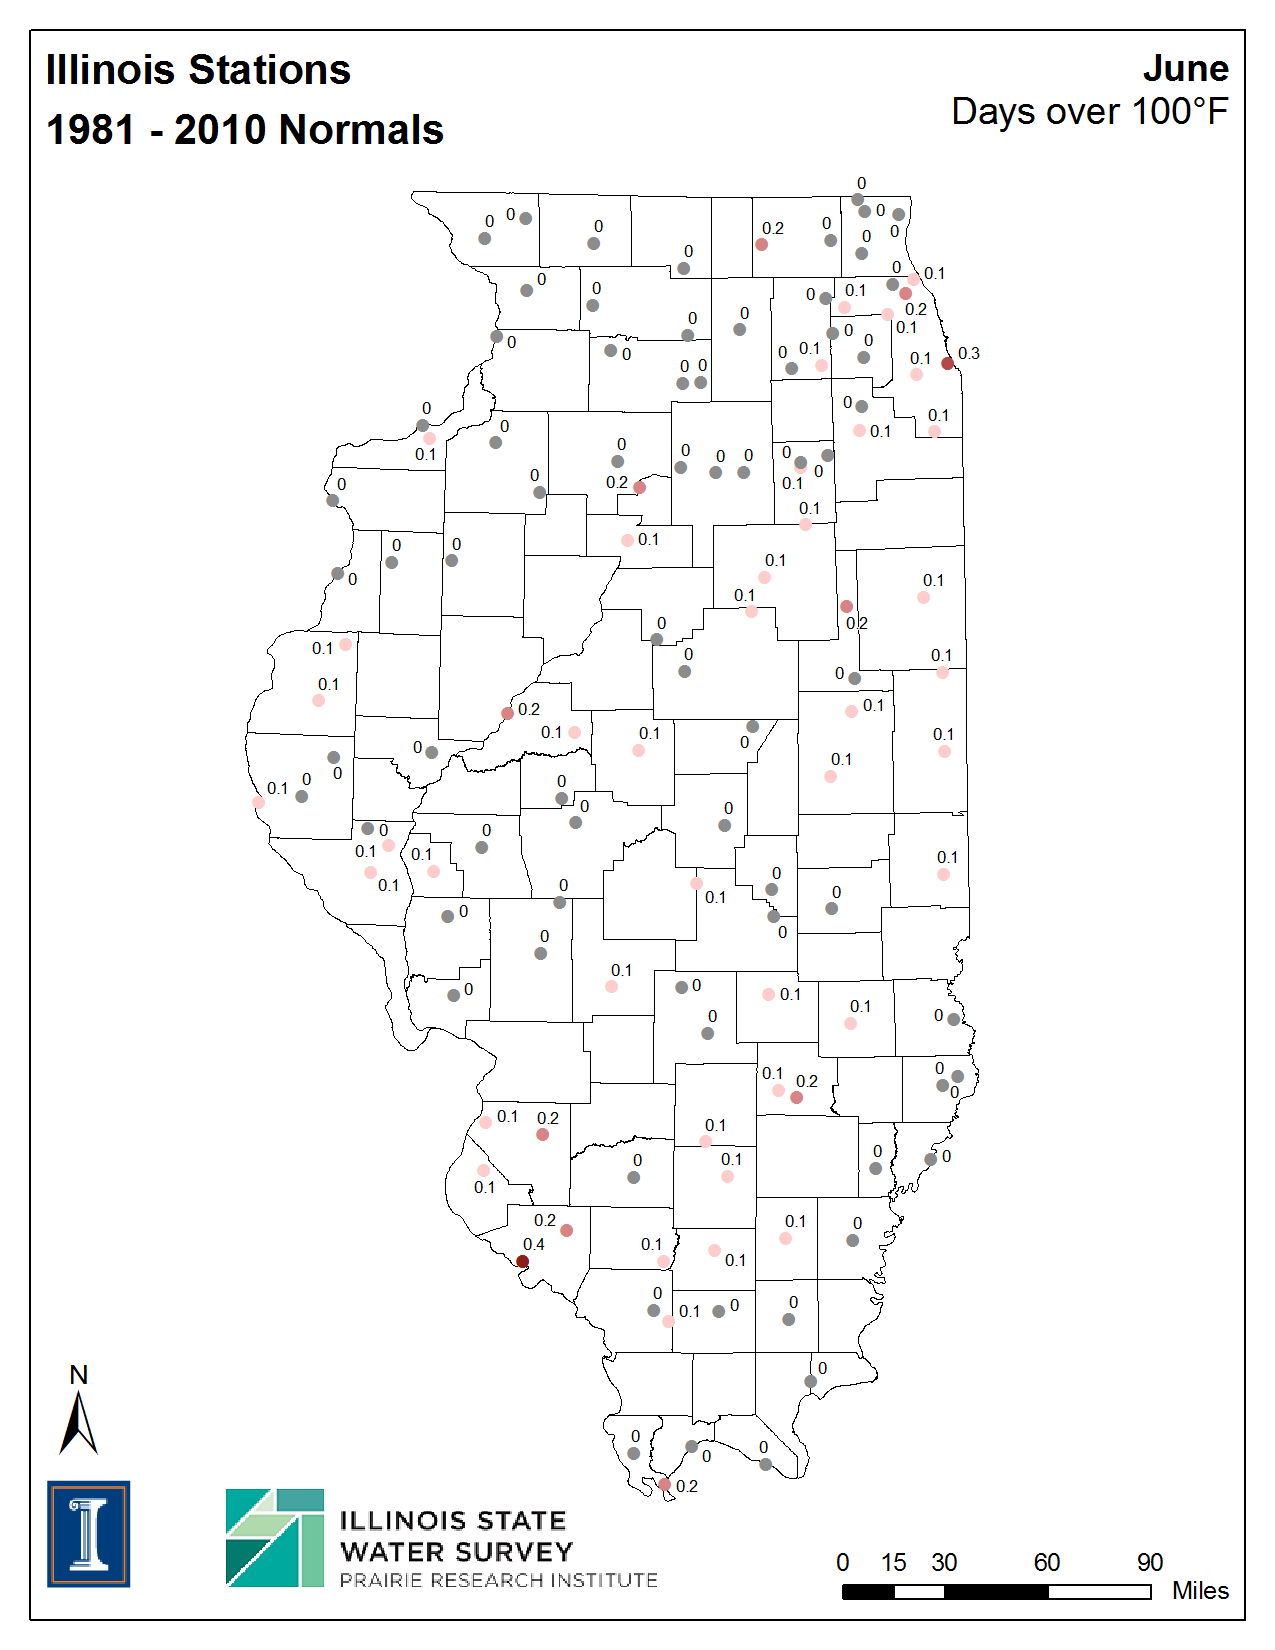
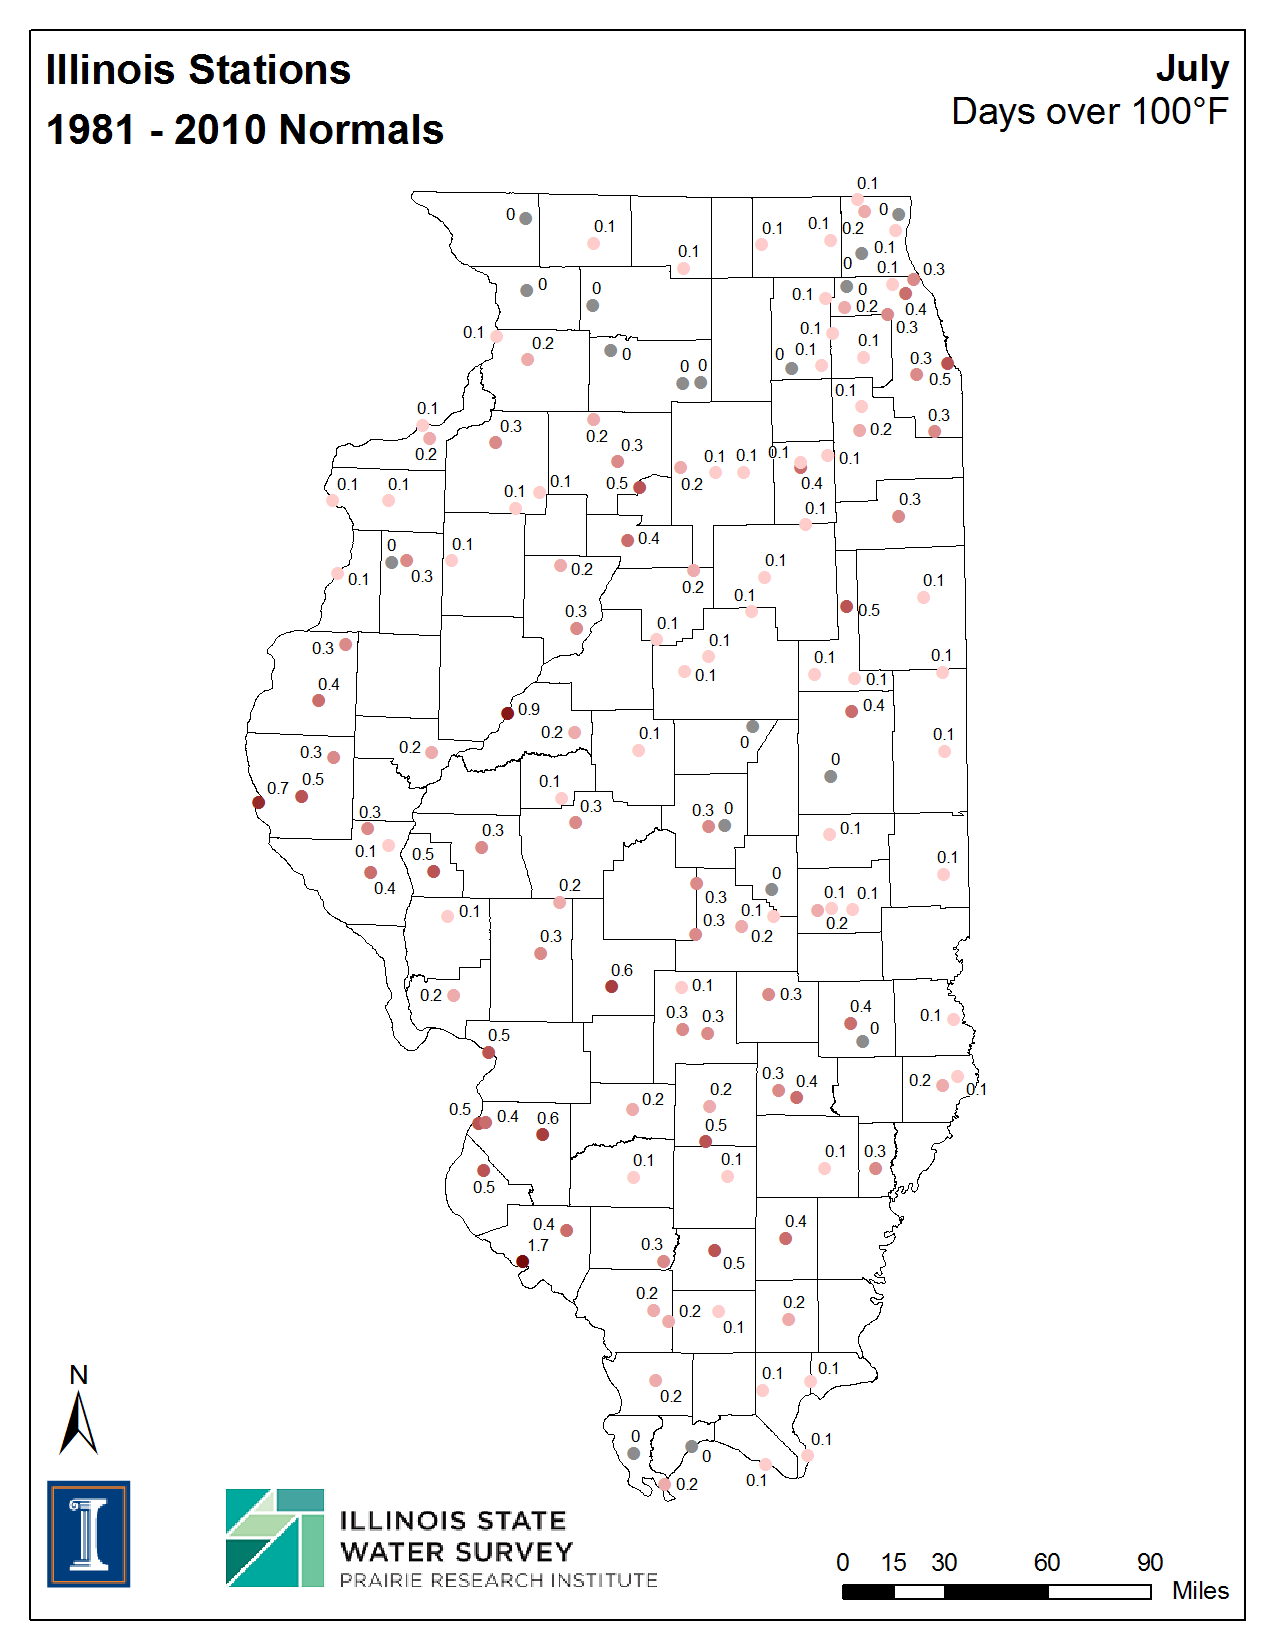
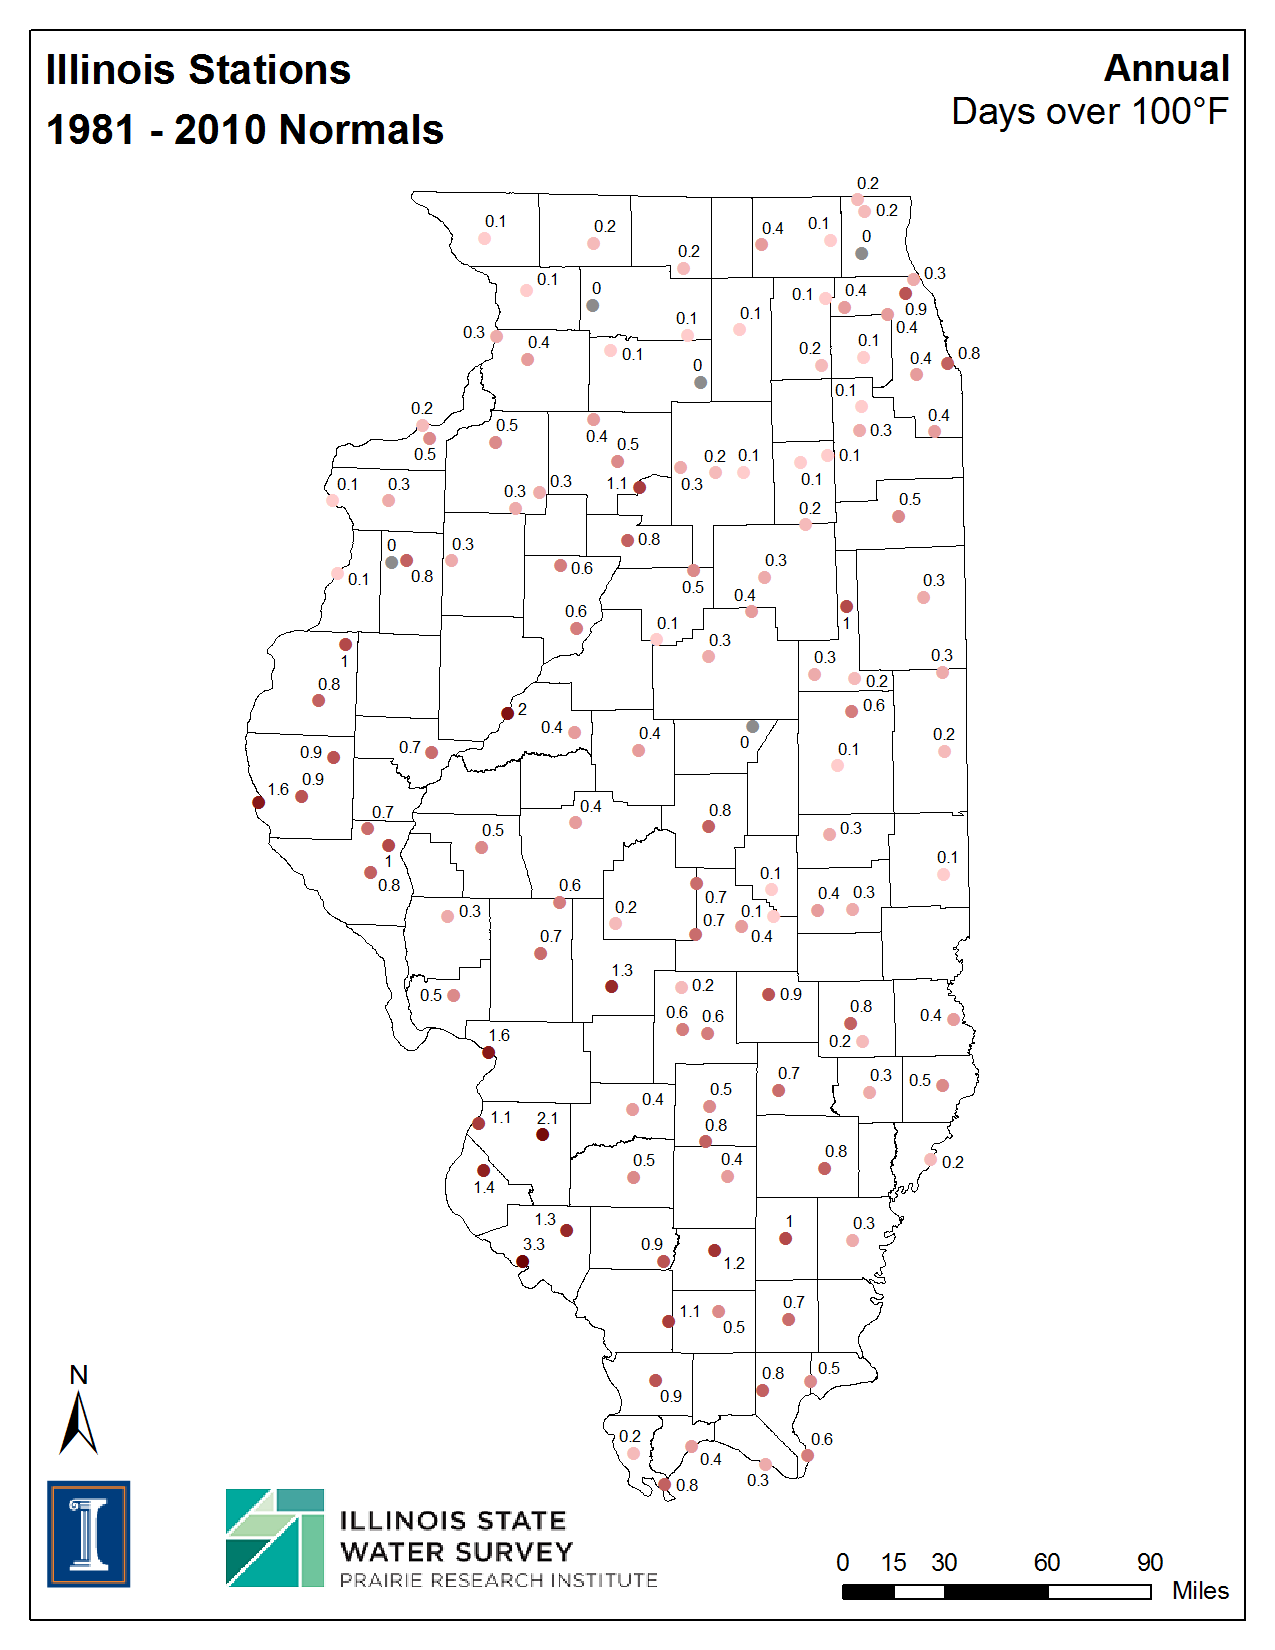
| Days Above 100 degrees F | ||||||
| Jan | Feb | Mar | Apr | May | Jun | |
| Jul | Aug | Sep | Oct | Nov | Dec | Annual |
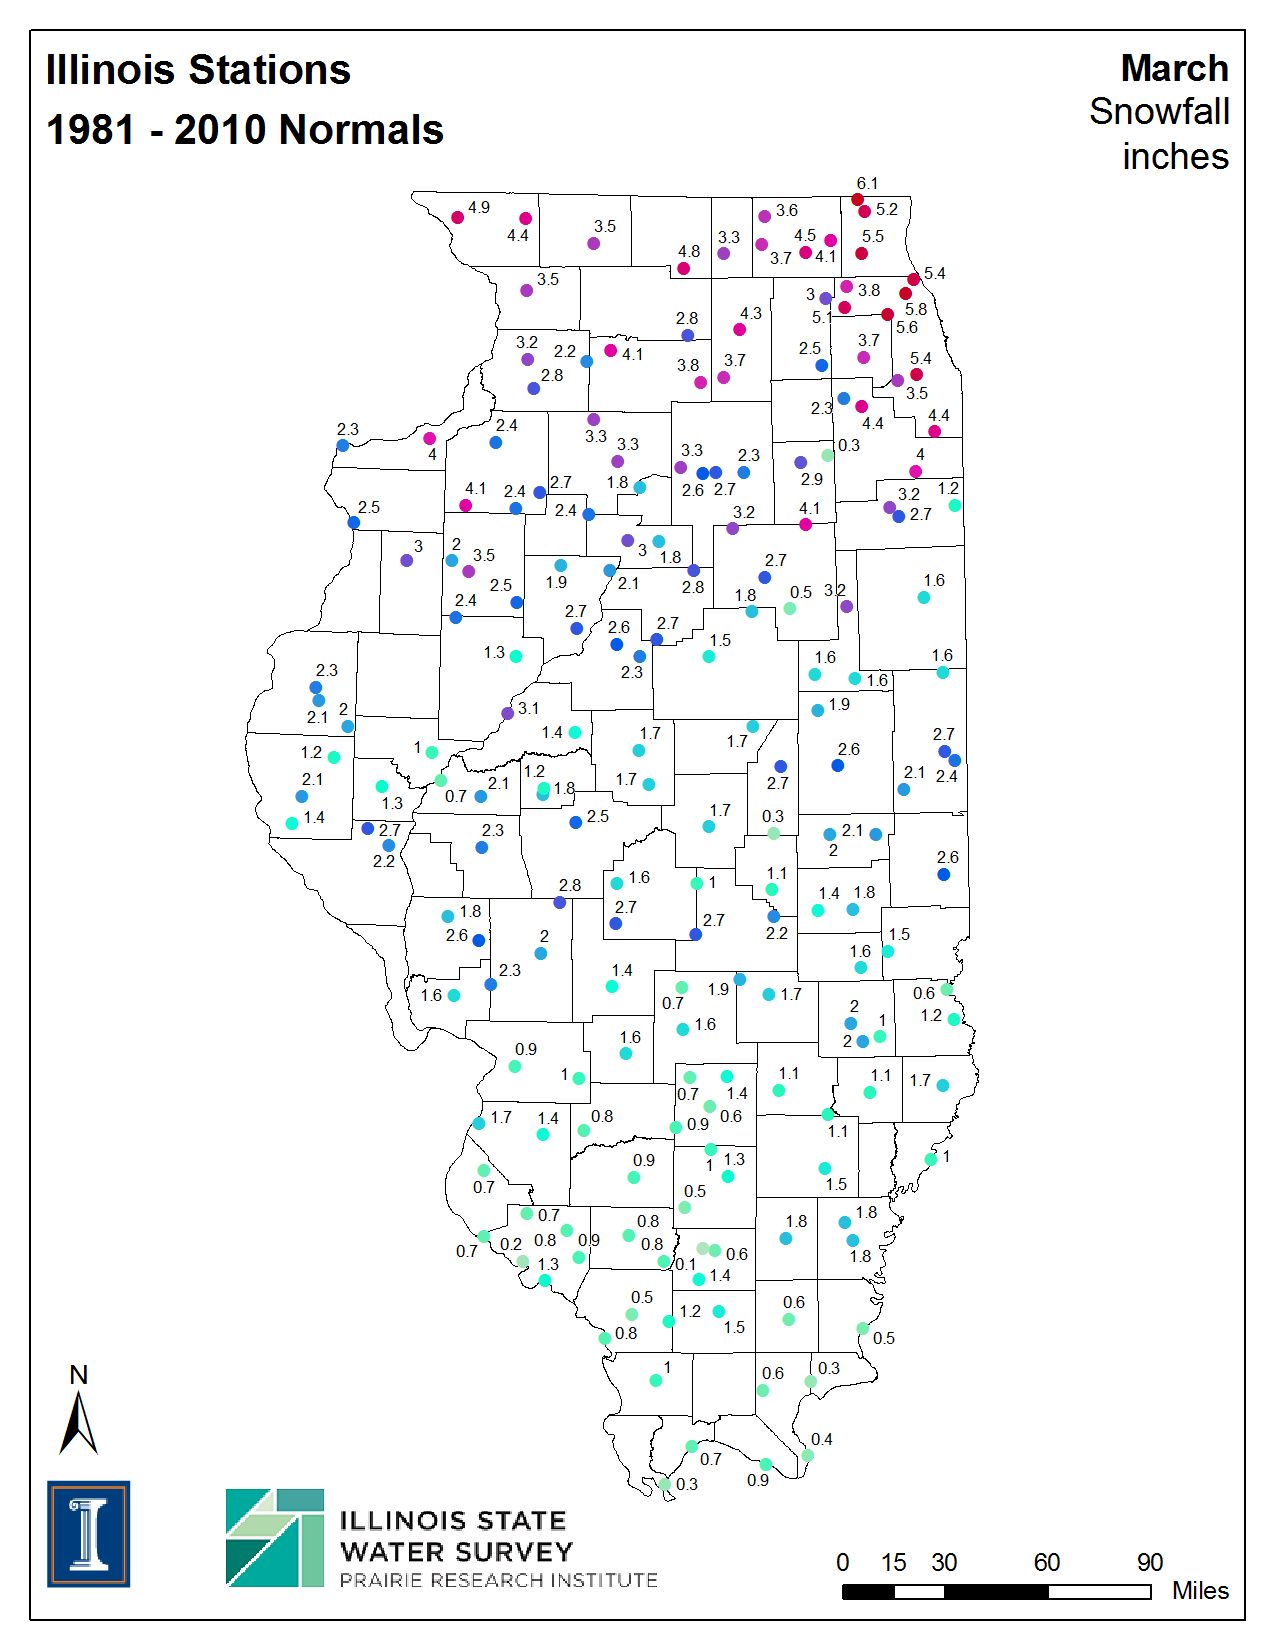
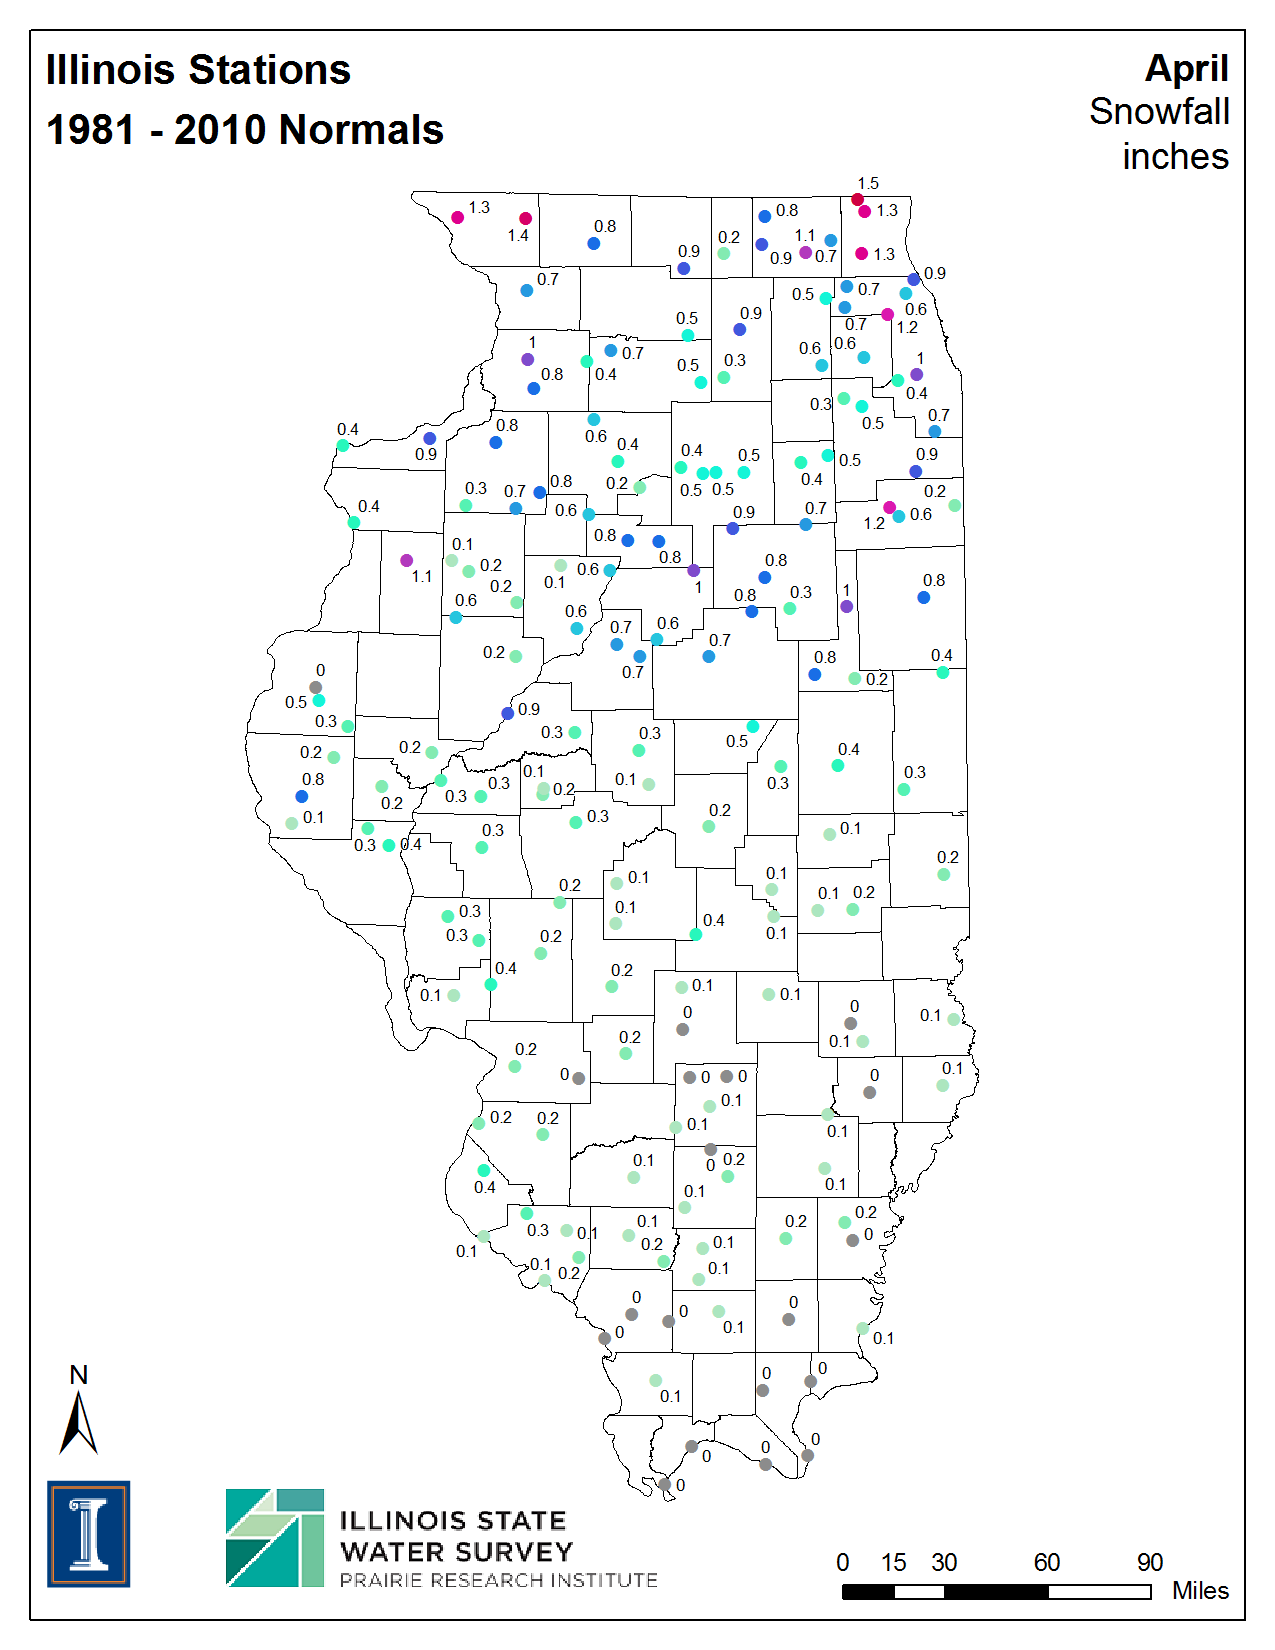
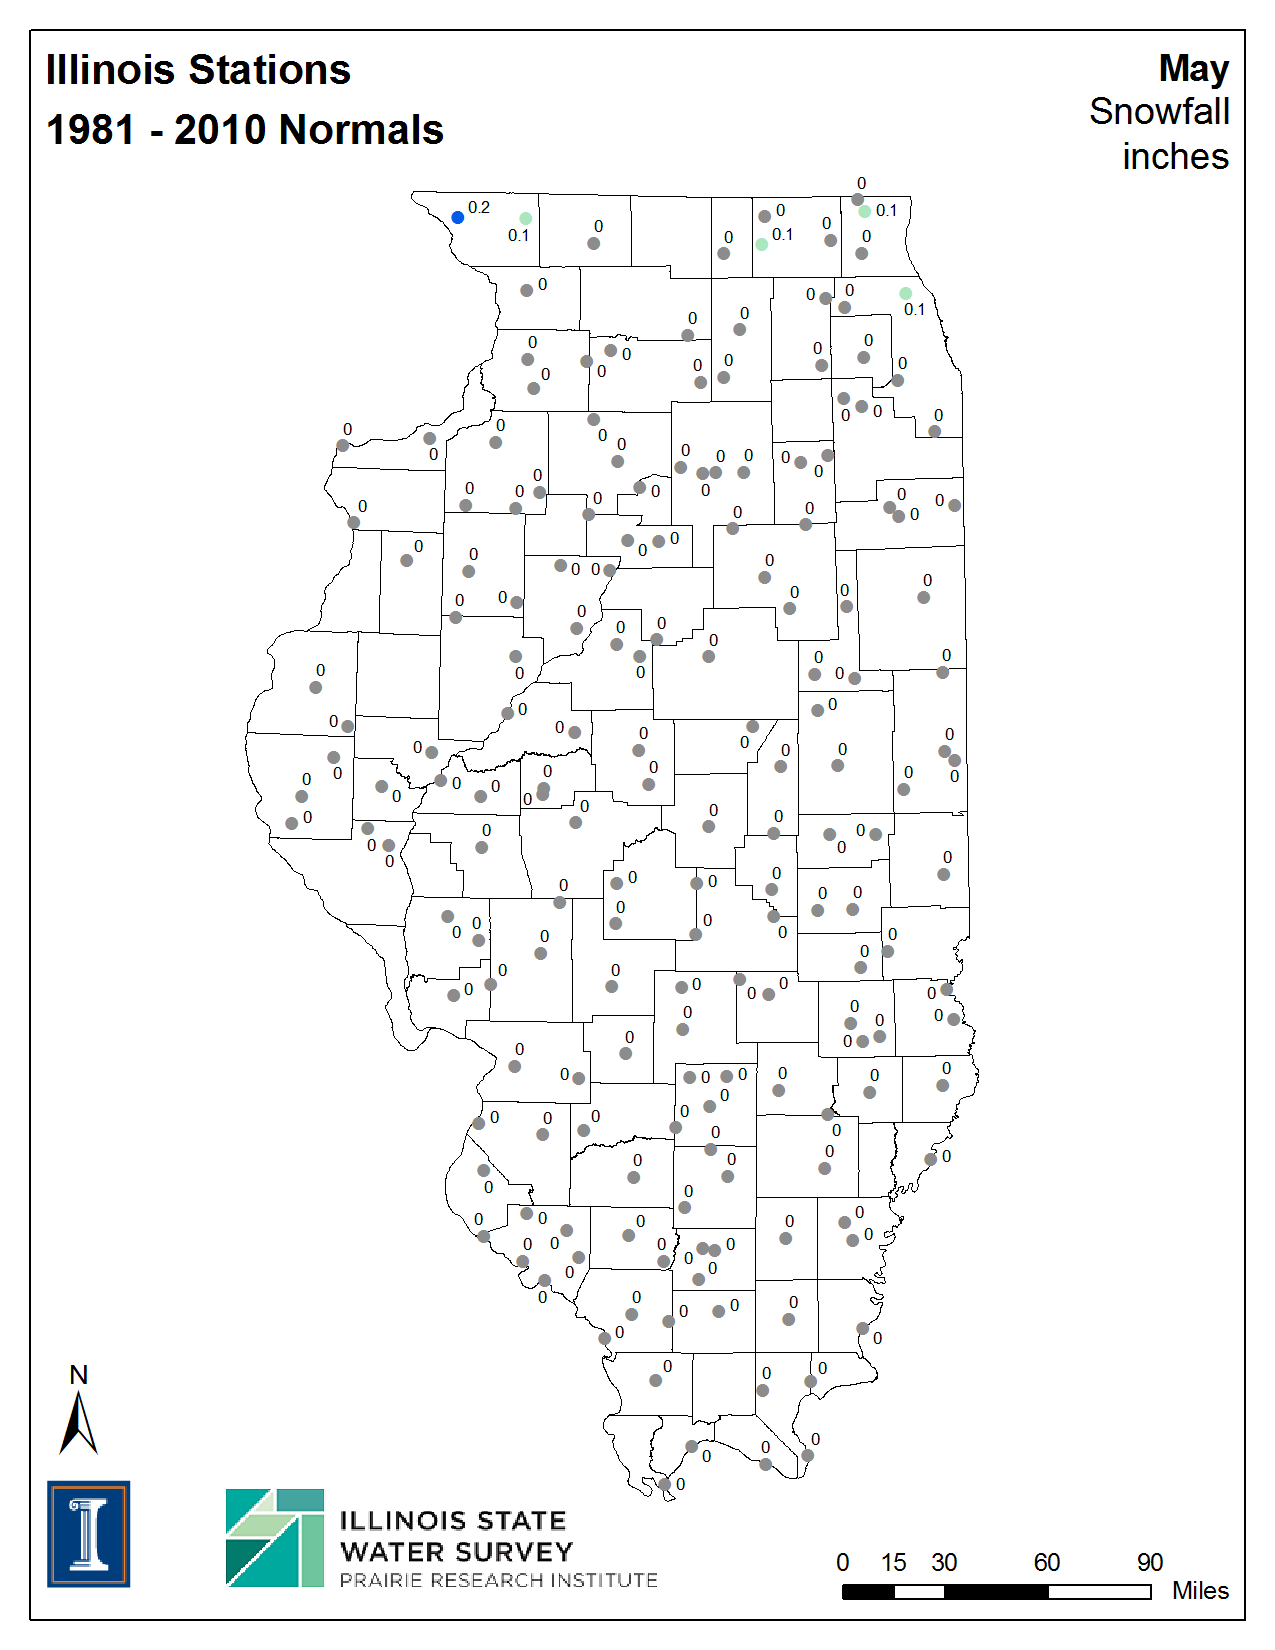
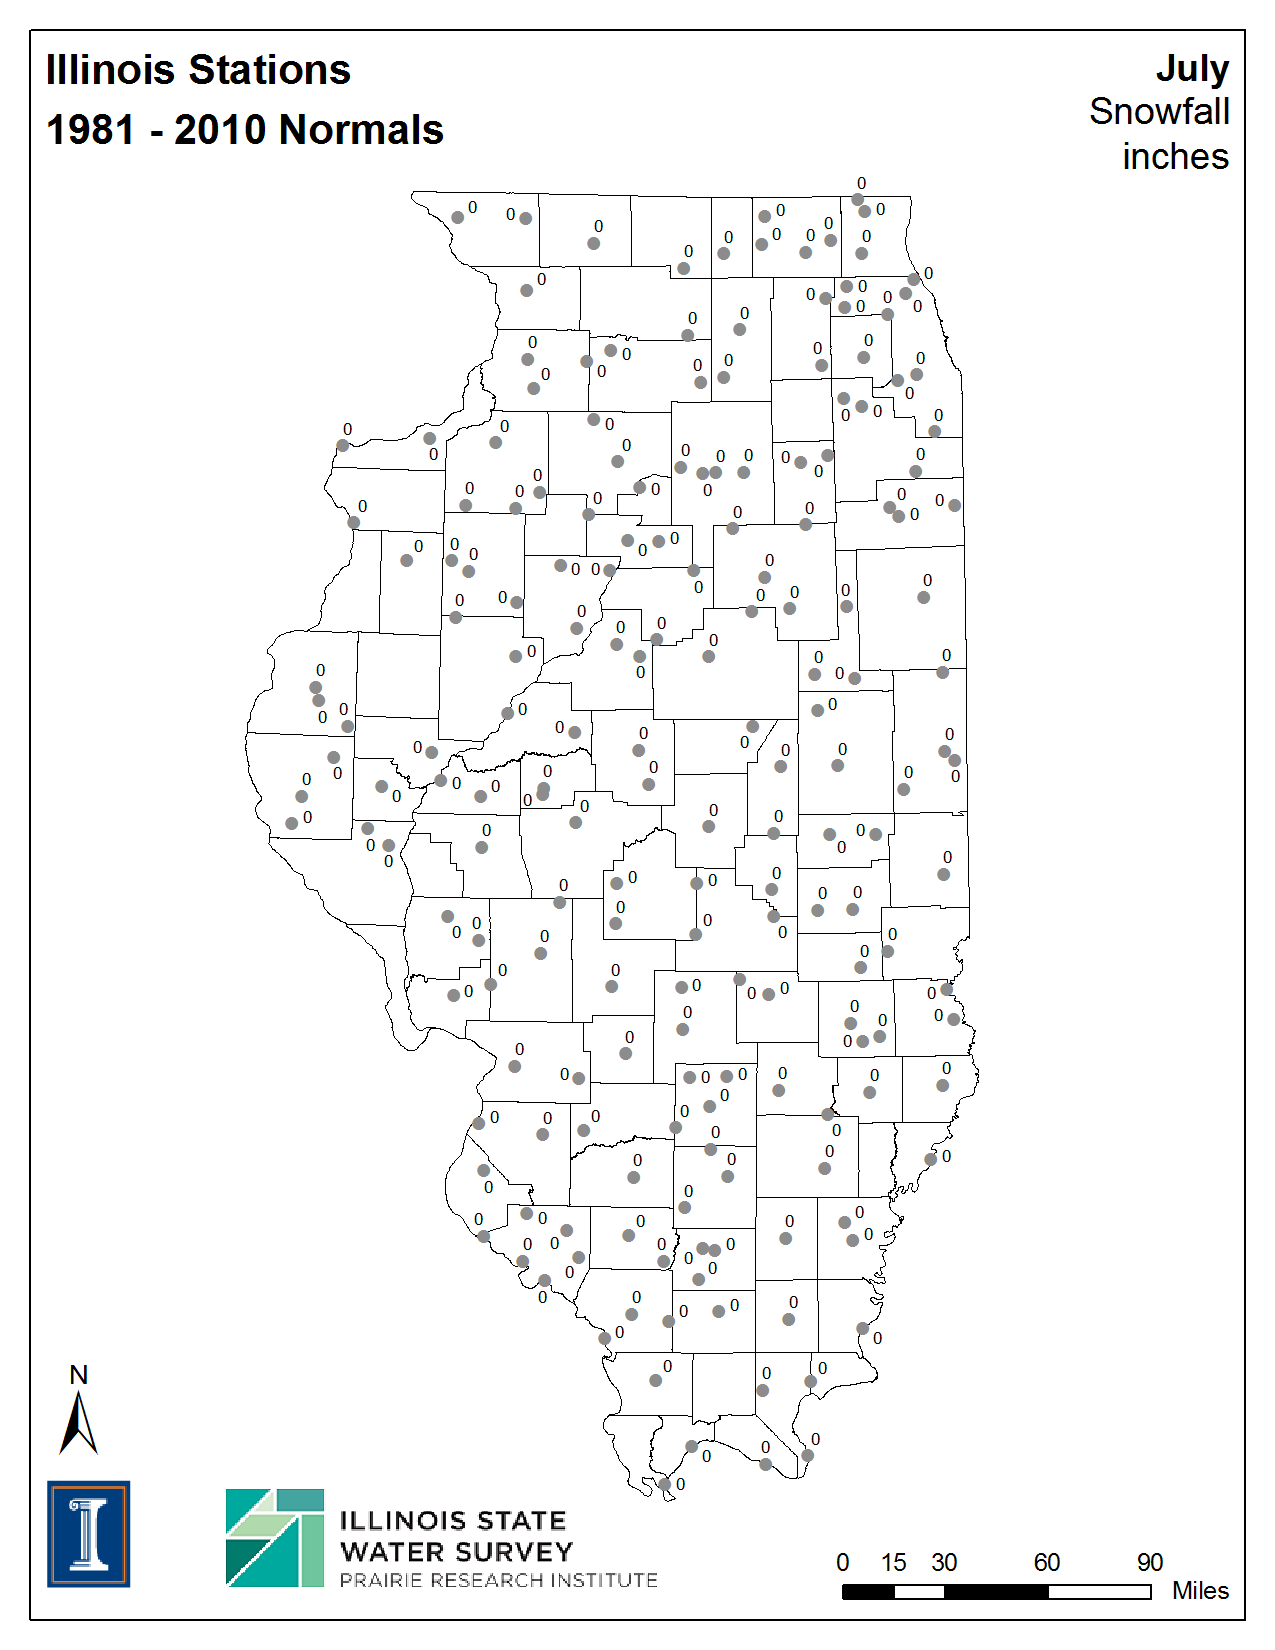
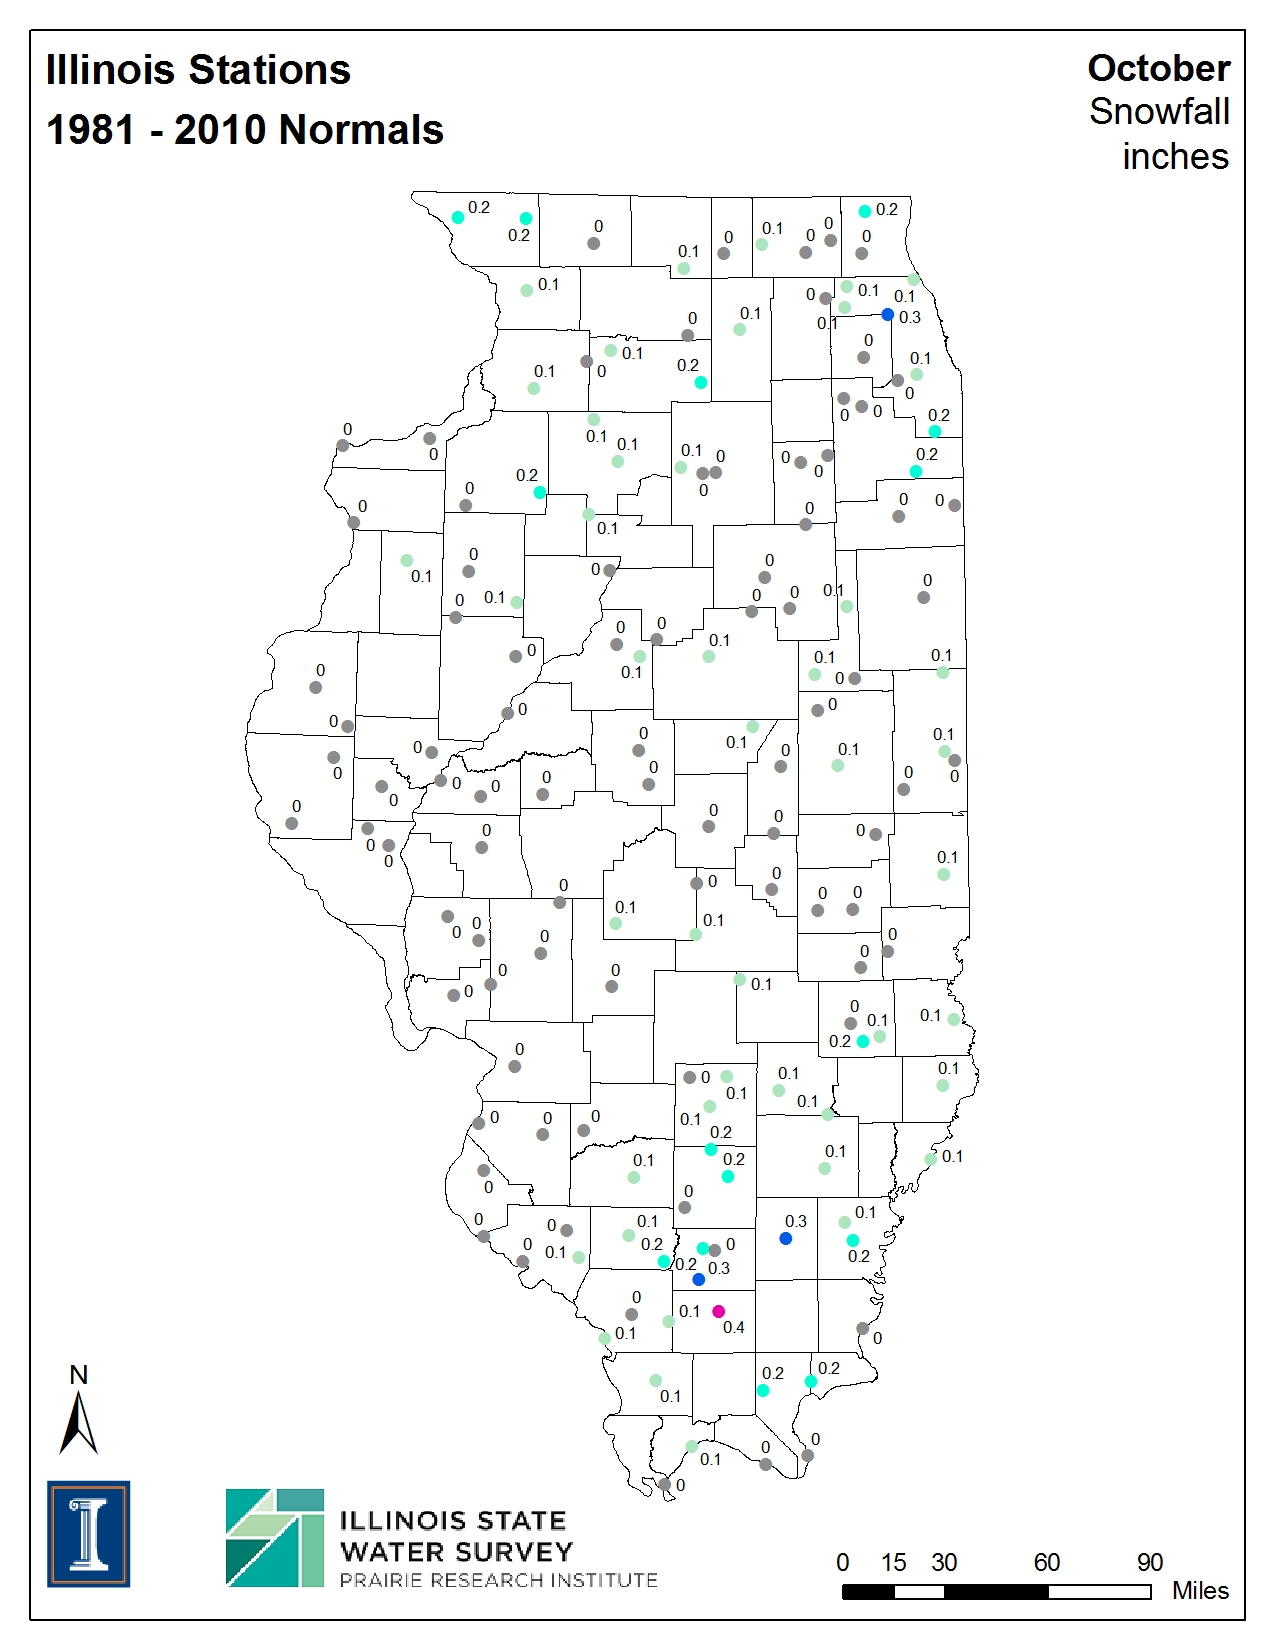
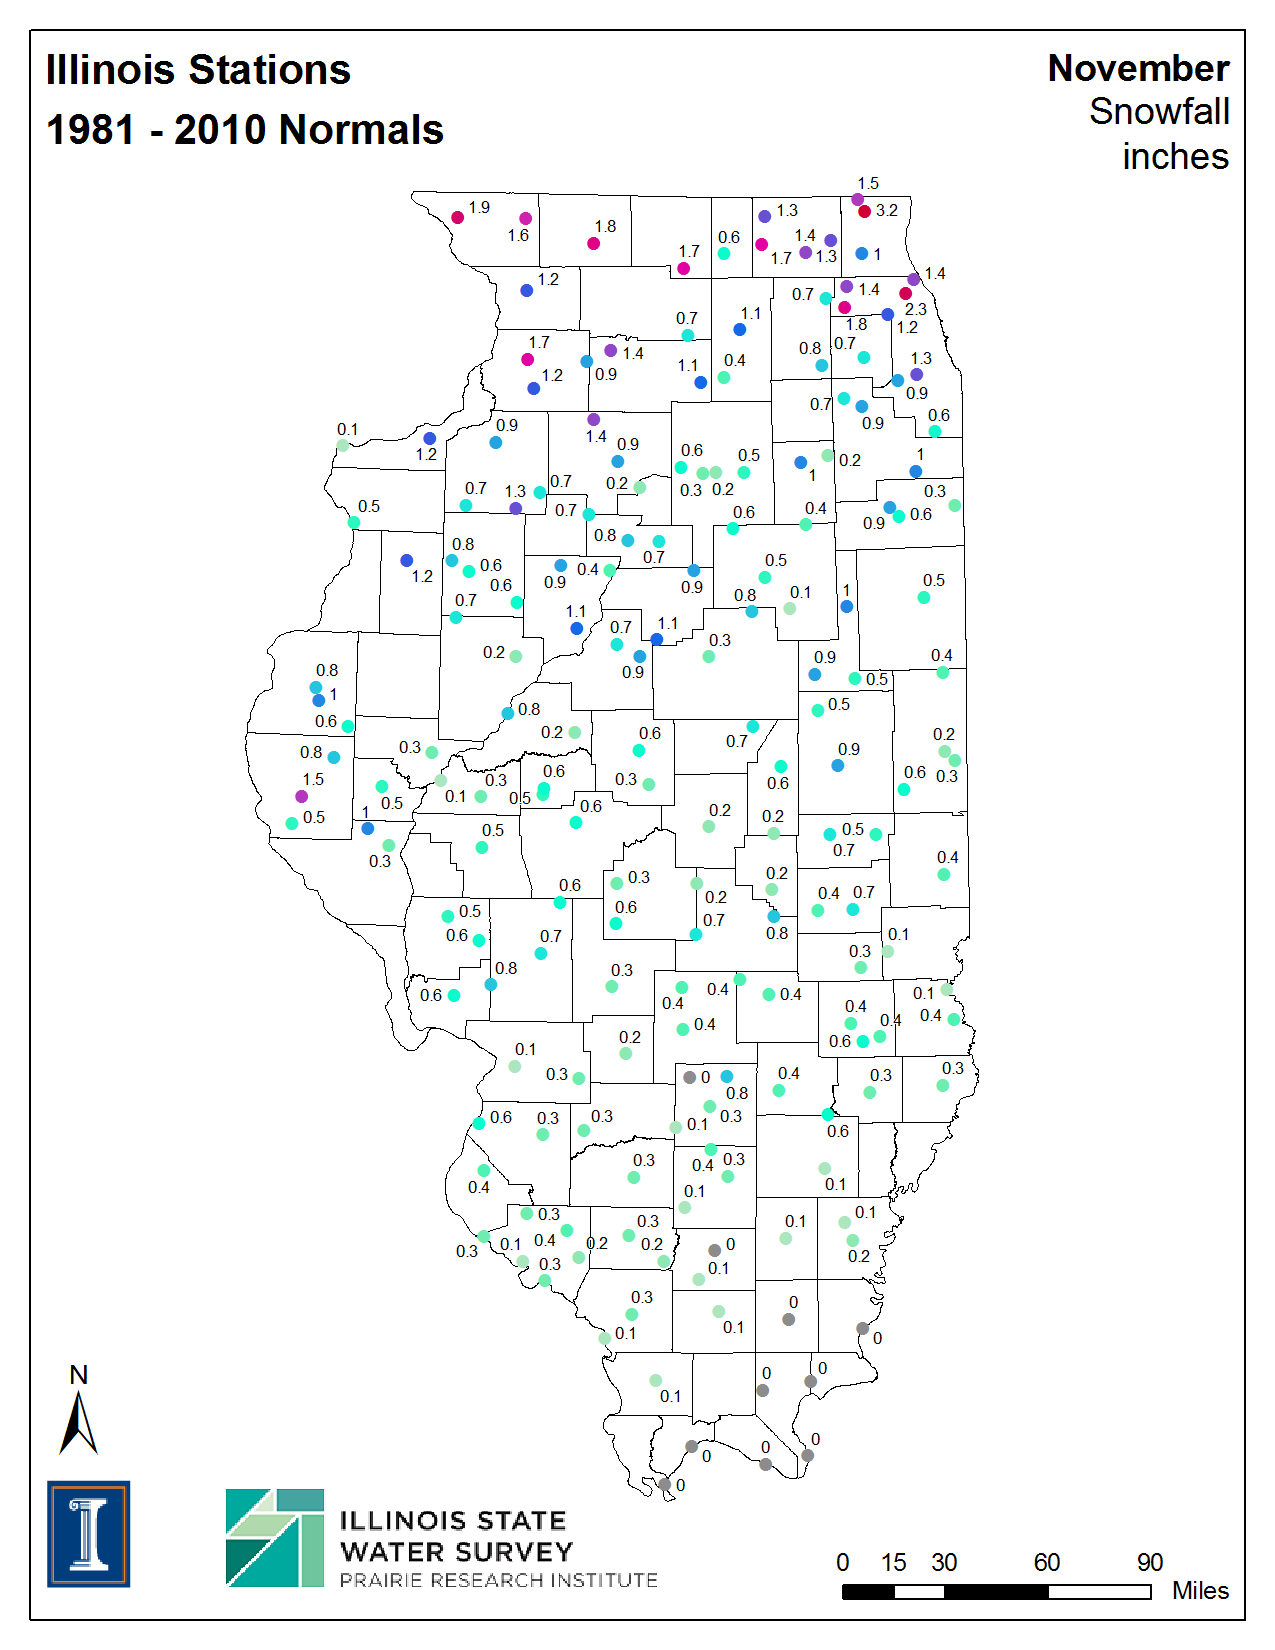
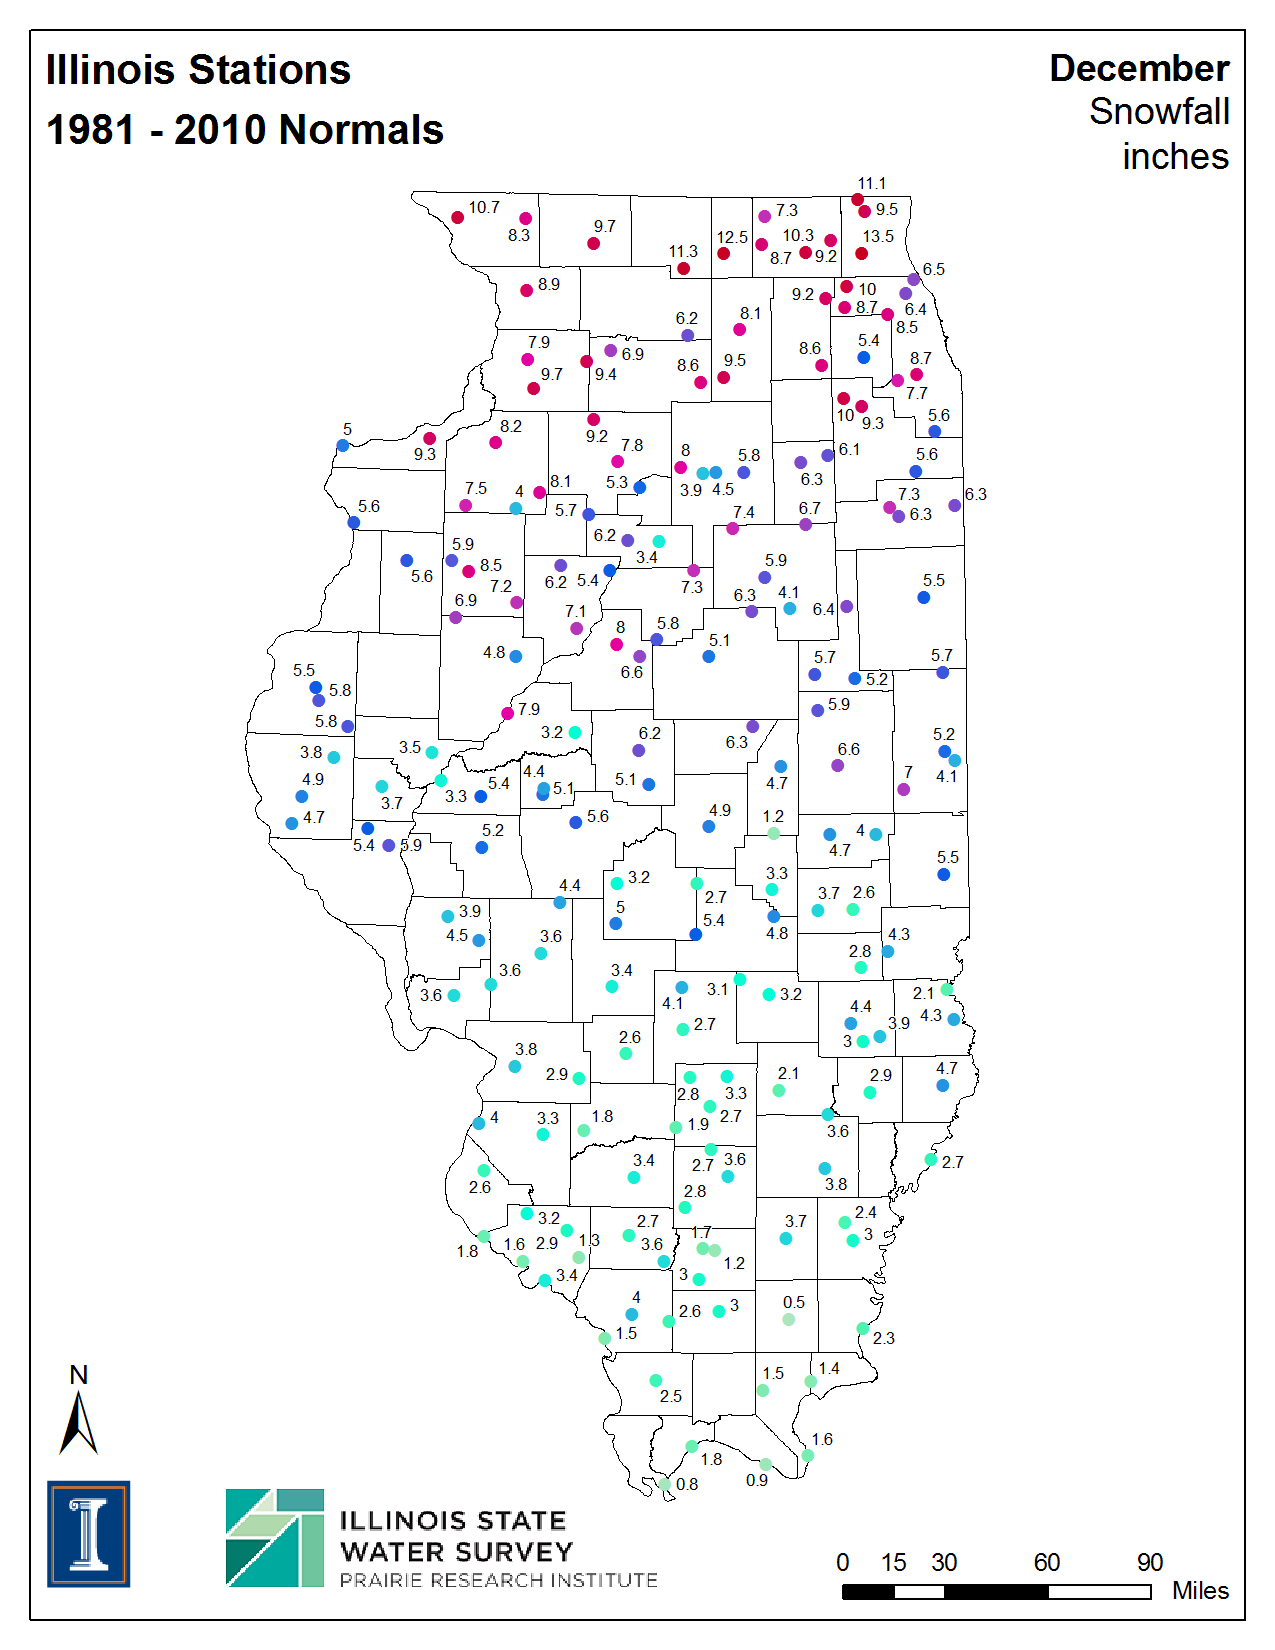
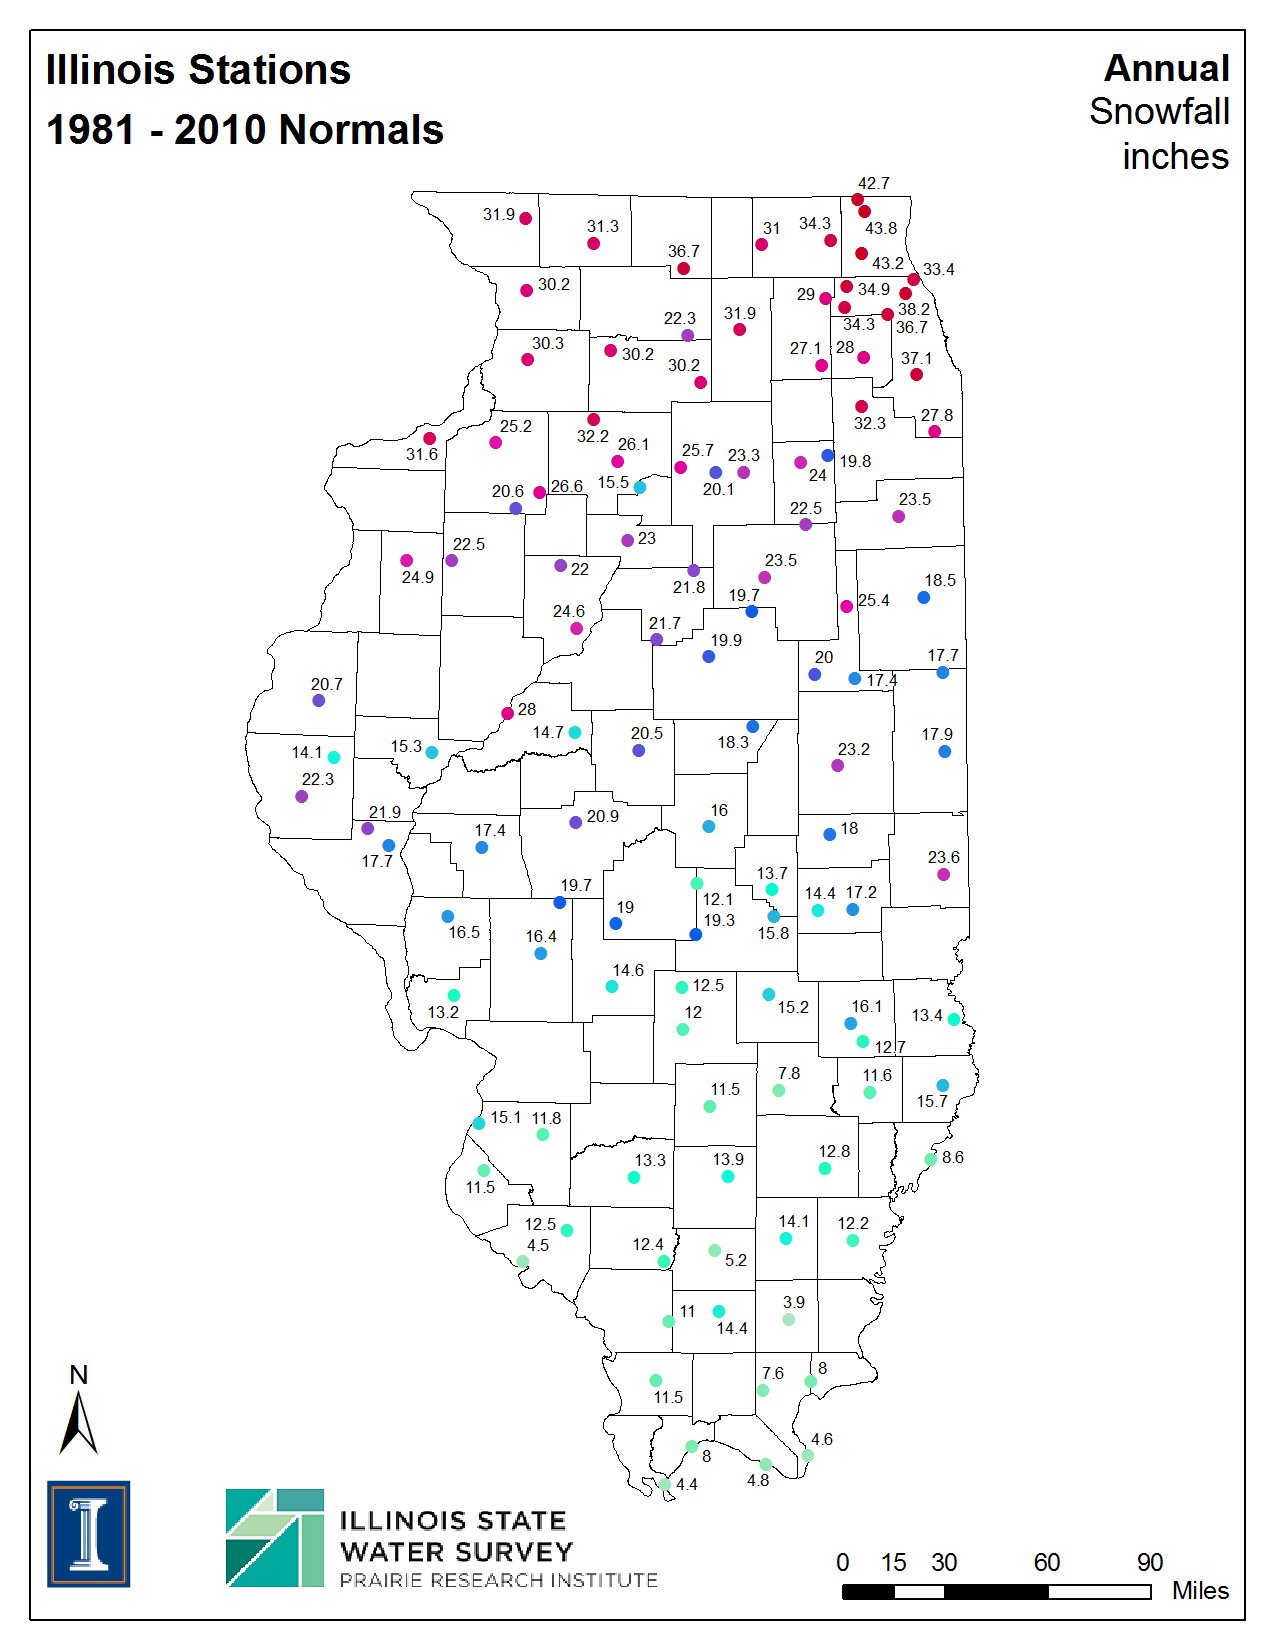
| Snowfall (inches) | ||||||
| Jan | Feb | Mar | Apr | May | Jun | |
| Jul | Aug | Sep | Oct | Nov | Dec | Annual |
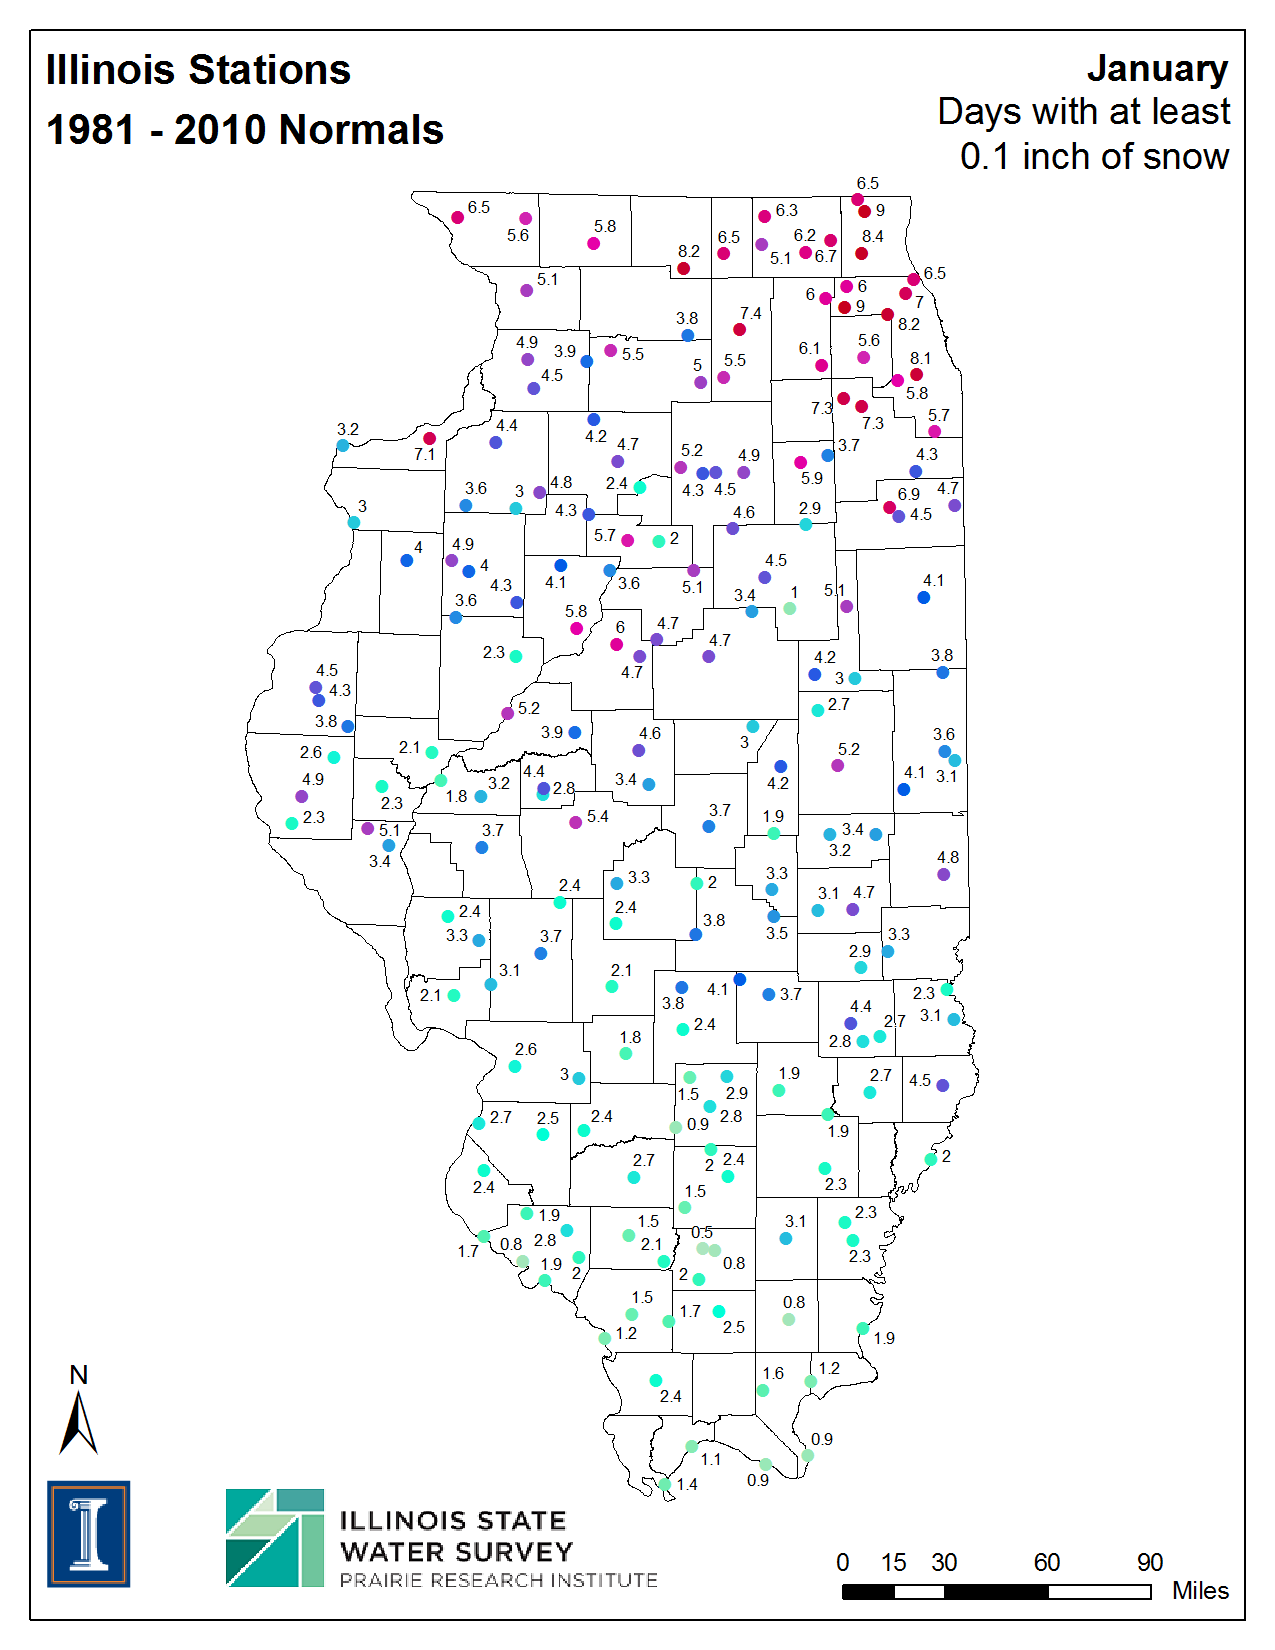
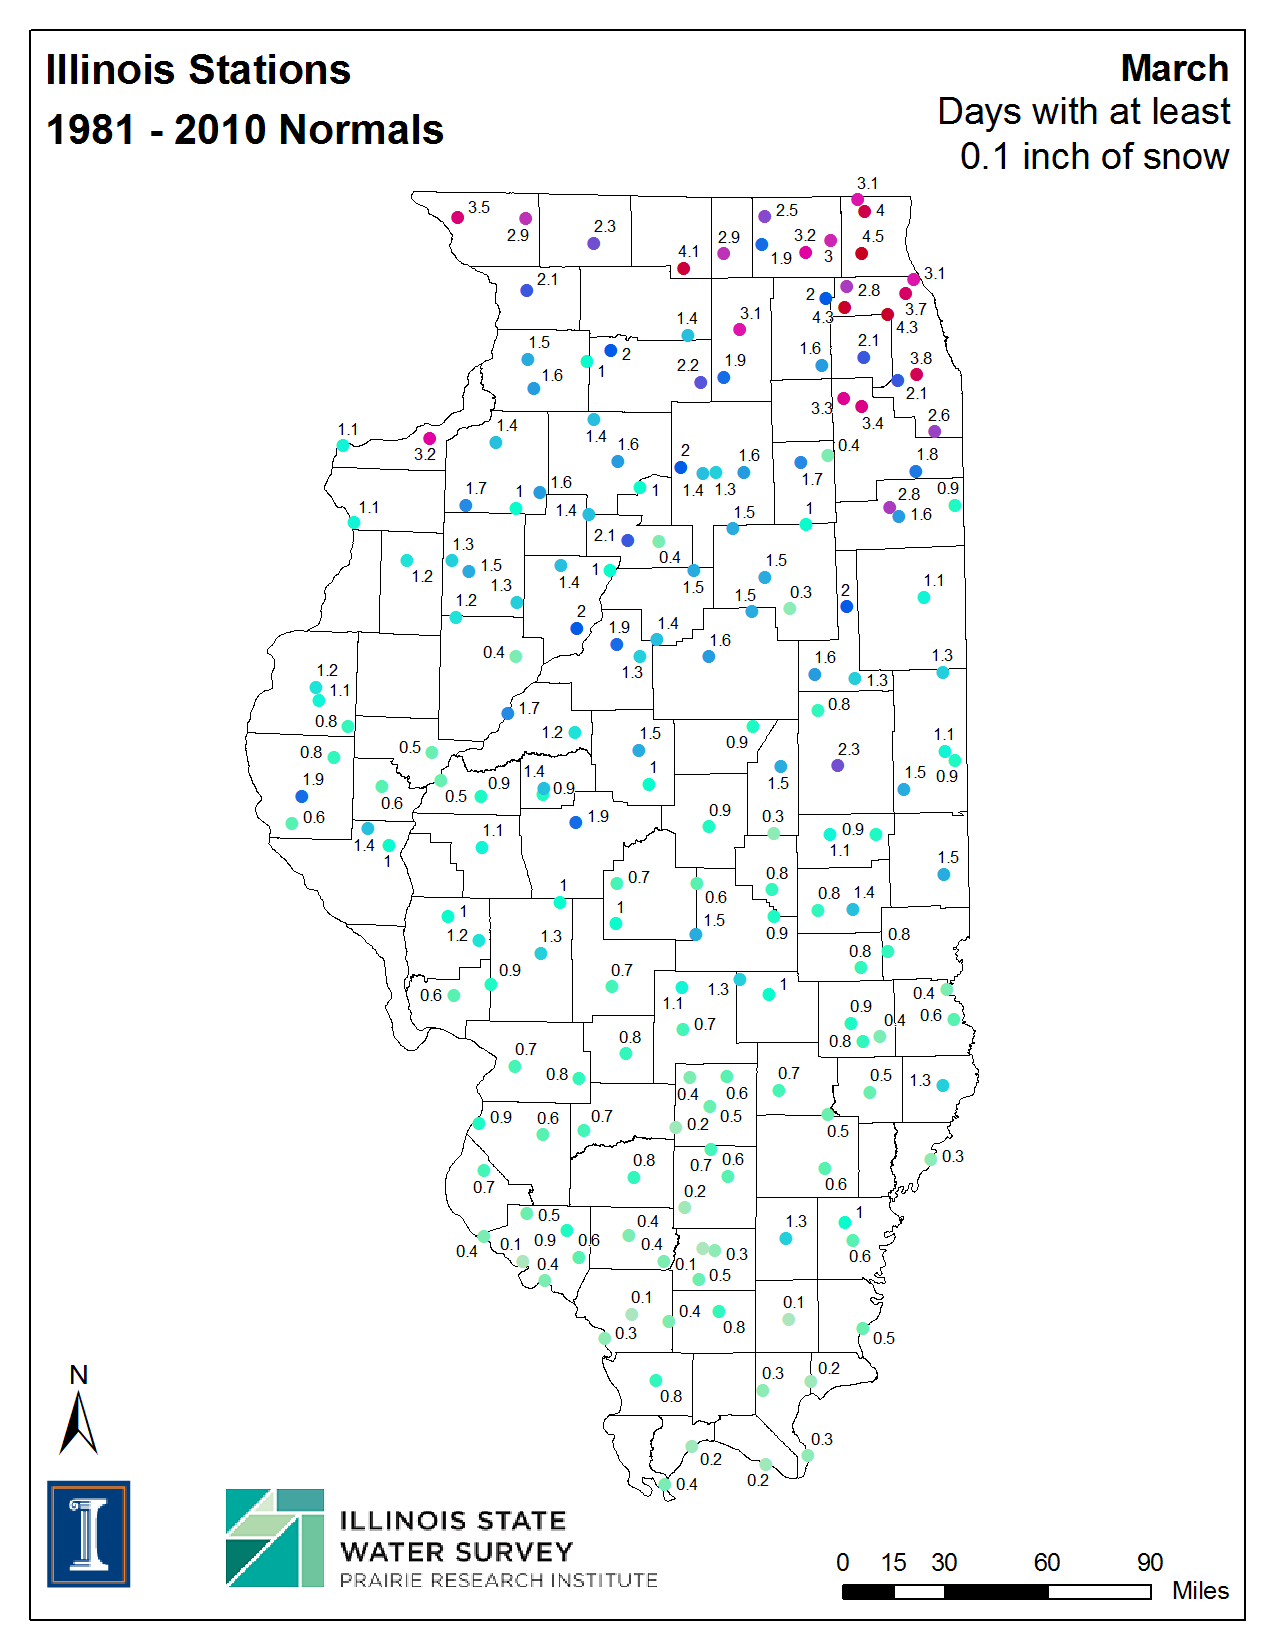
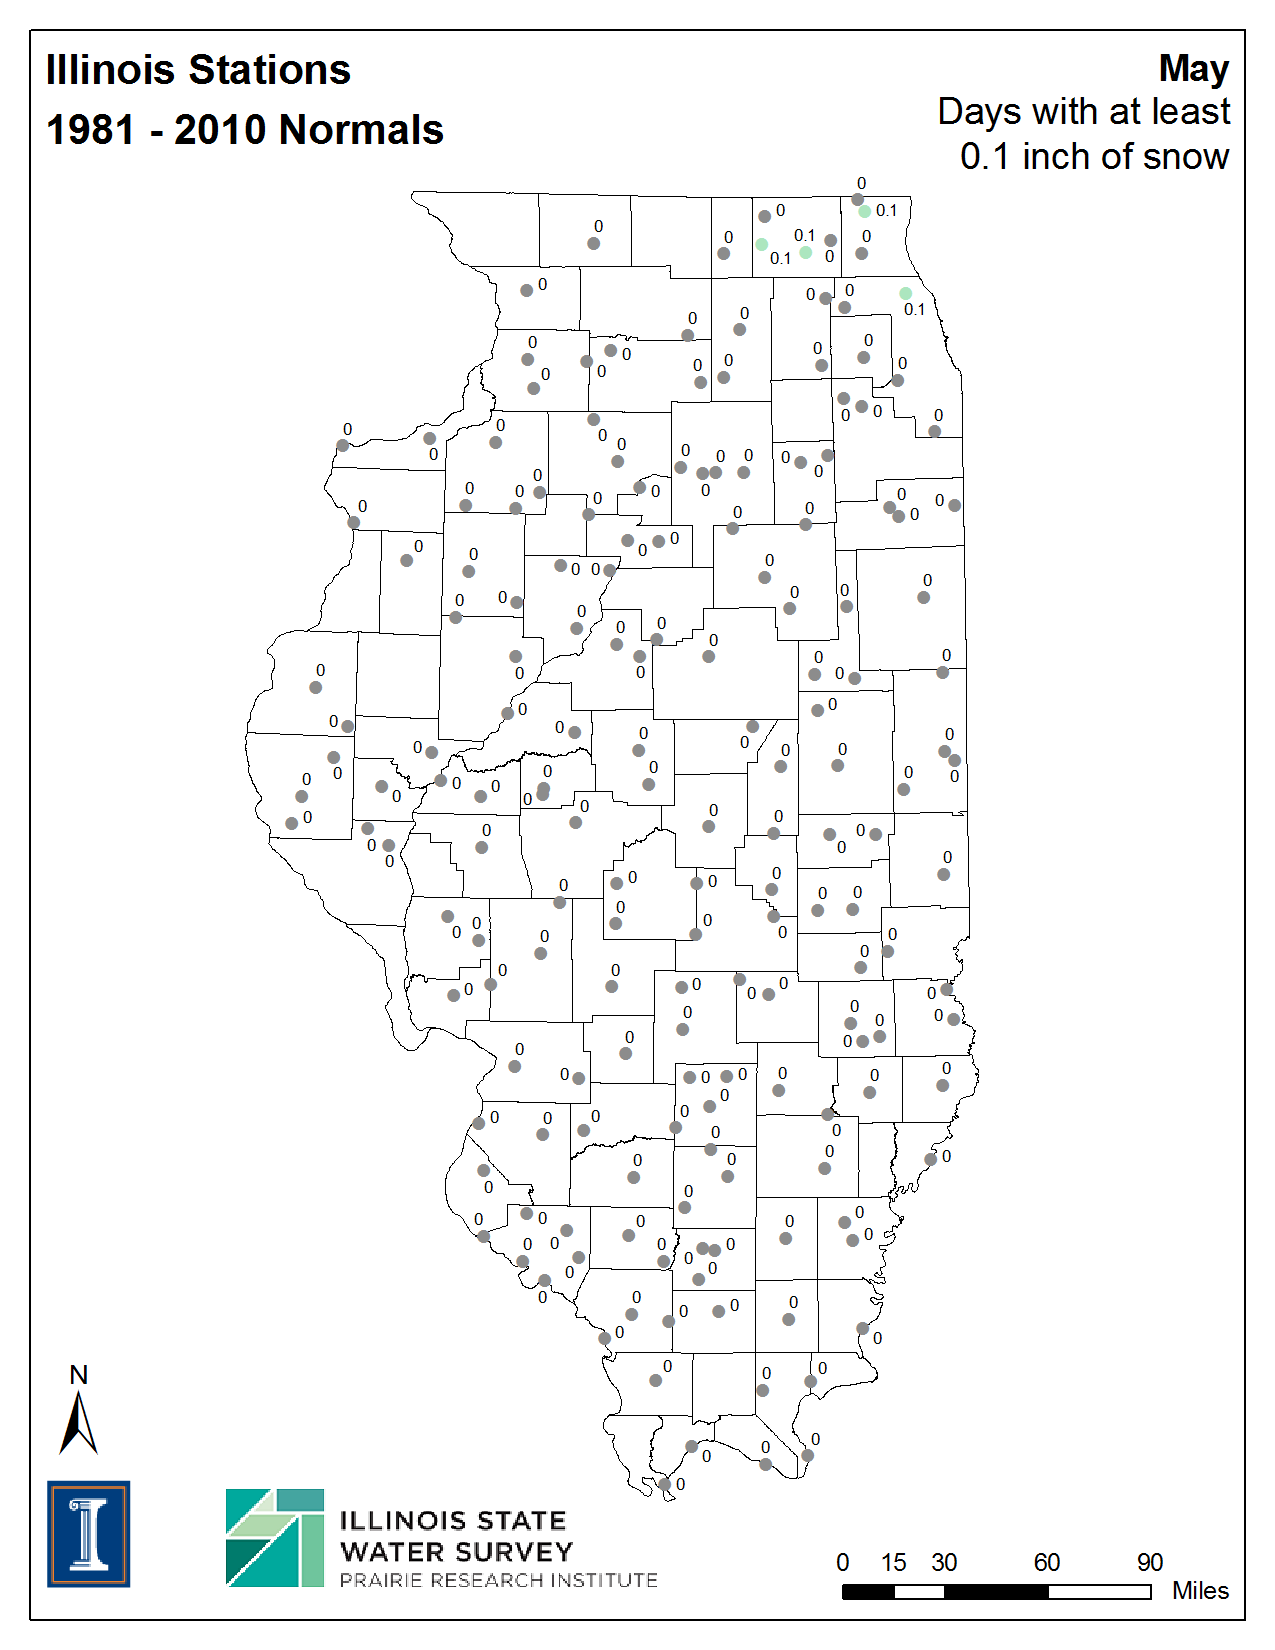
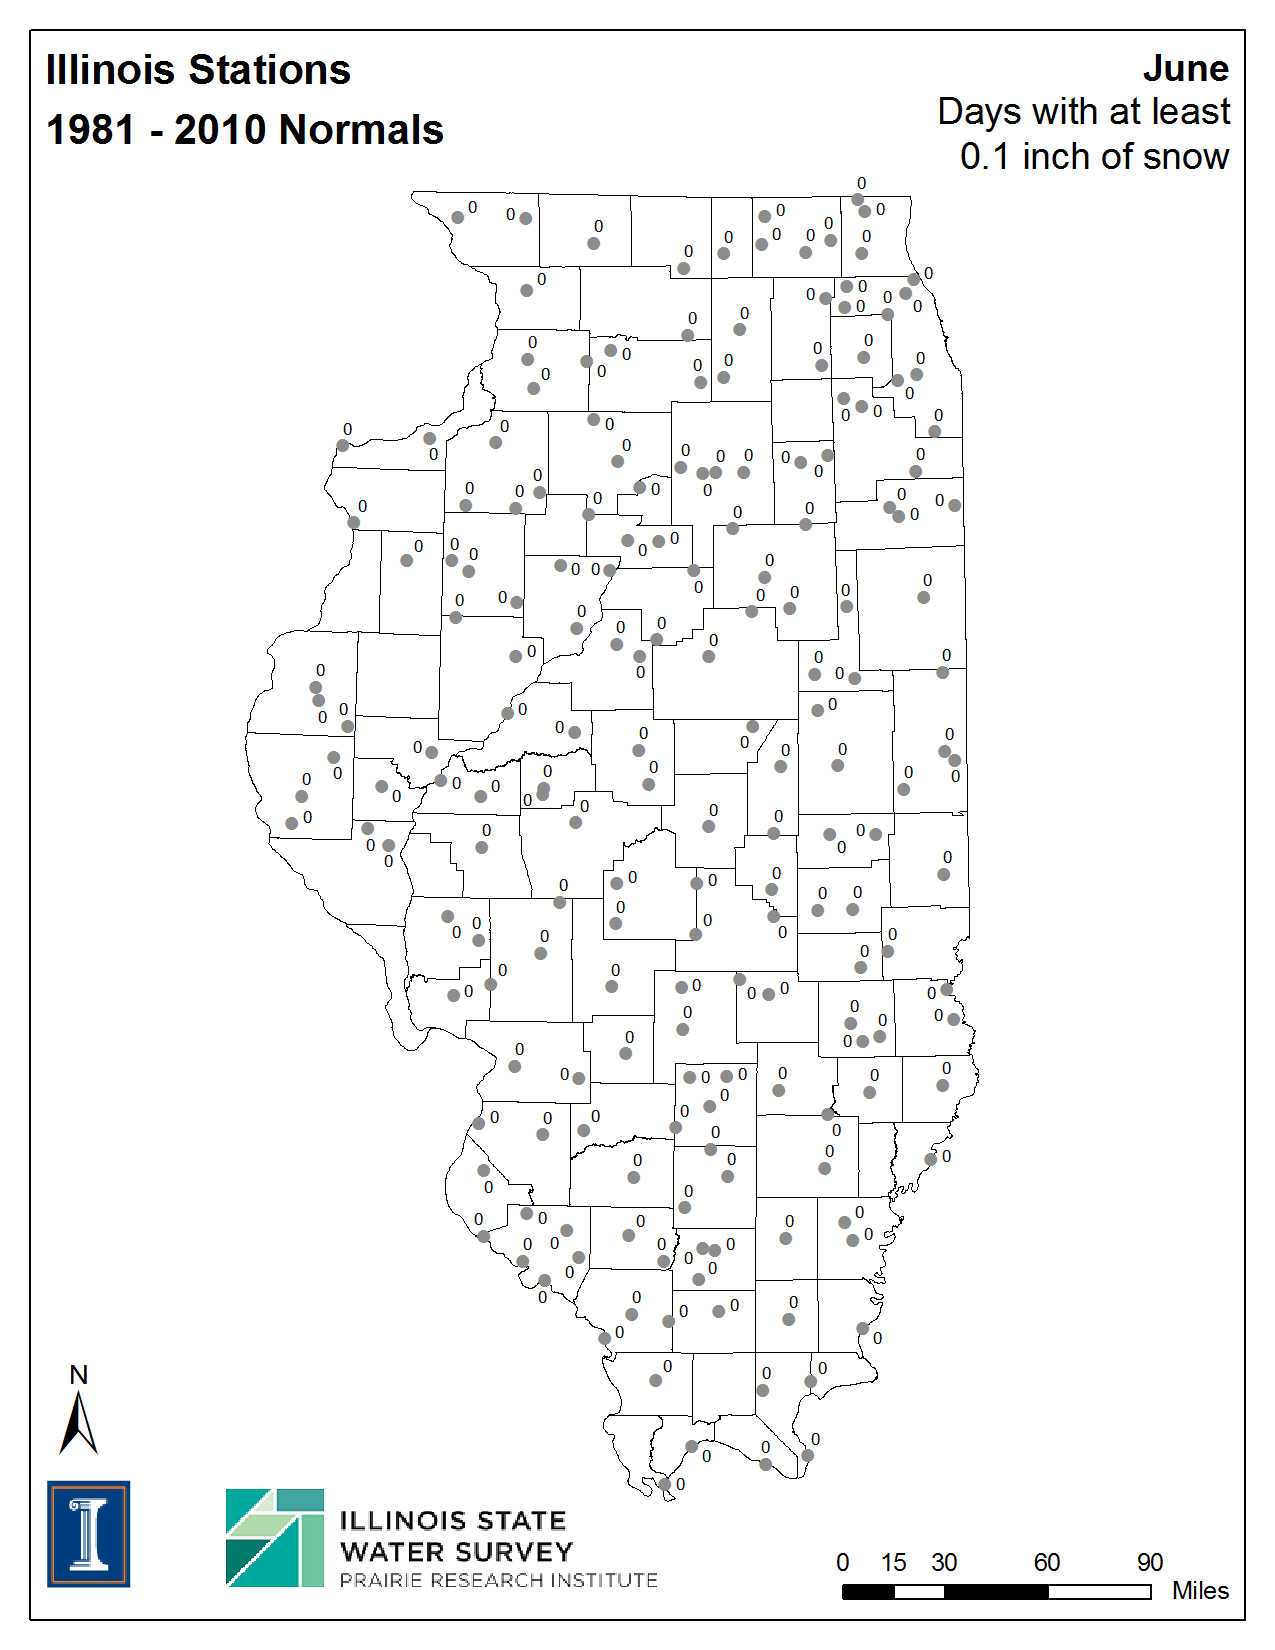
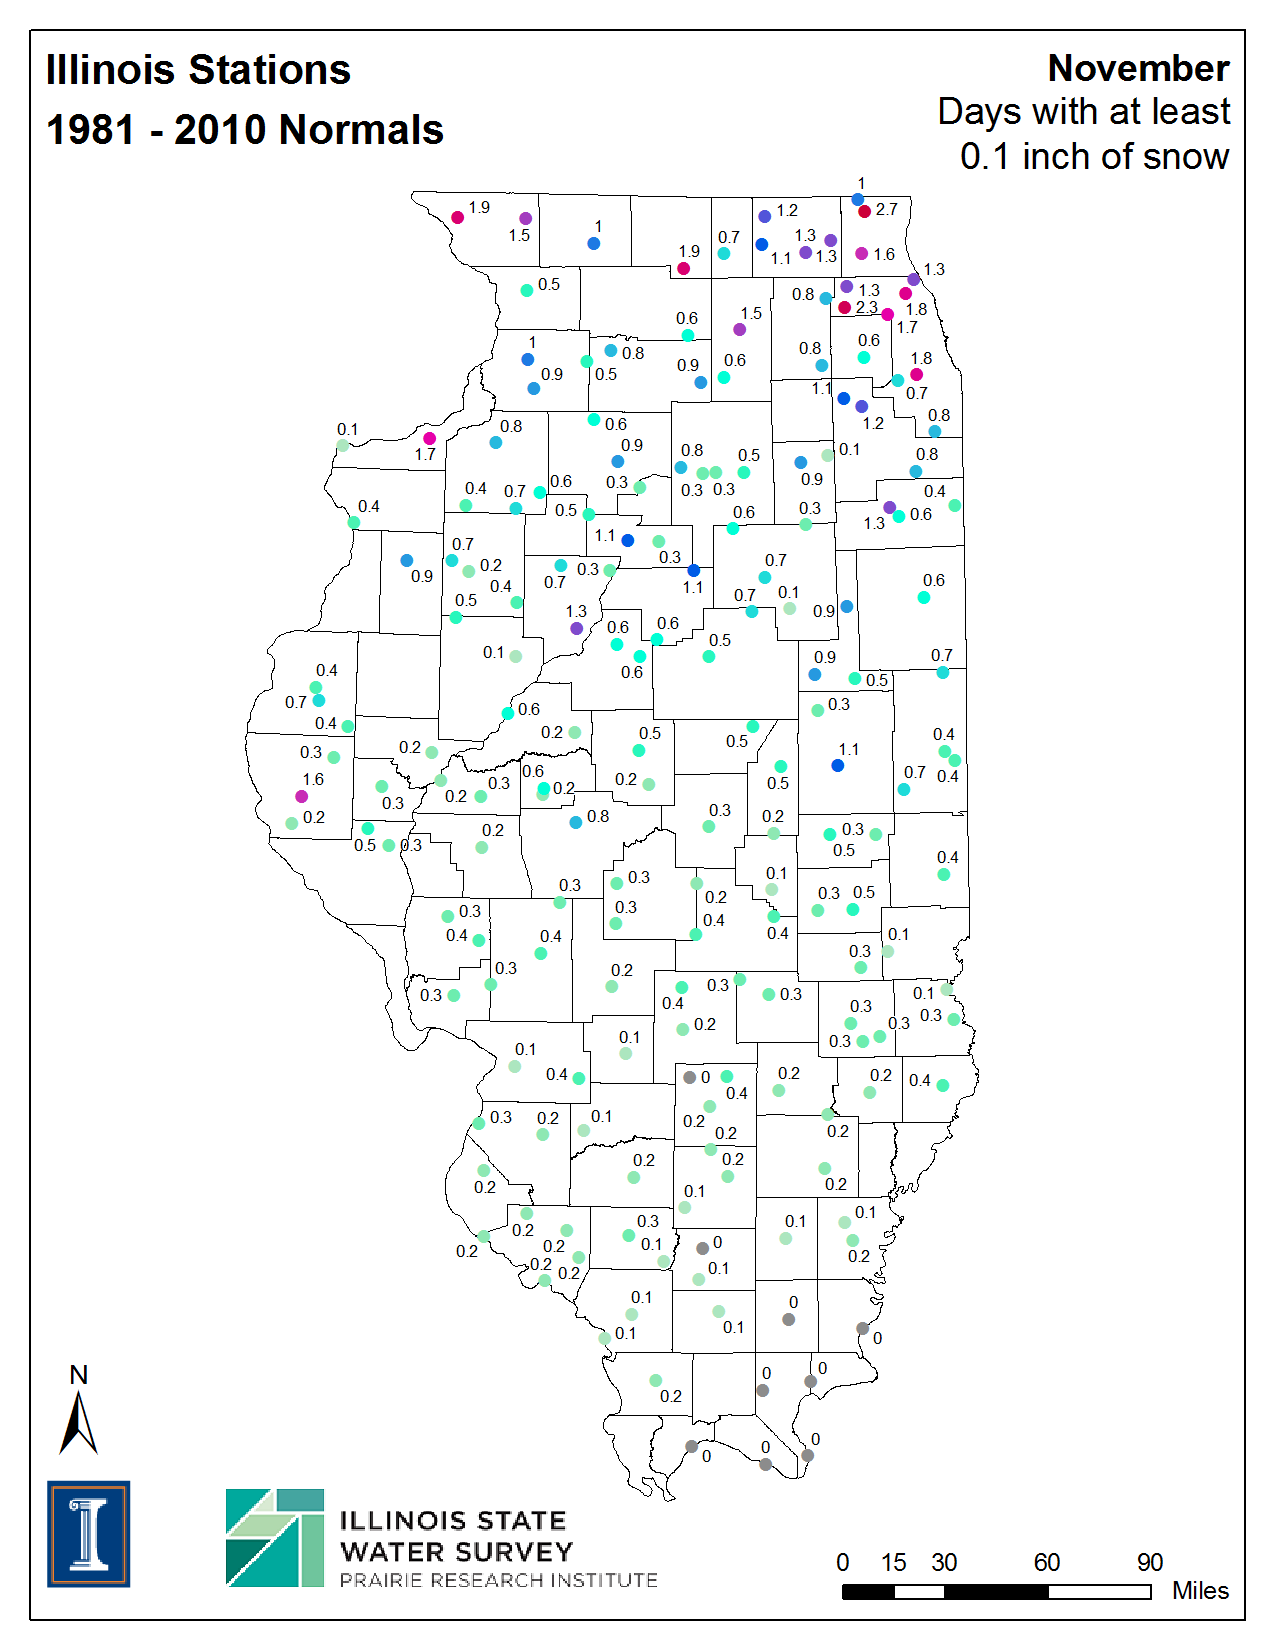
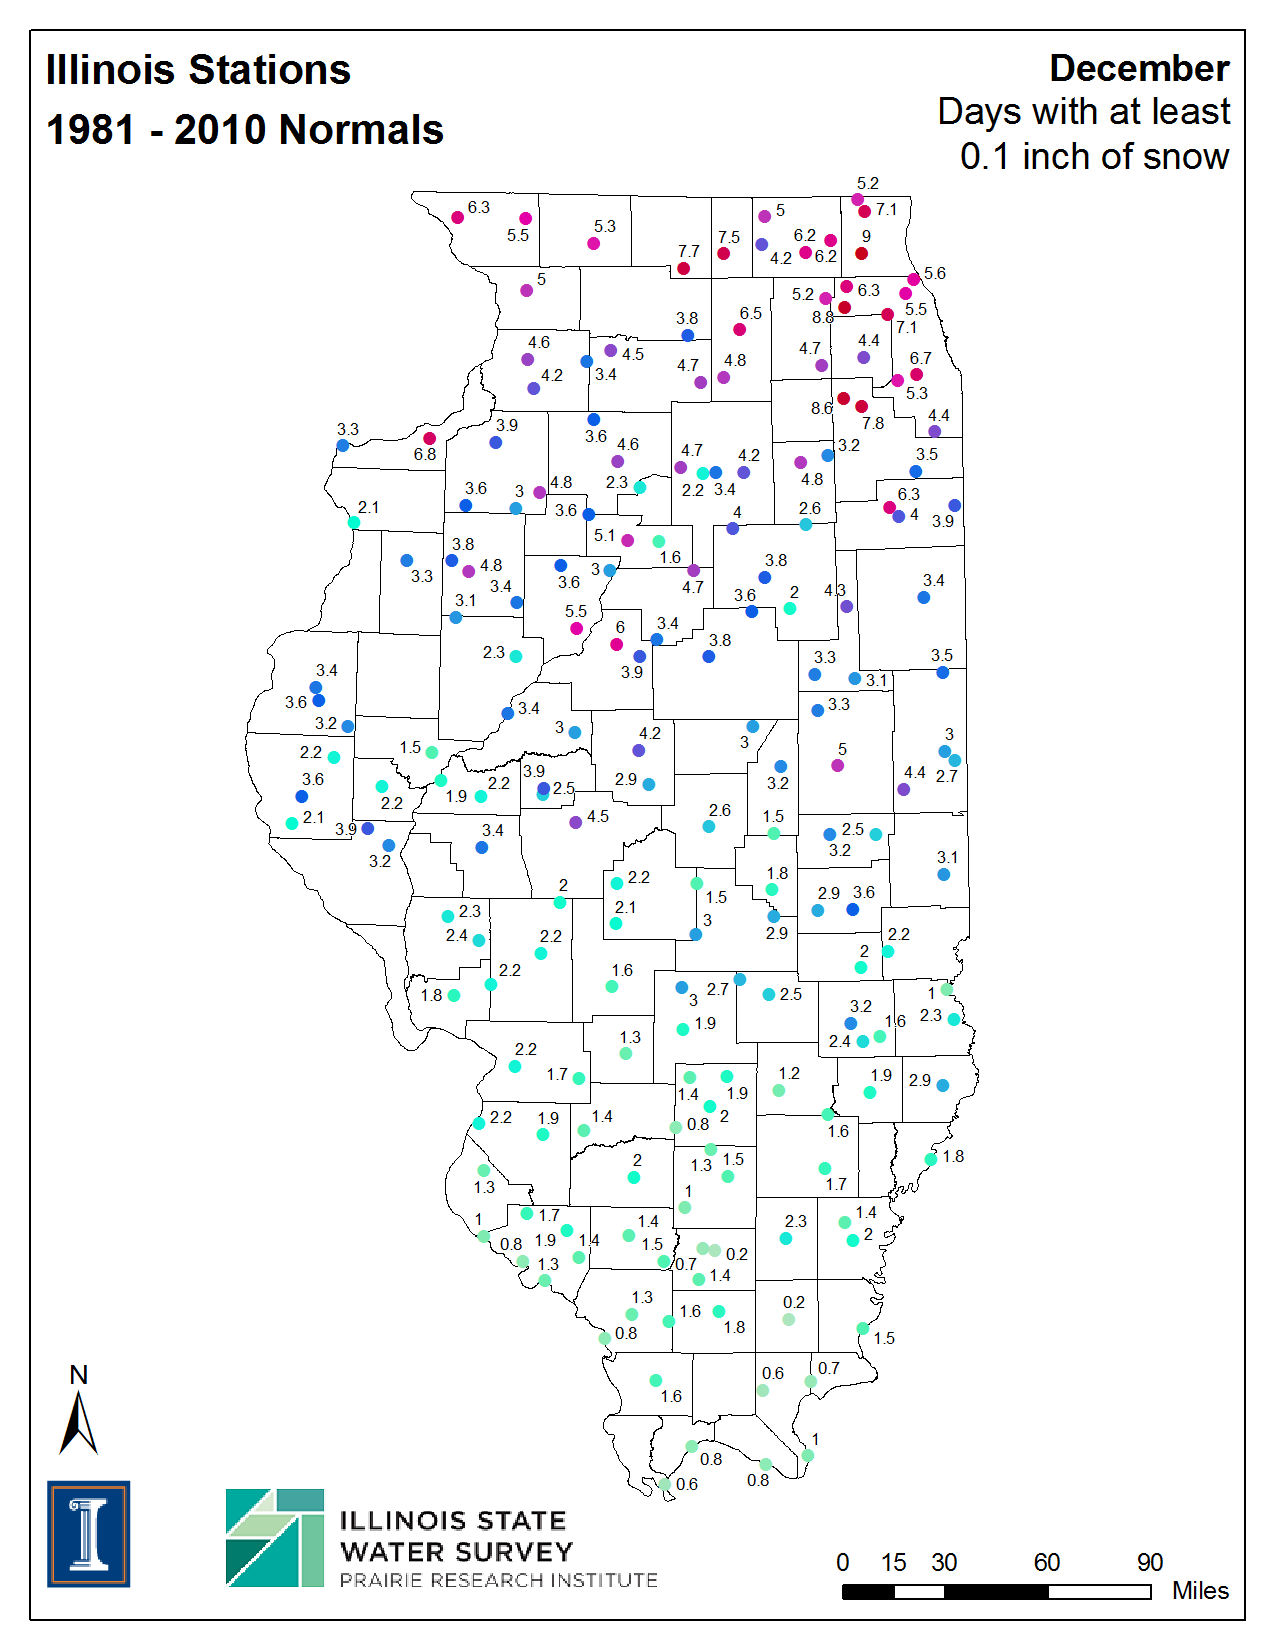
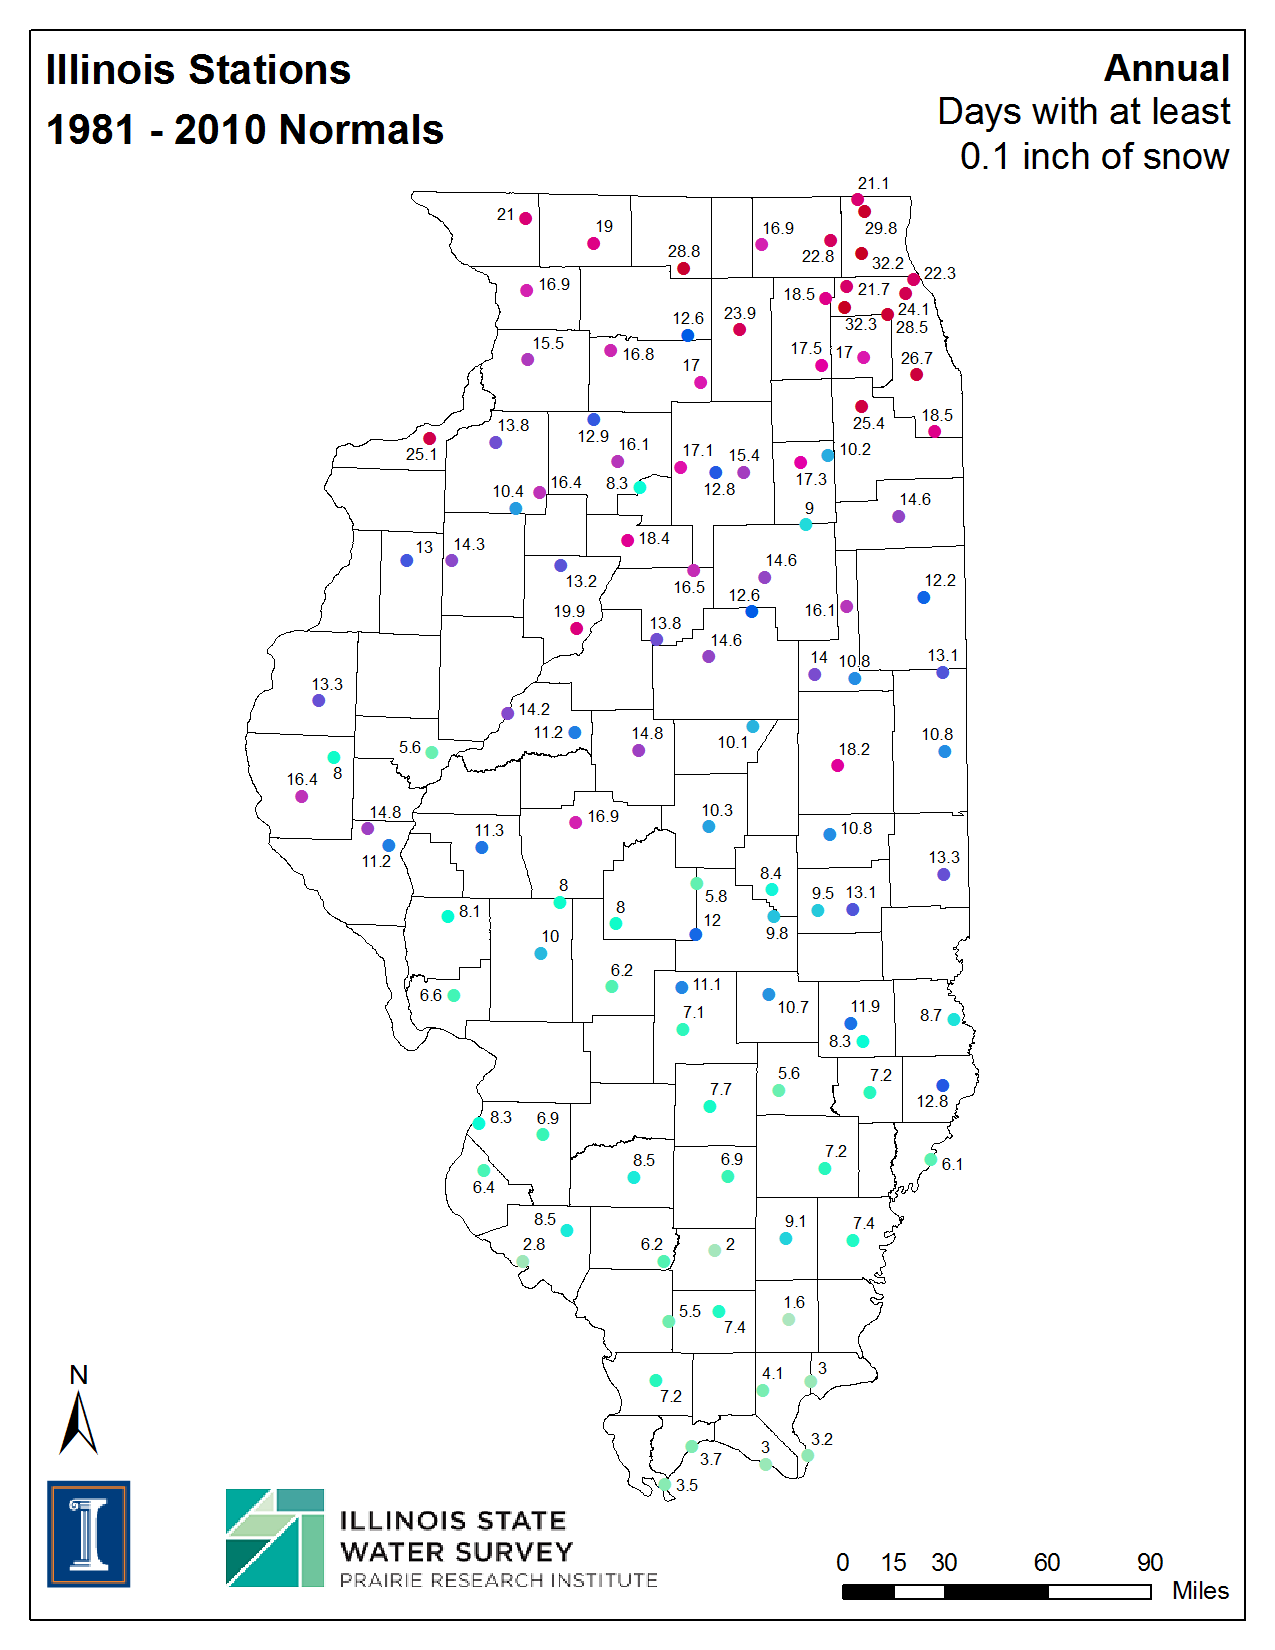
| Days with Snowfall Greater than 0.1 inches | ||||||
| Jan | Feb | Mar | Apr | May | Jun | |
| Jul | Aug | Sep | Oct | Nov | Dec | Annual |
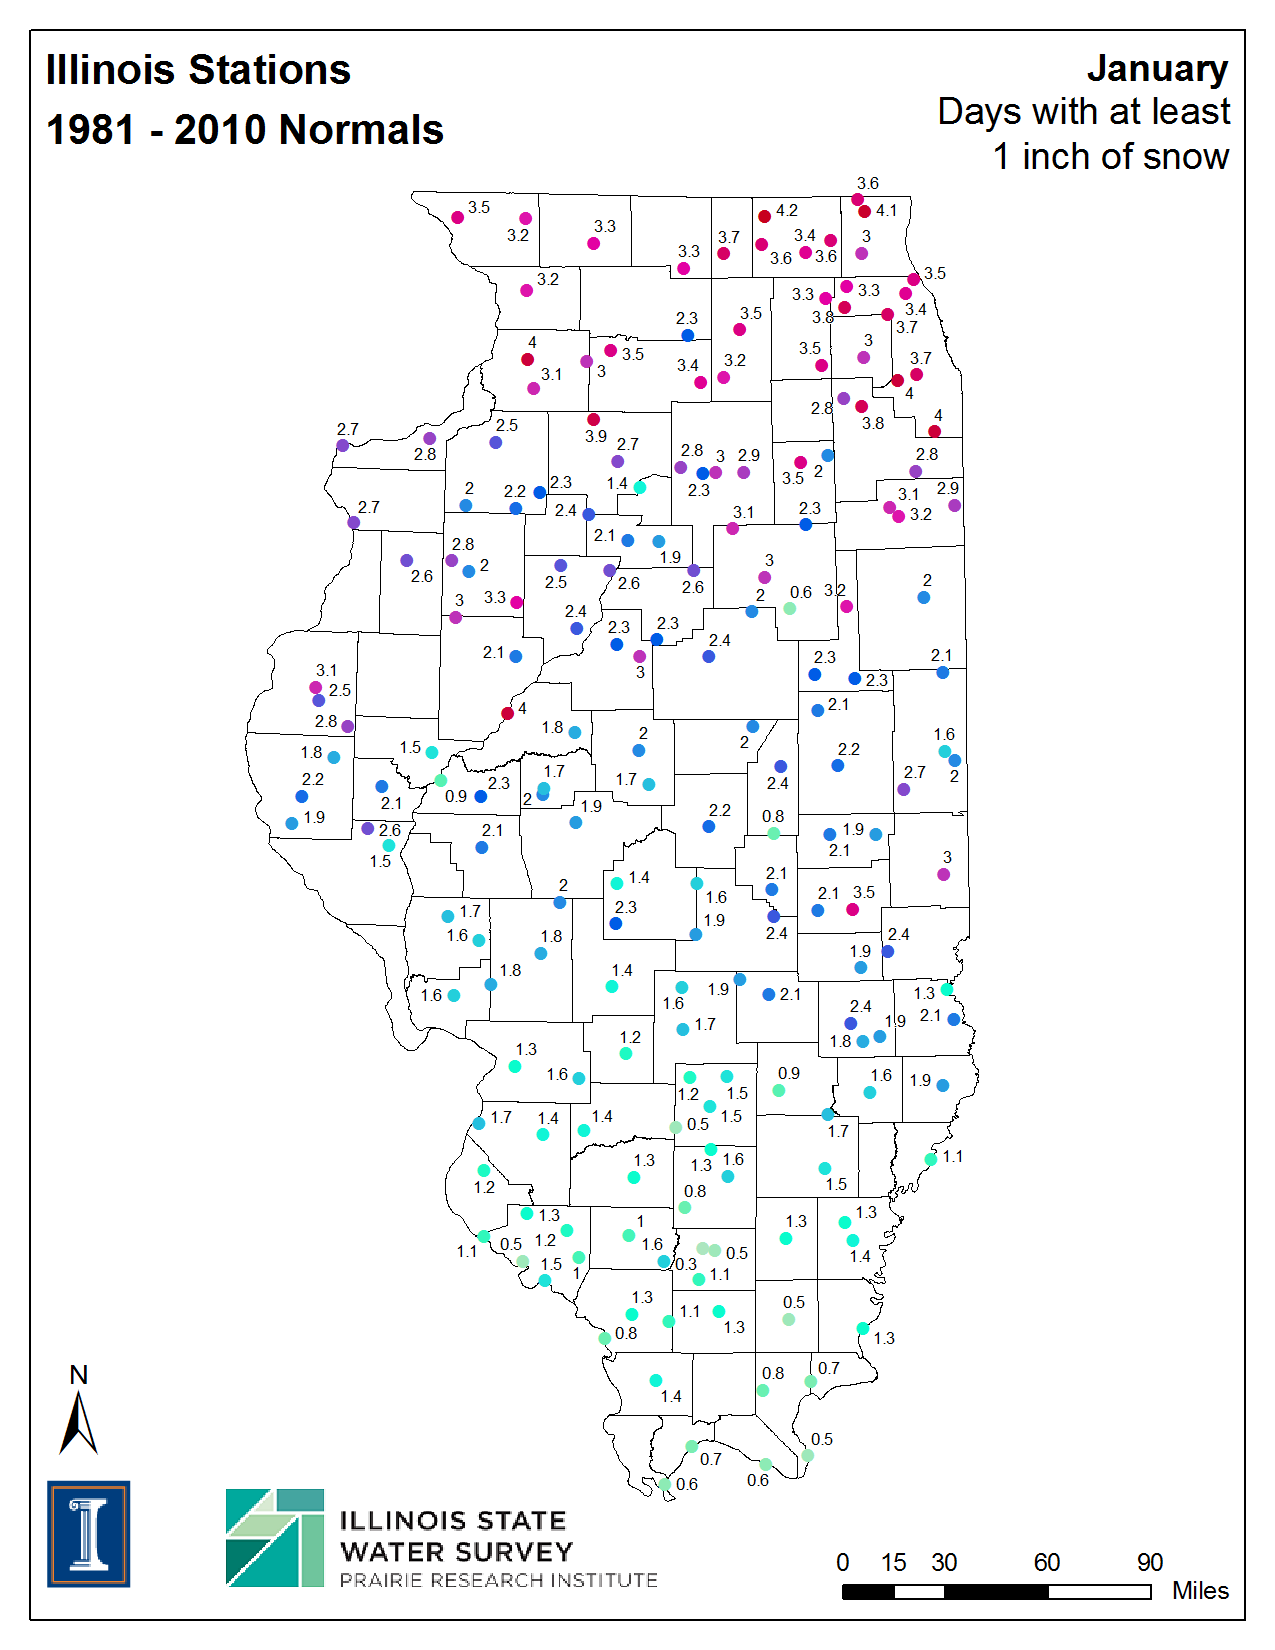
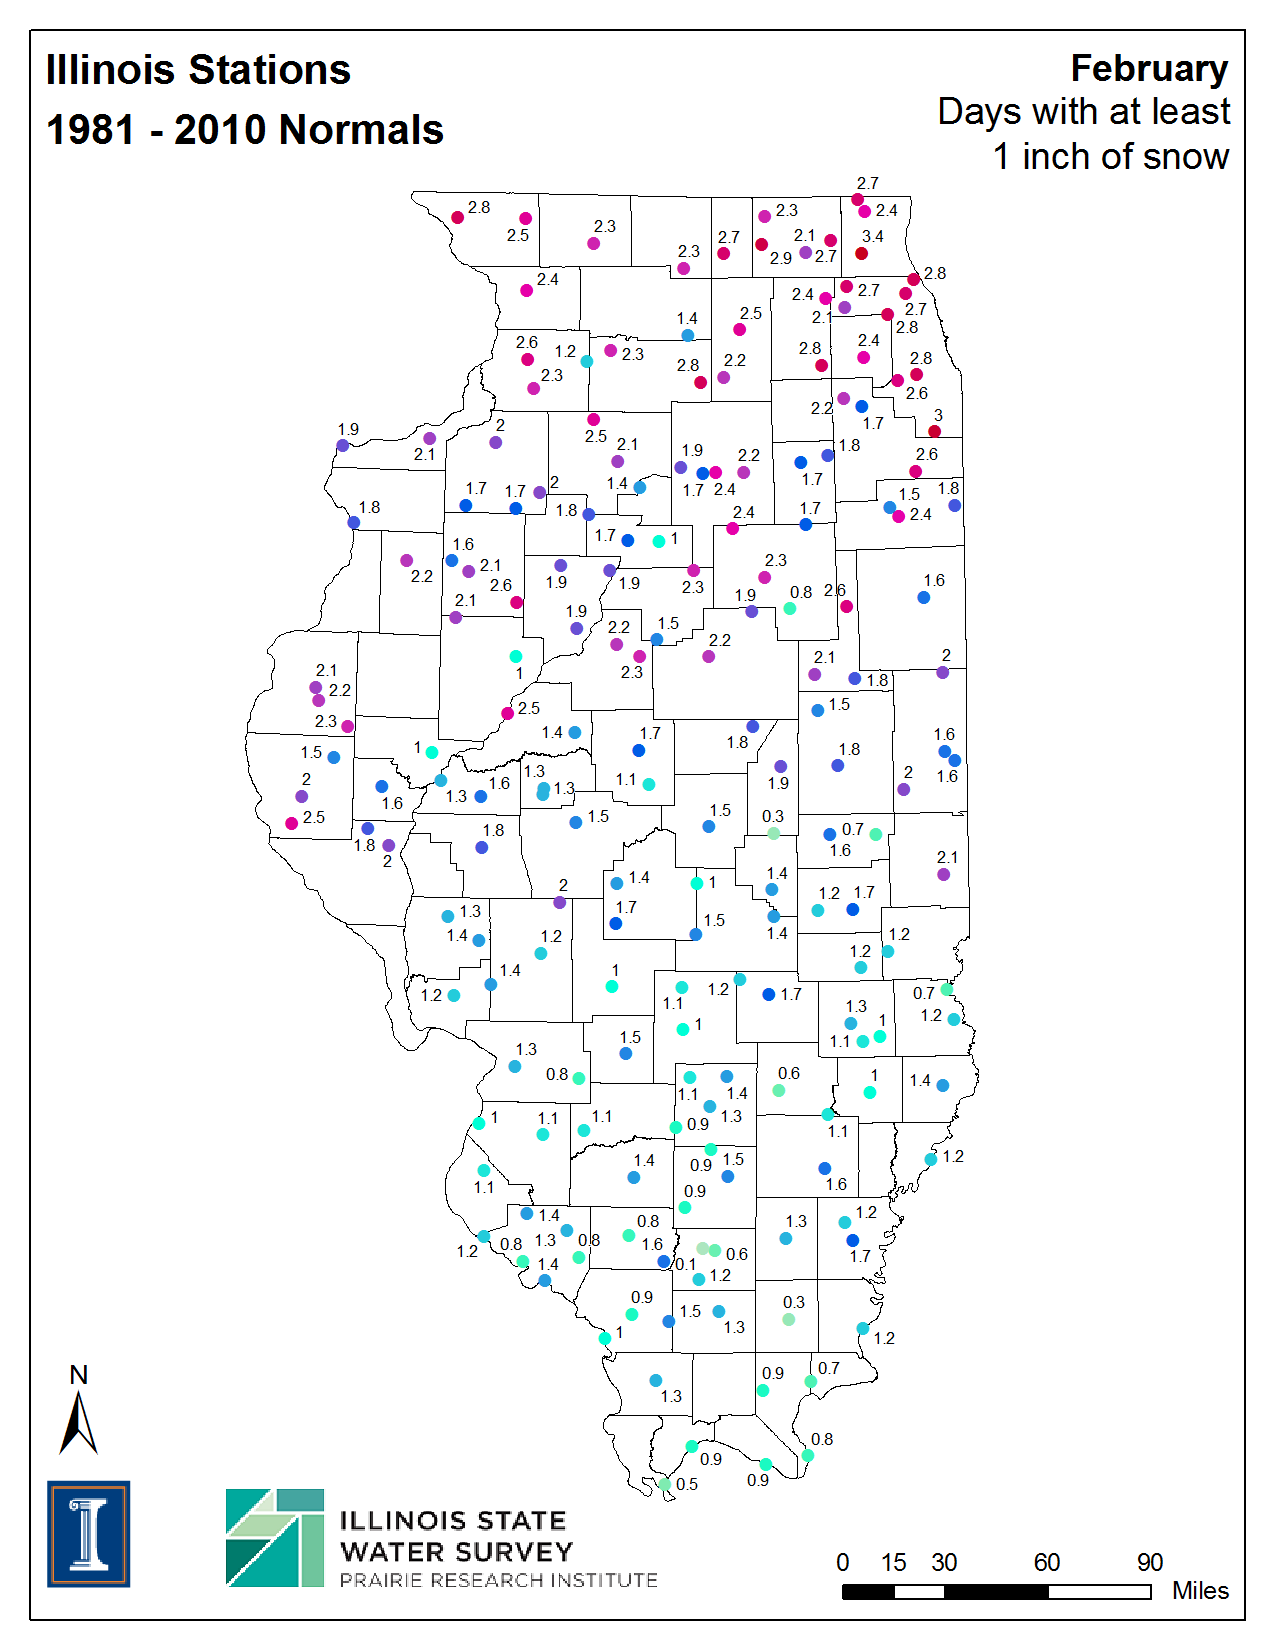
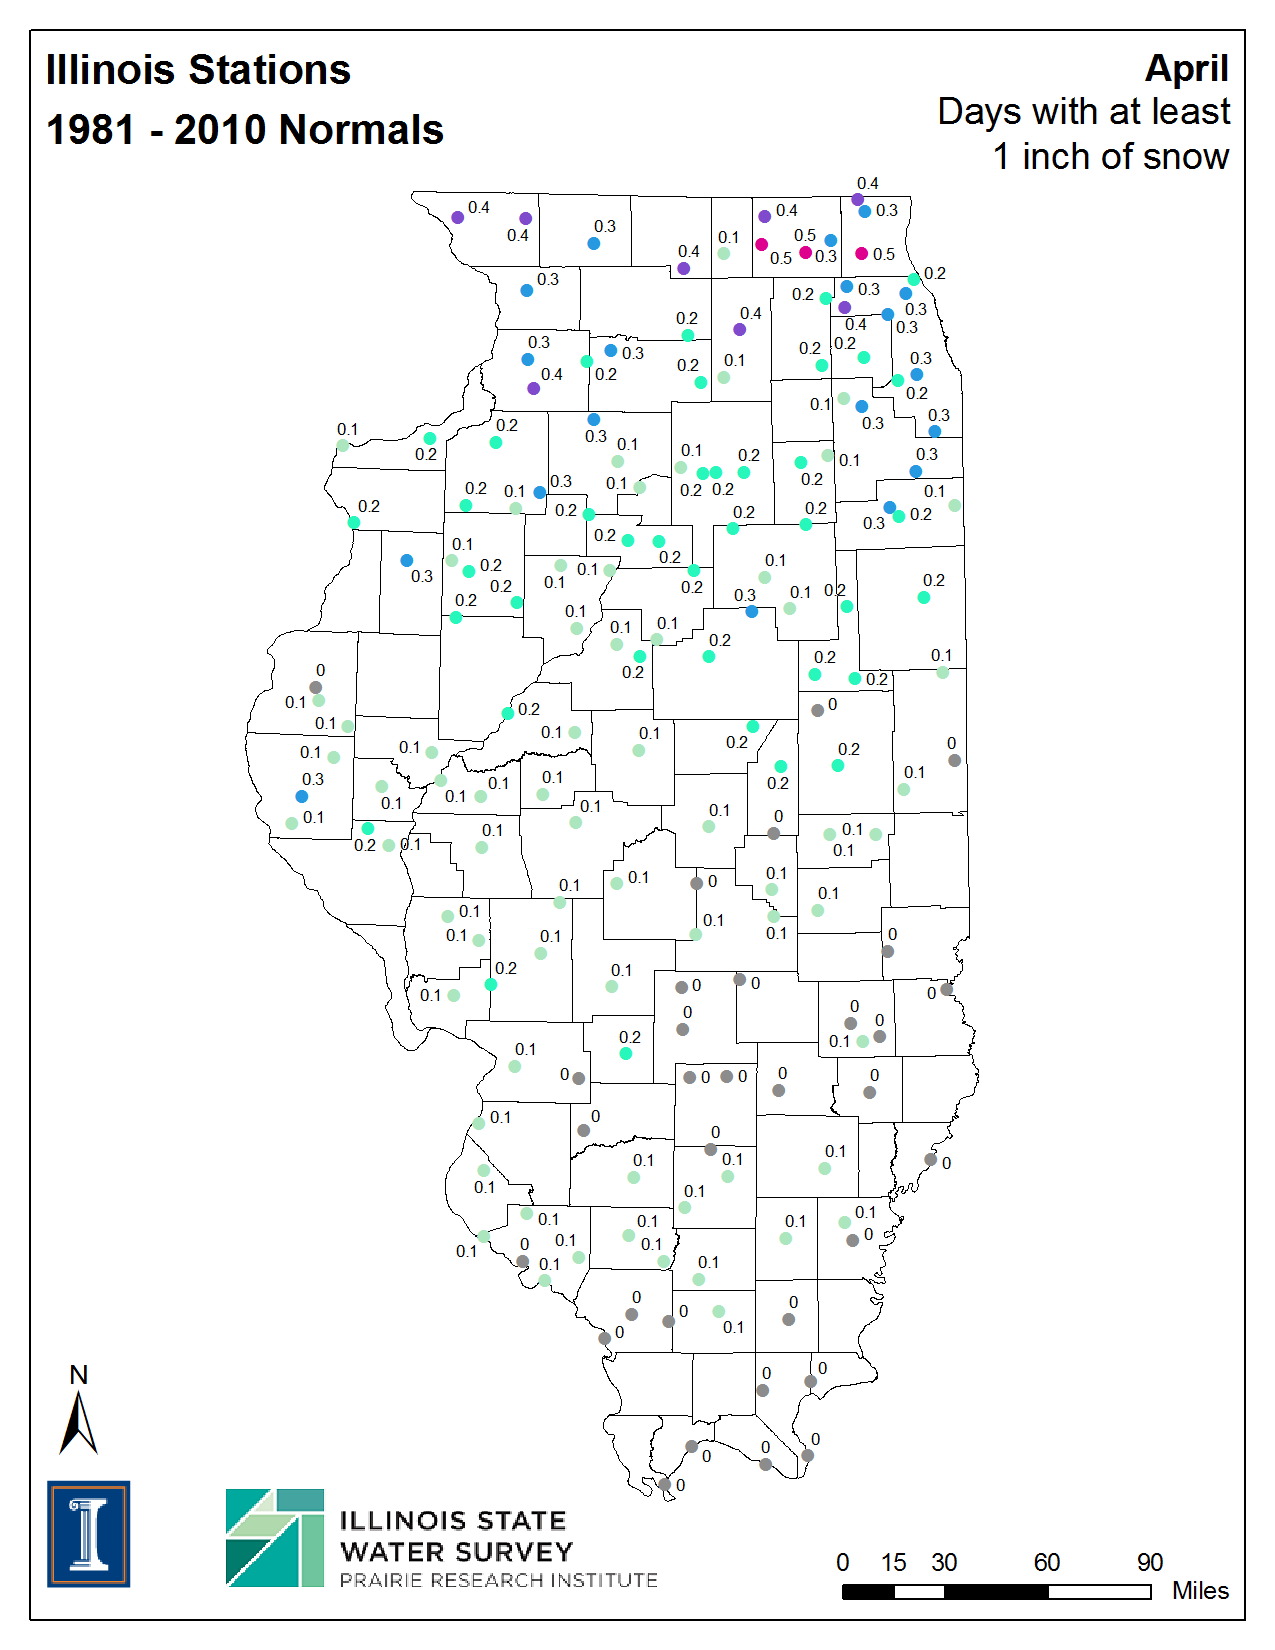
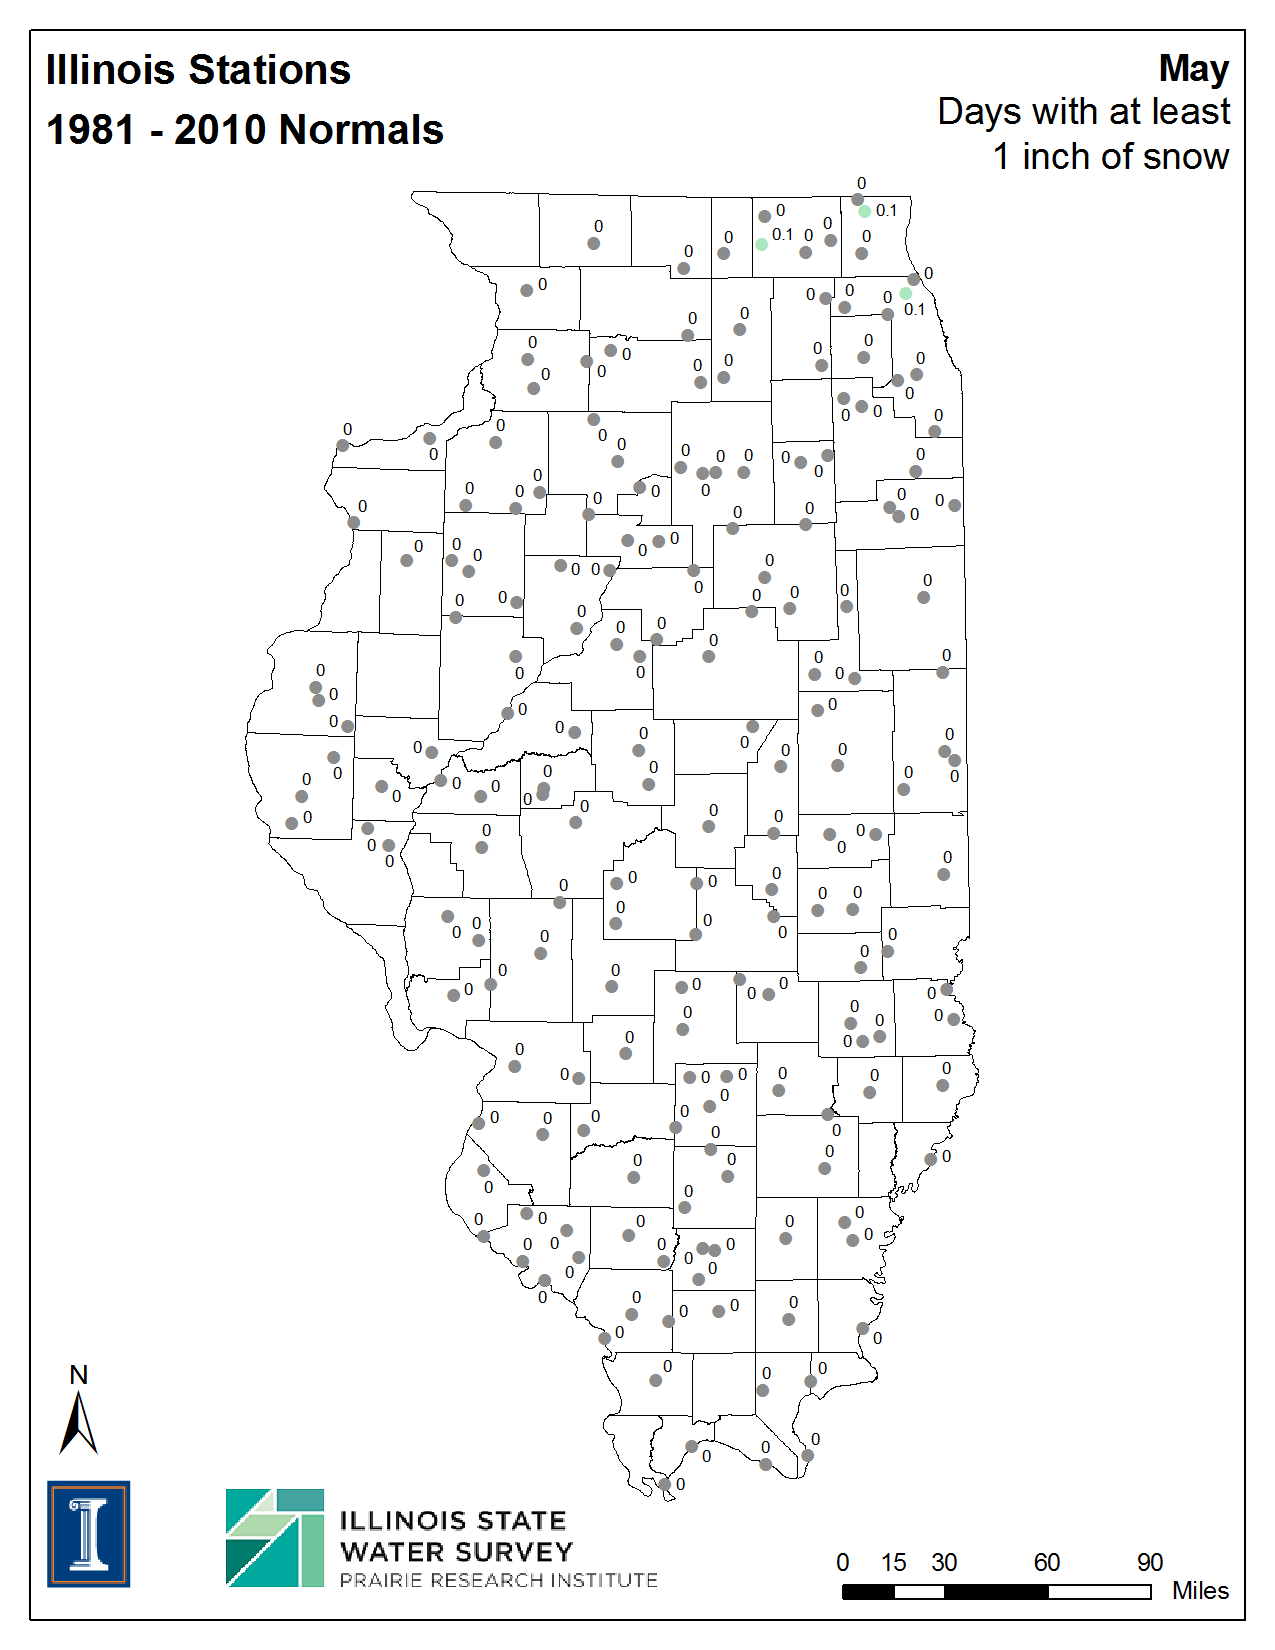
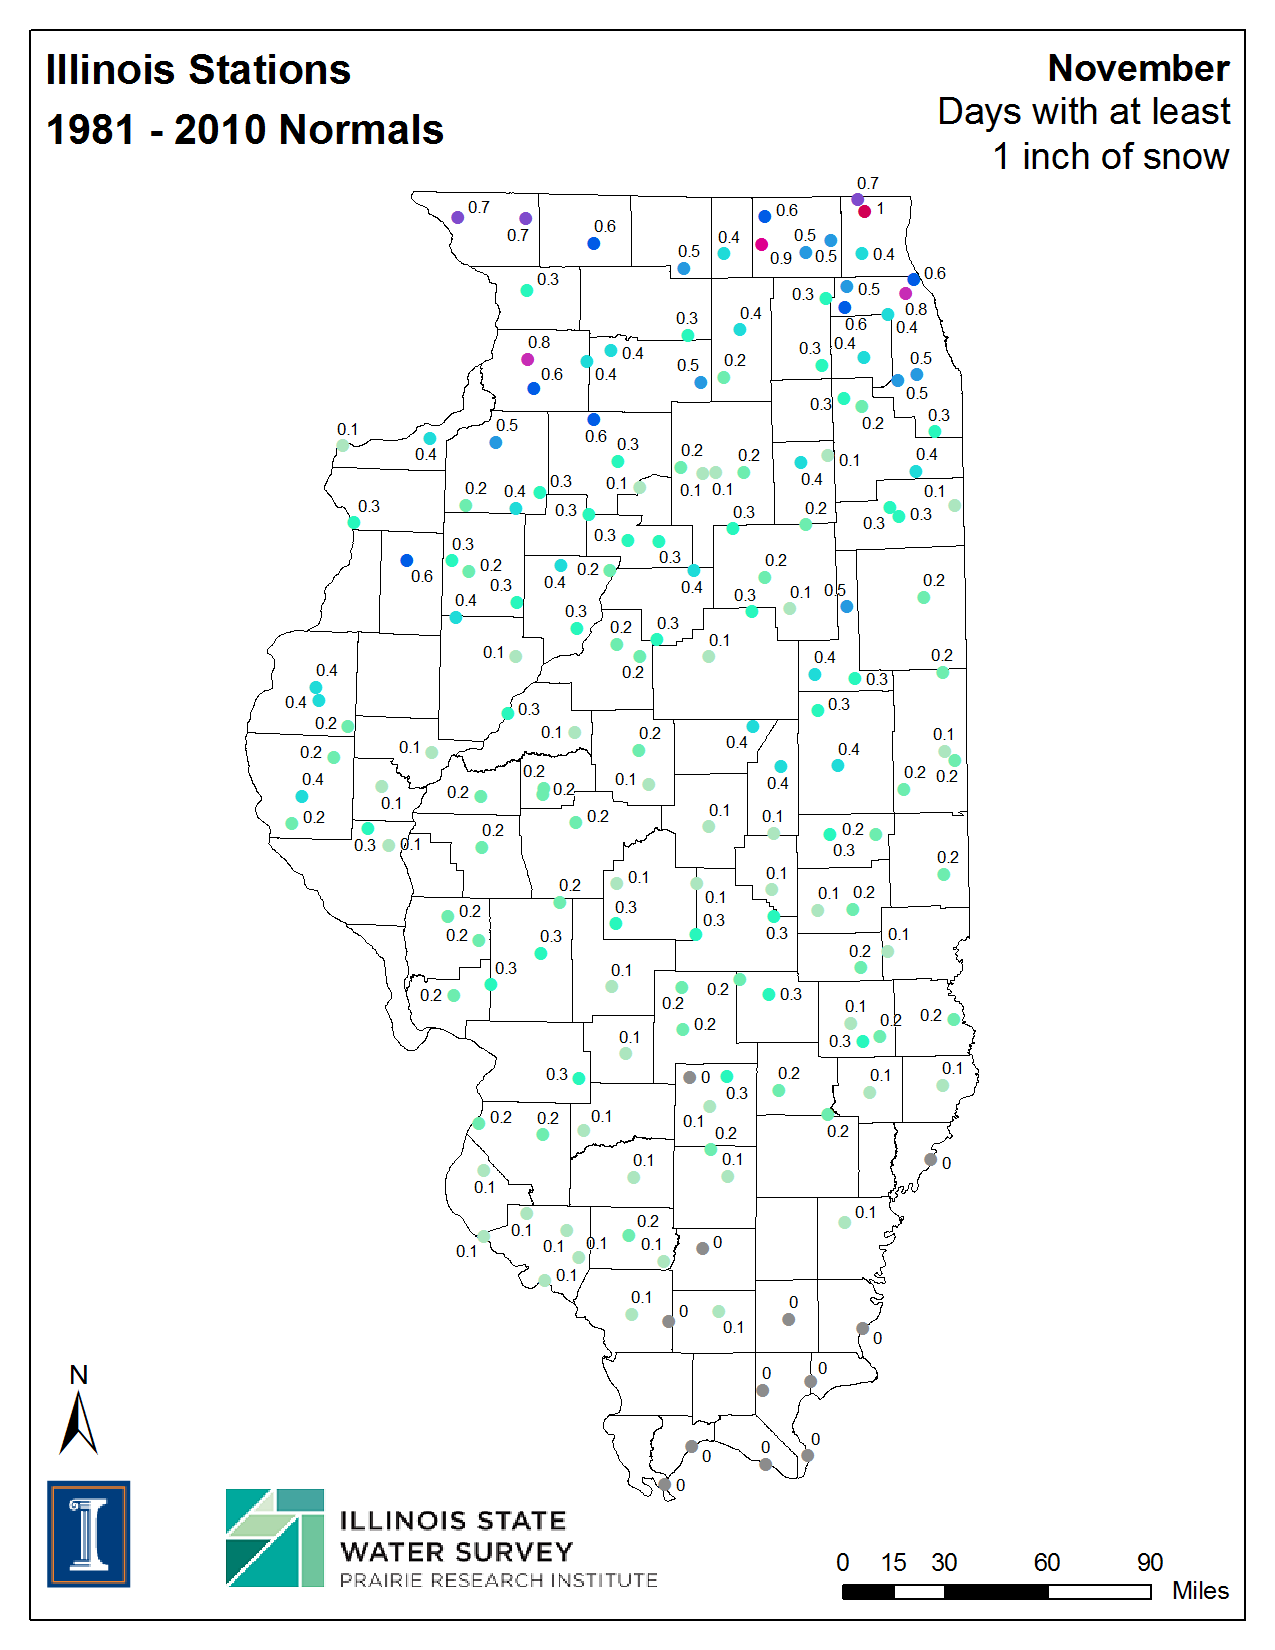
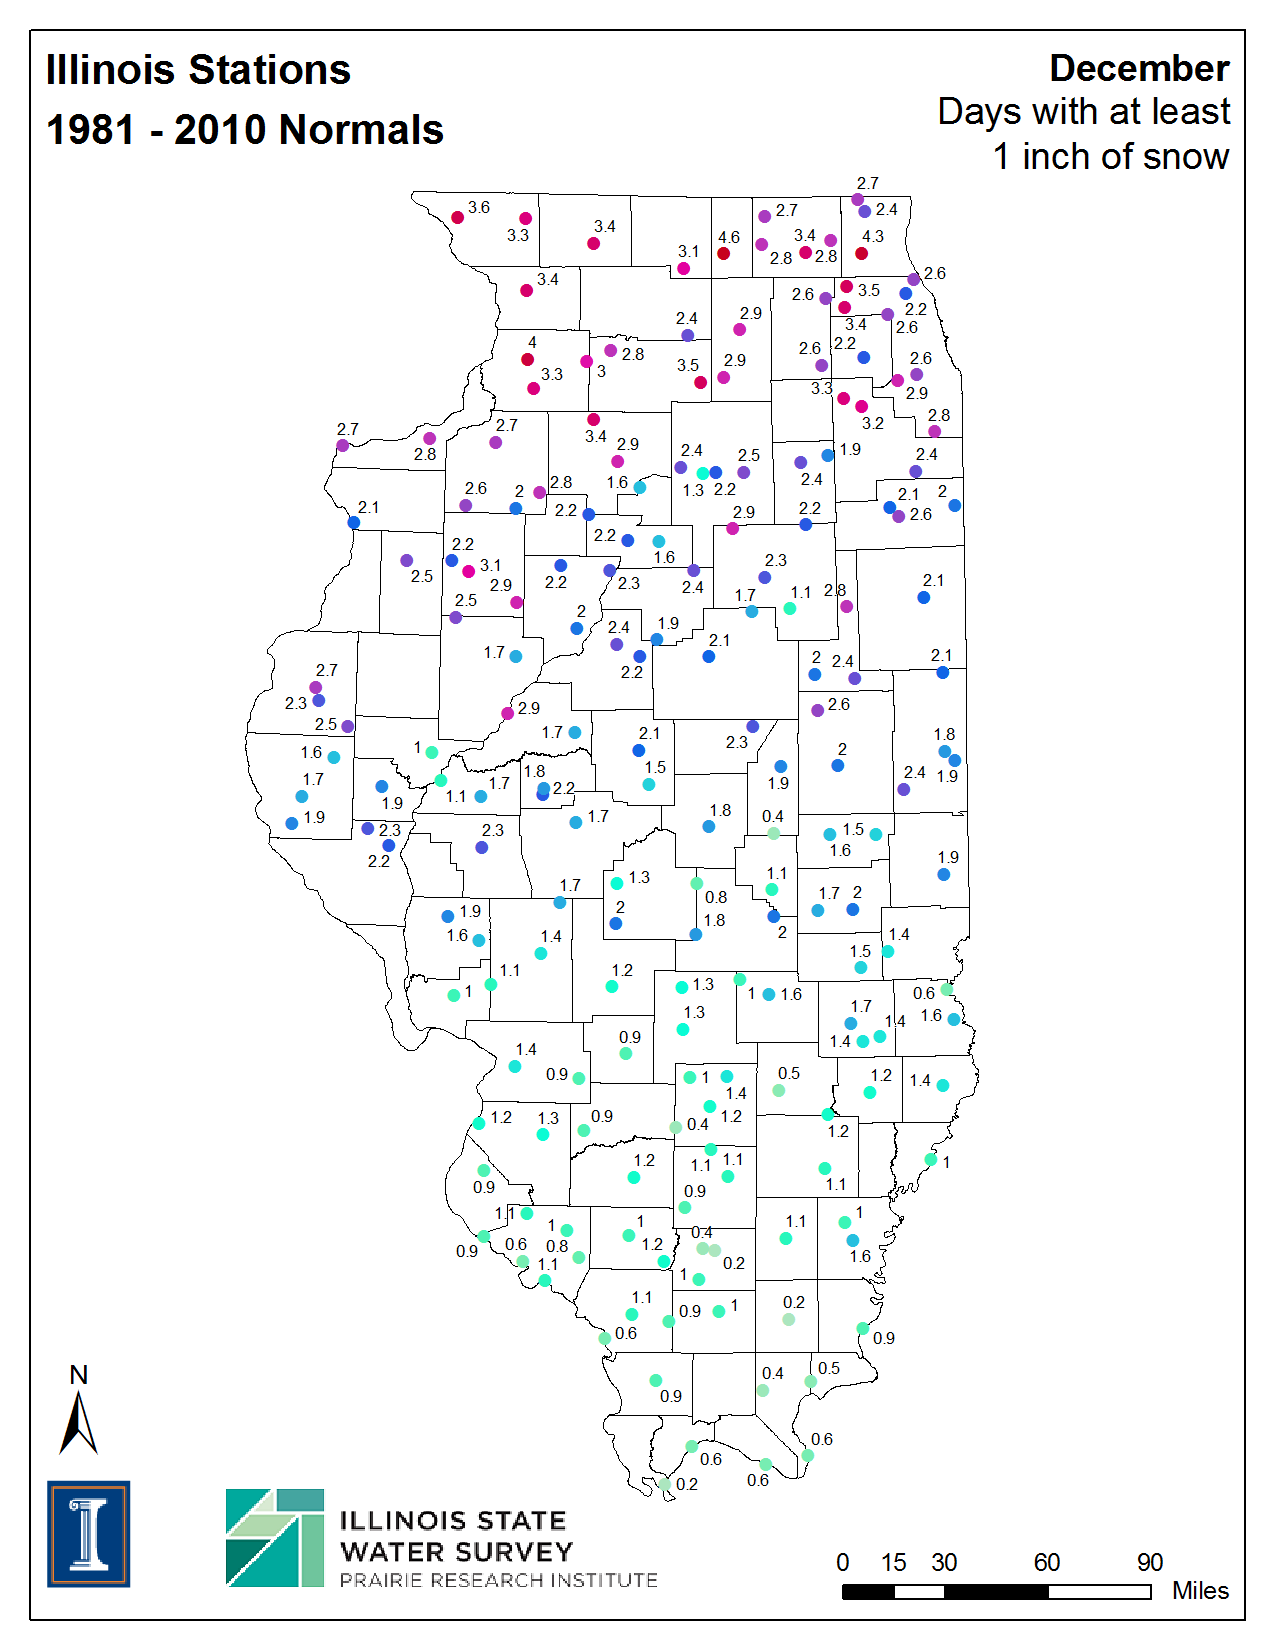
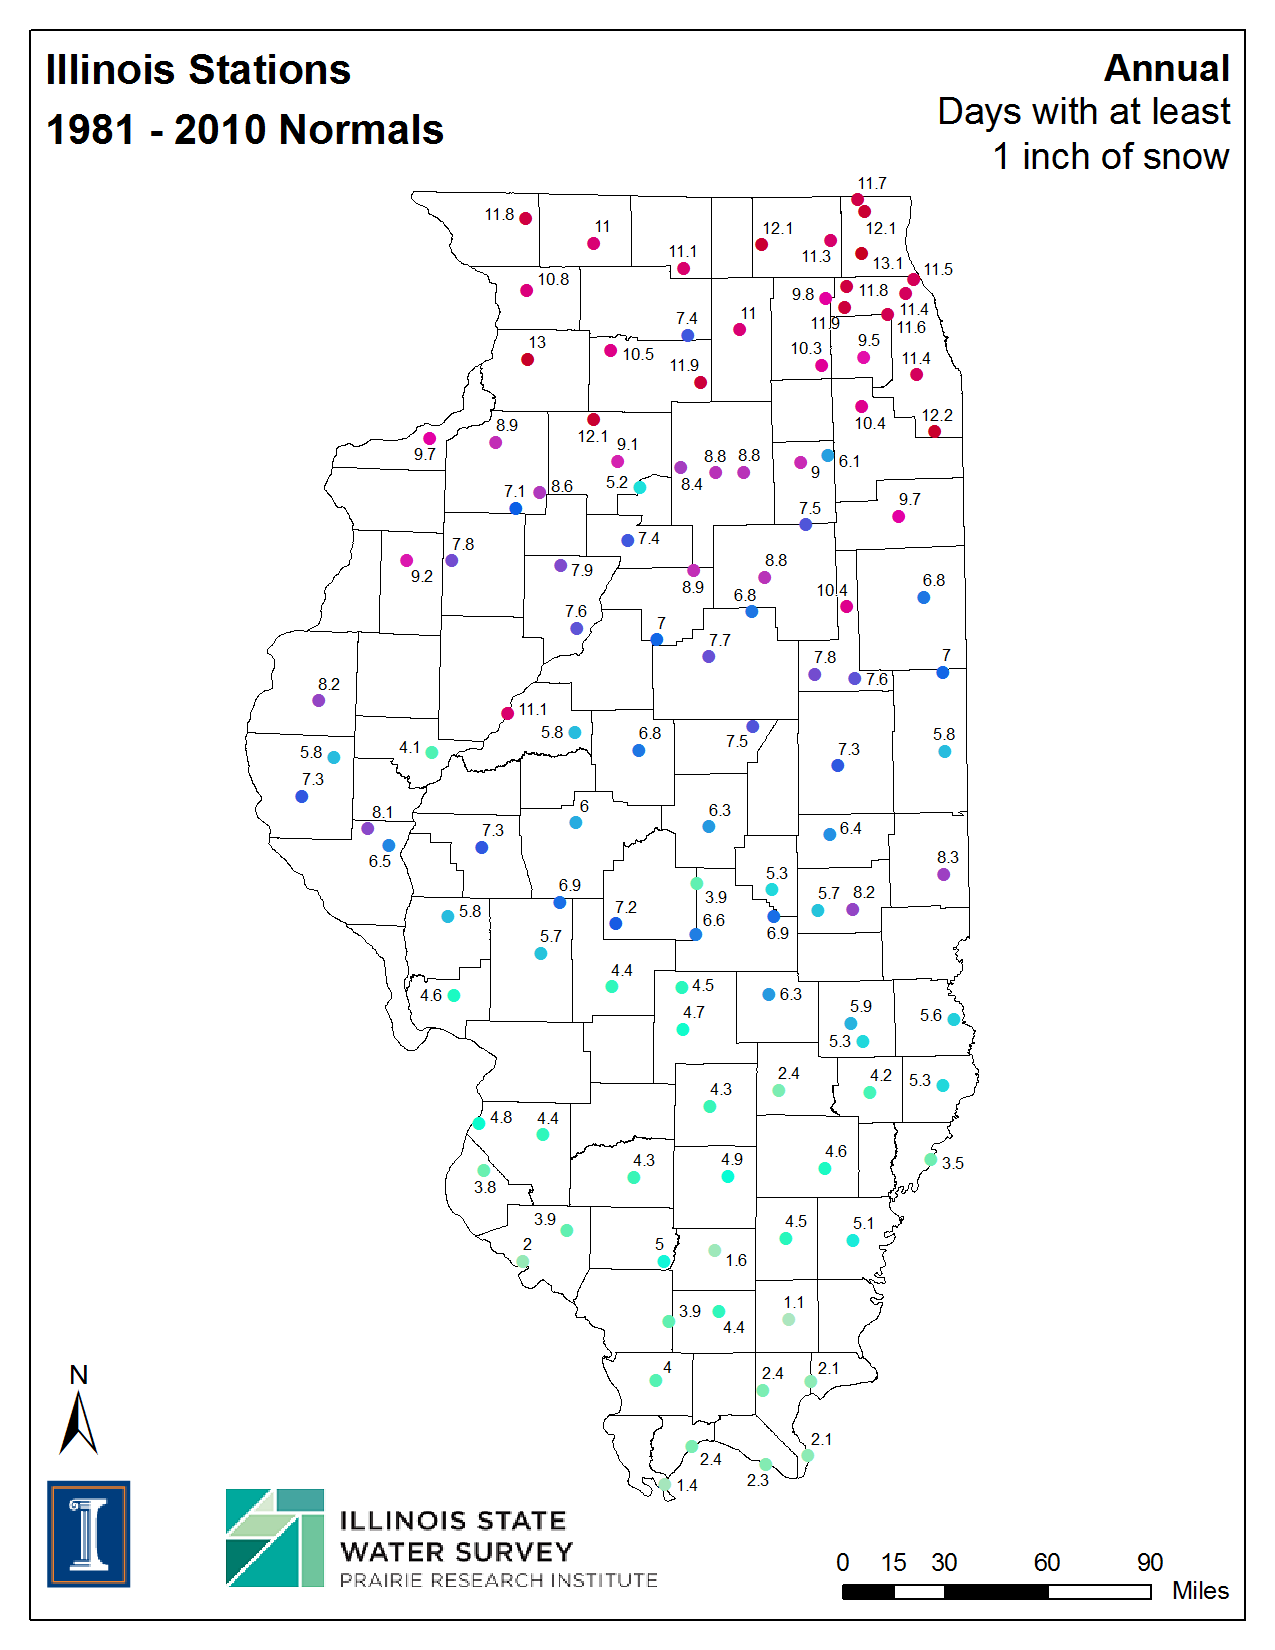
| Days with Snowfall Greater than 1.0 inches | ||||||
| Jan | Feb | Mar | Apr | May | Jun | |
| Jul | Aug | Sep | Oct | Nov | Dec | Annual |
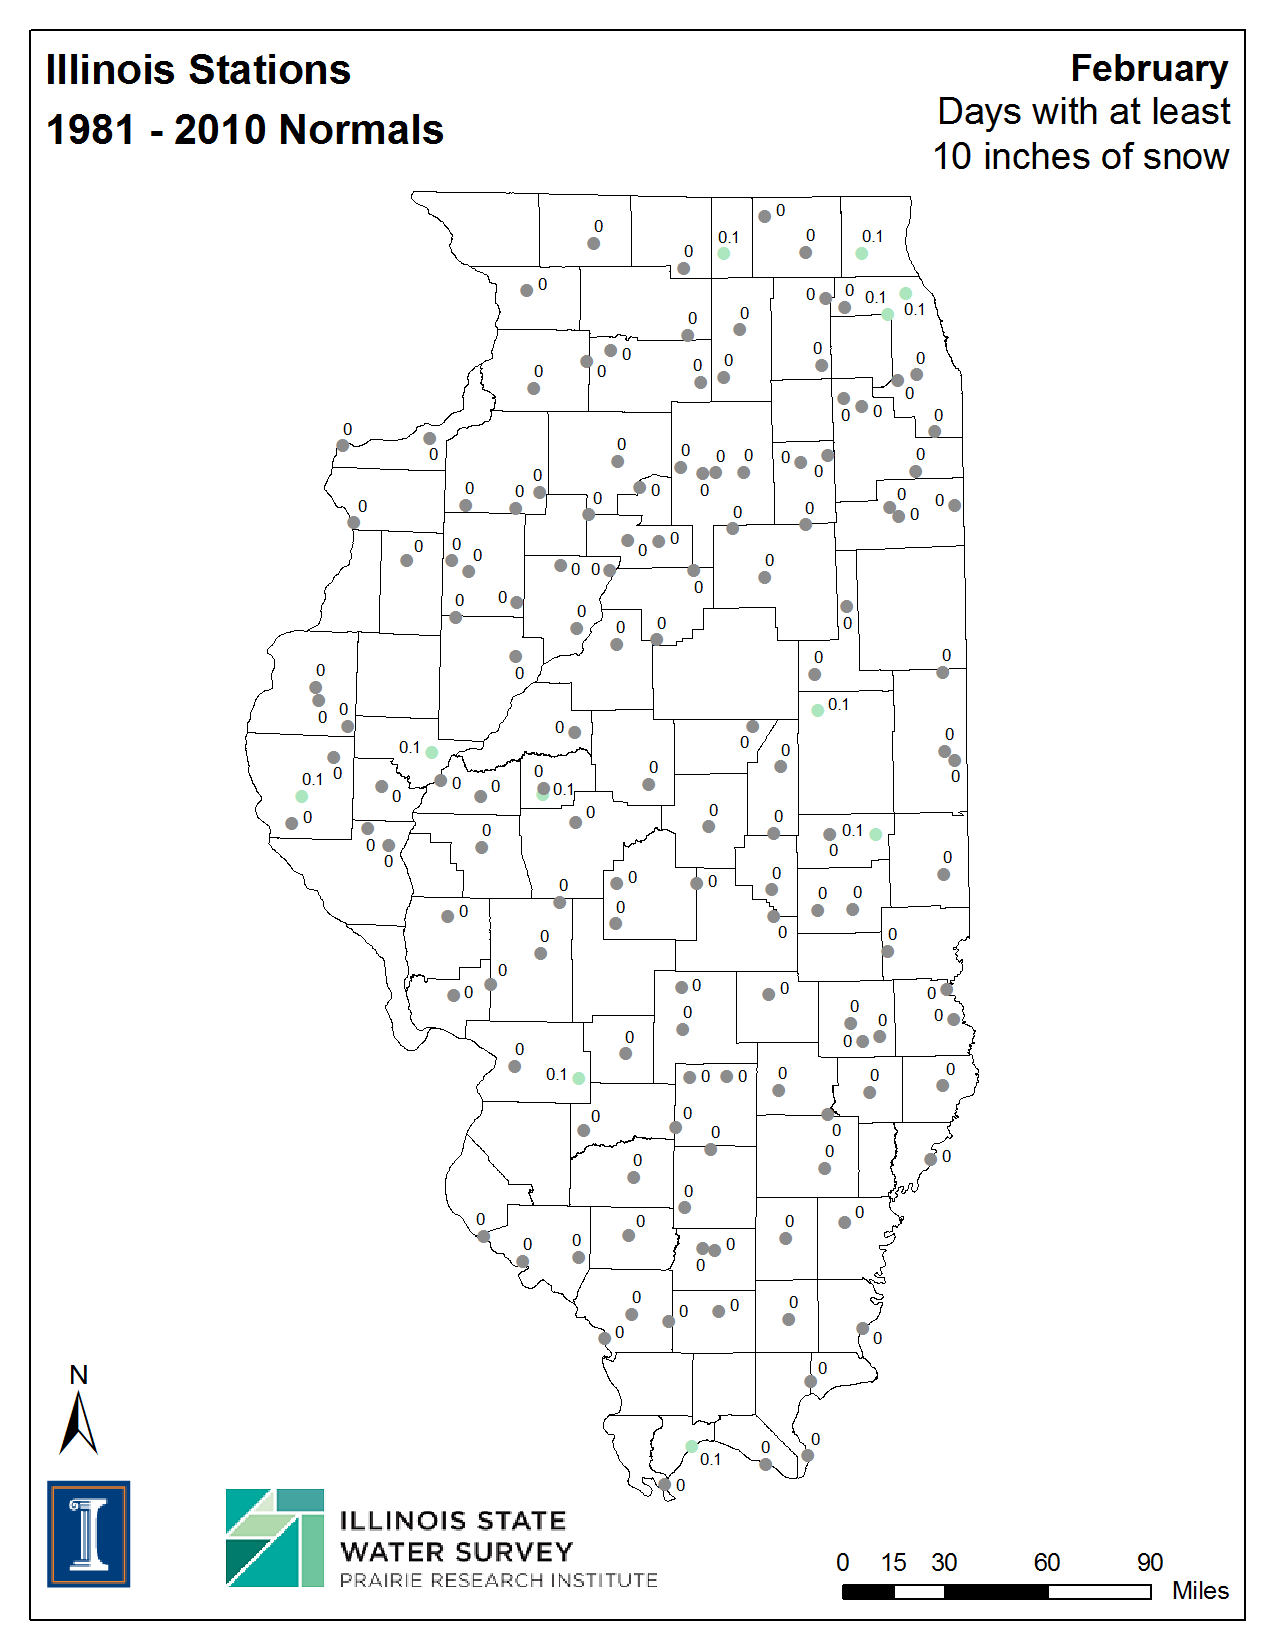
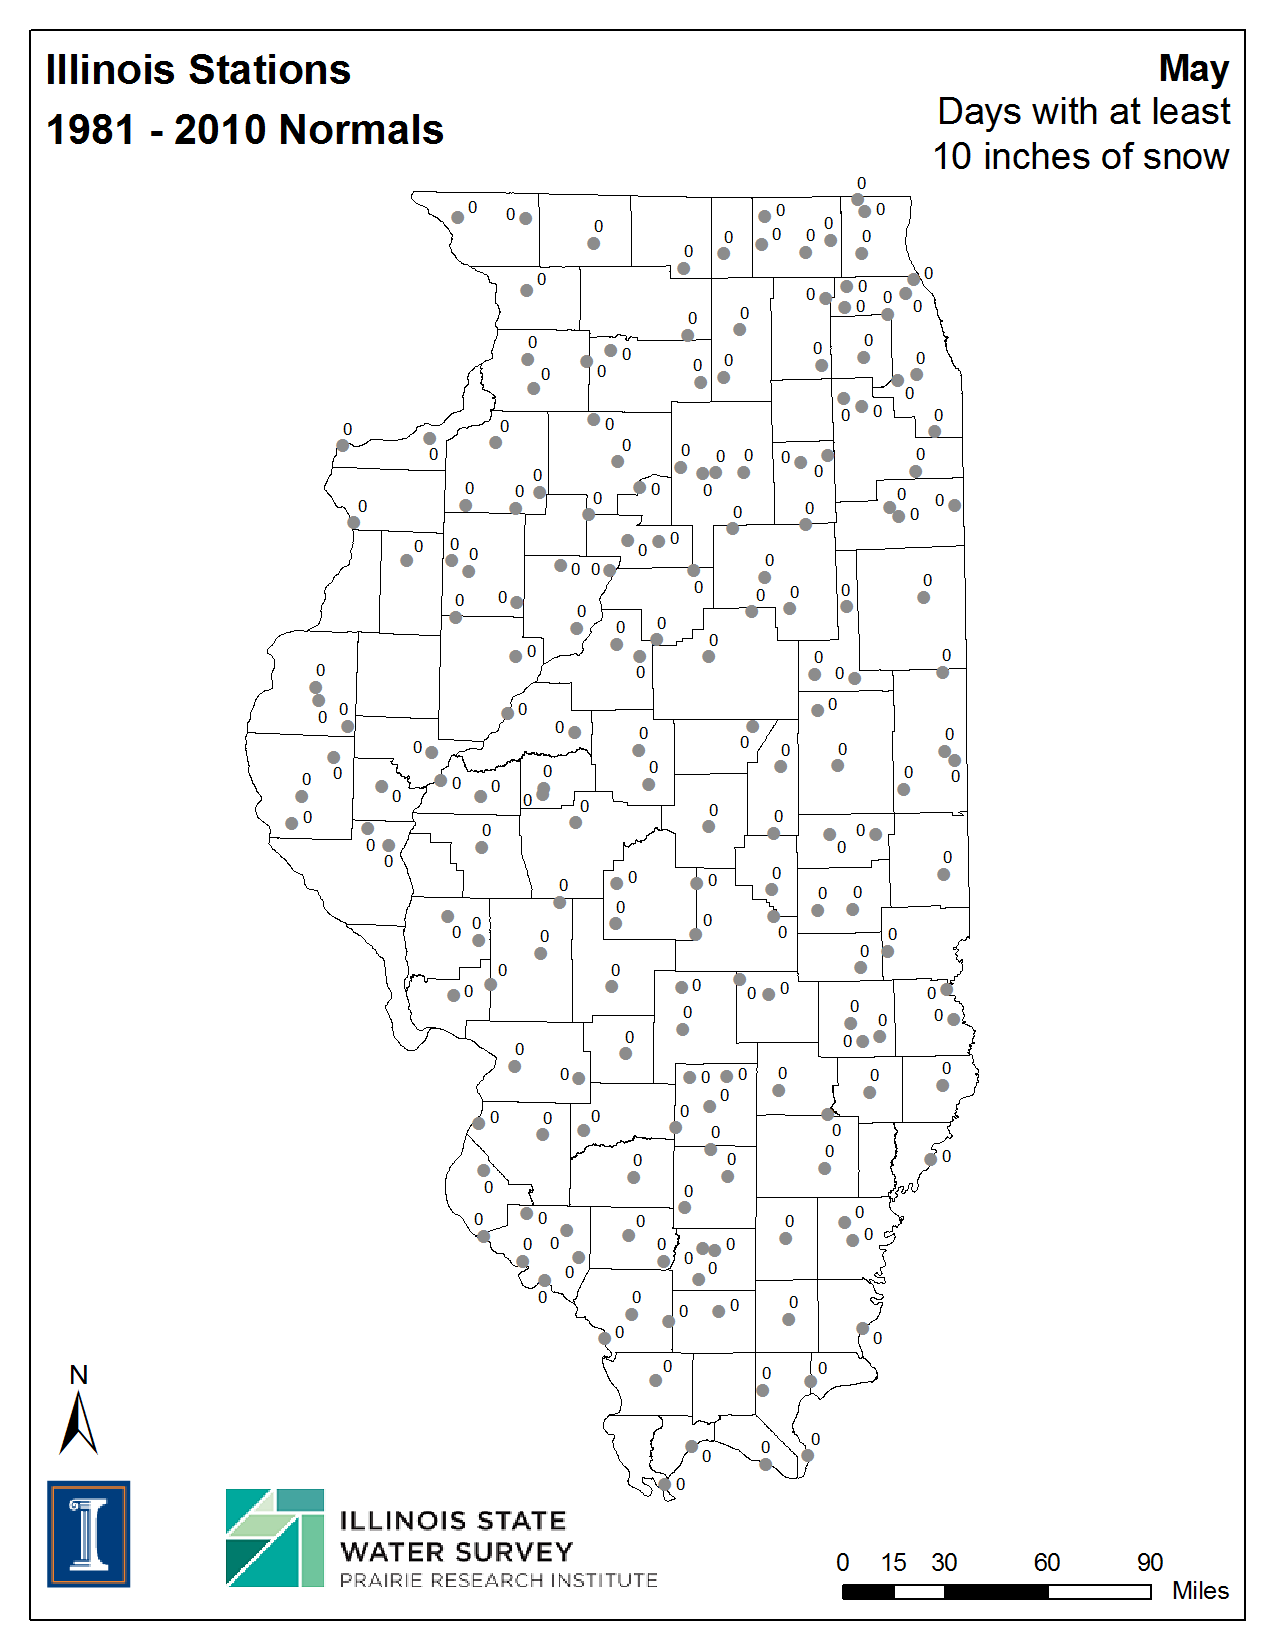
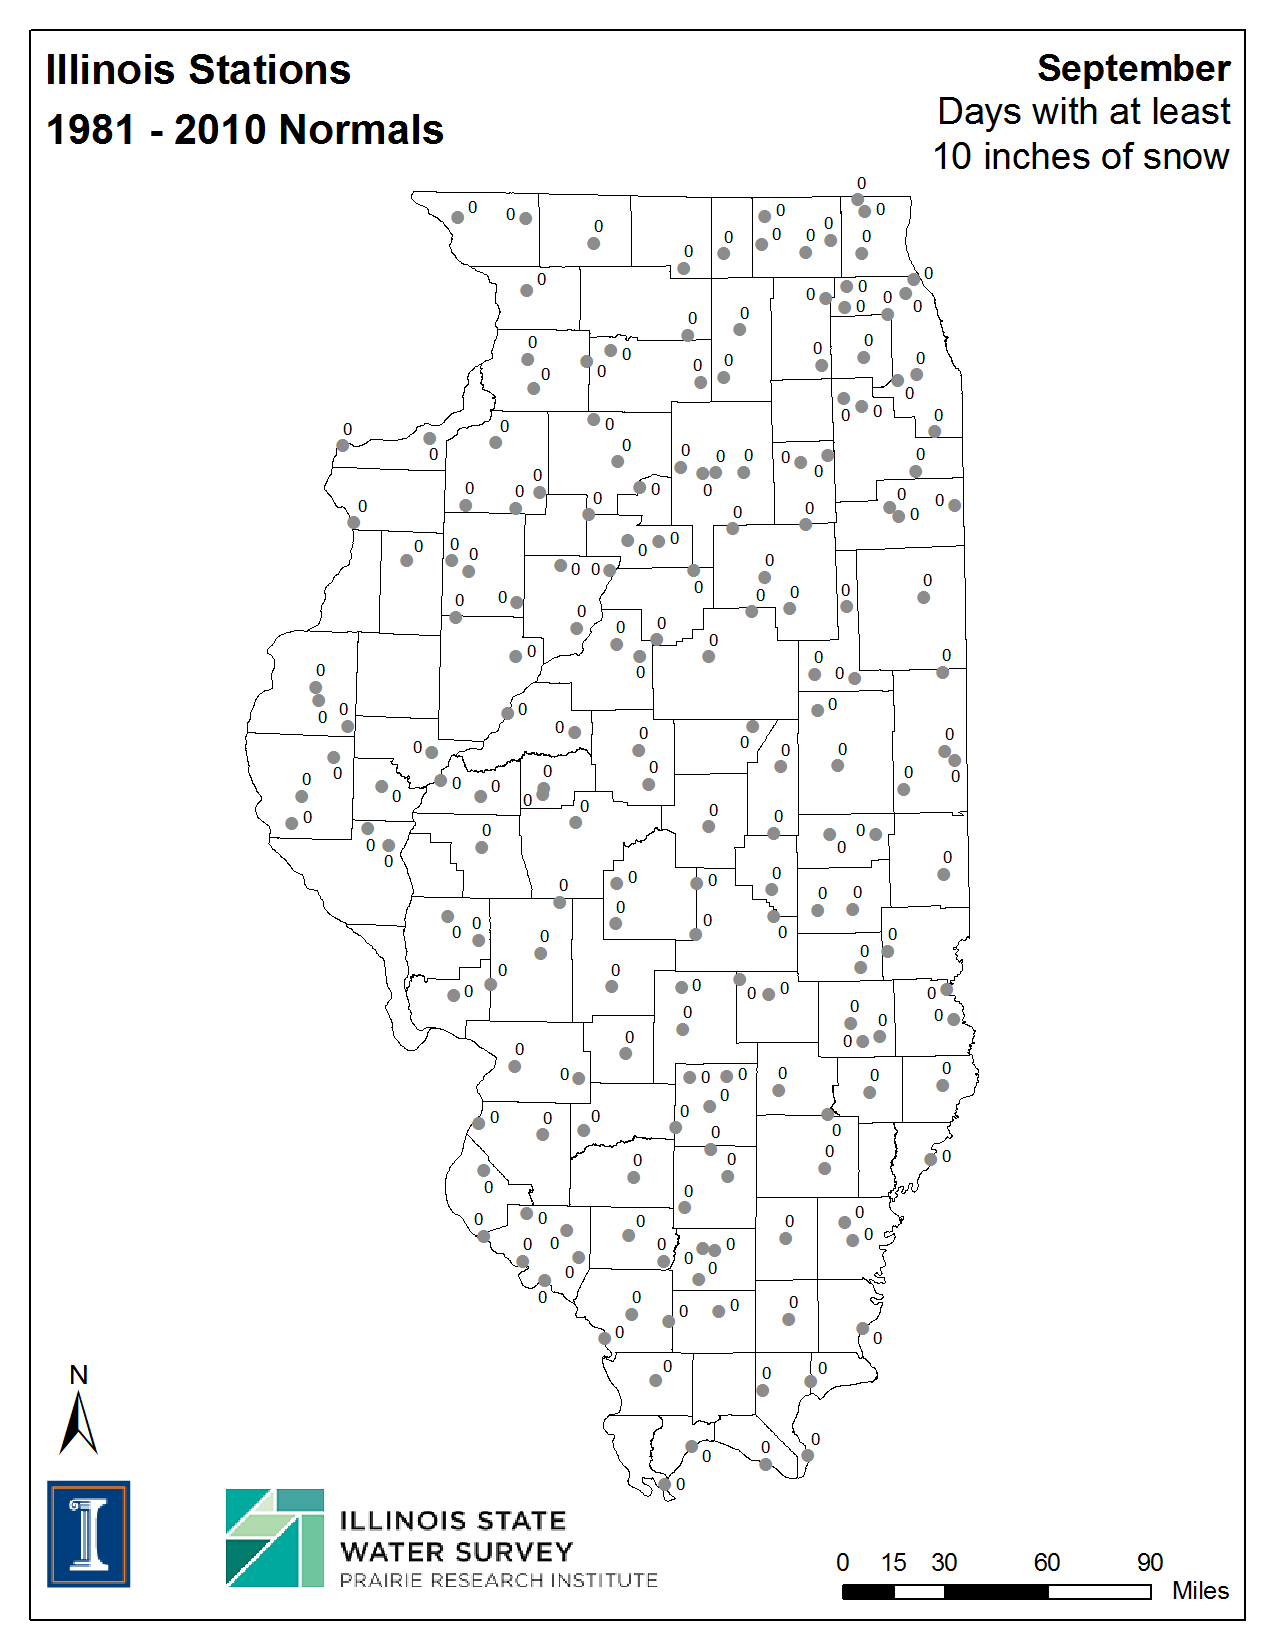
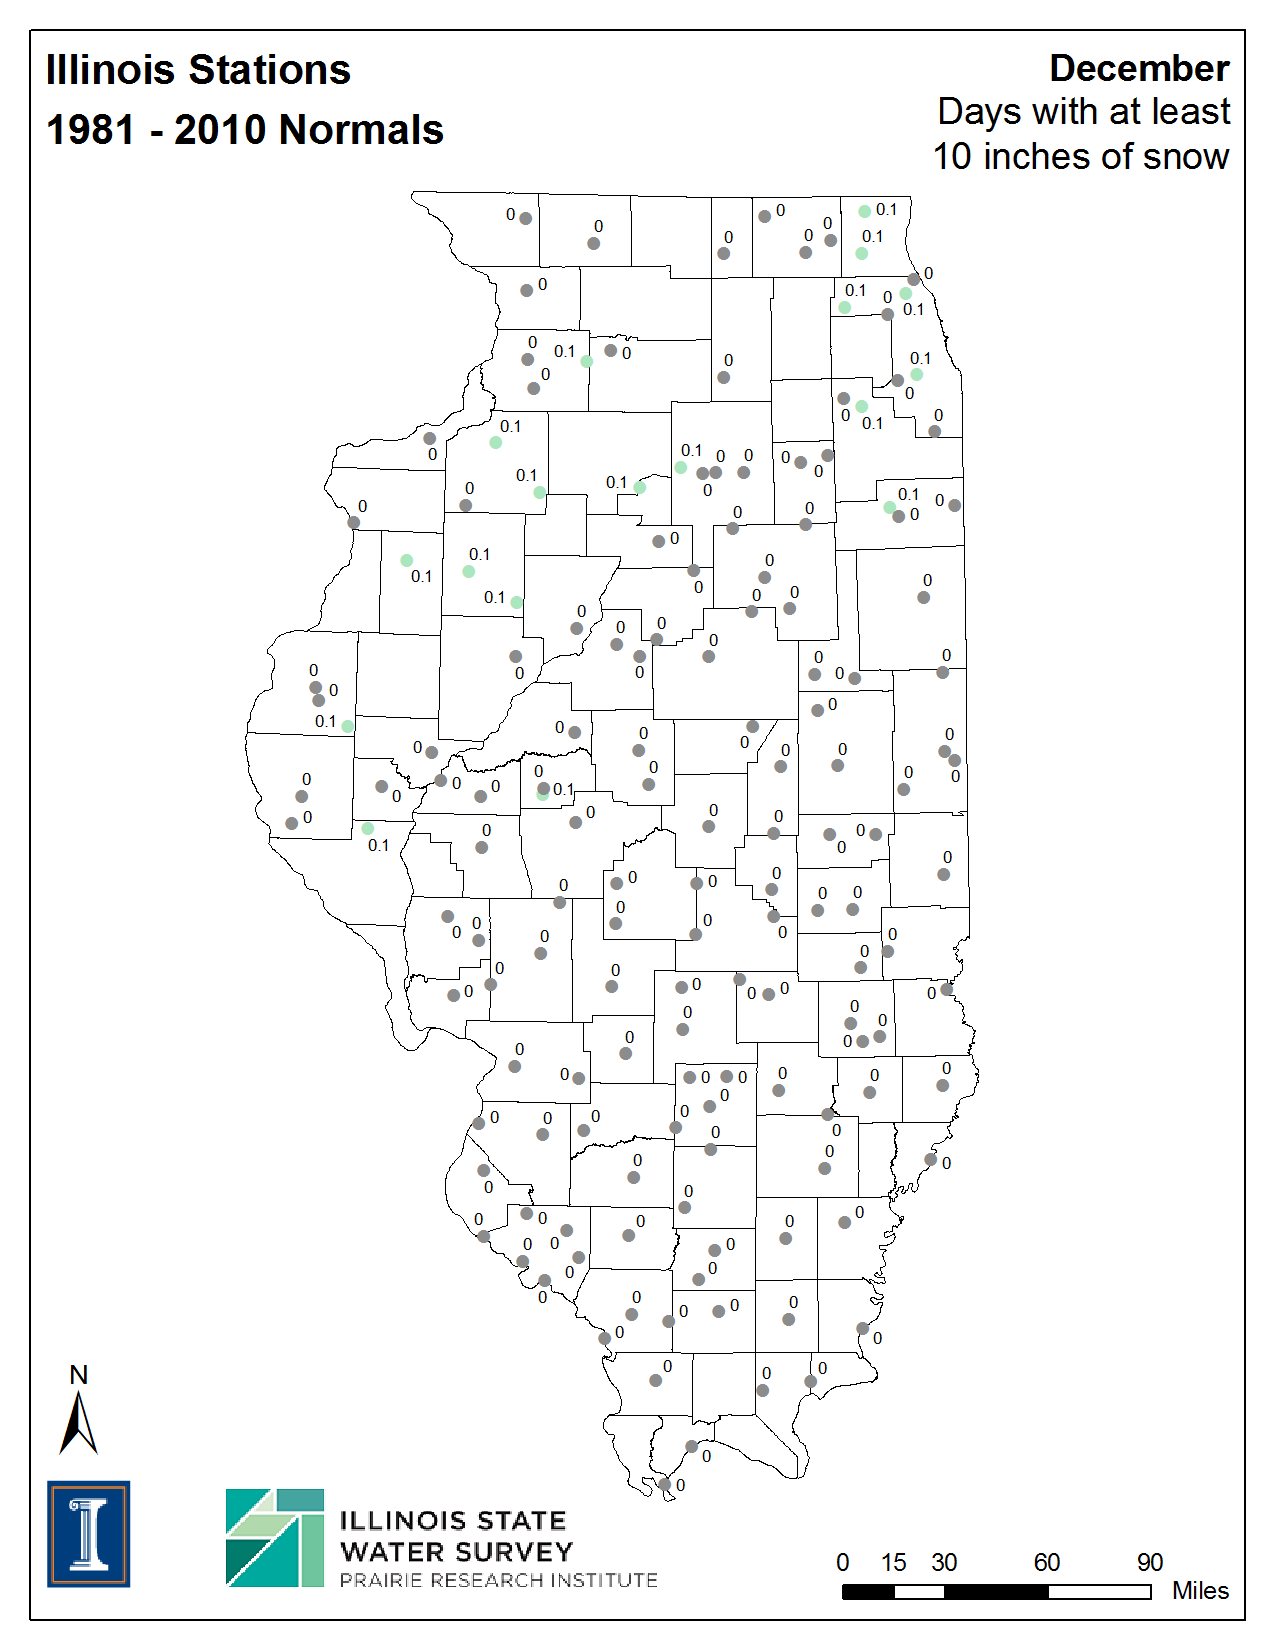
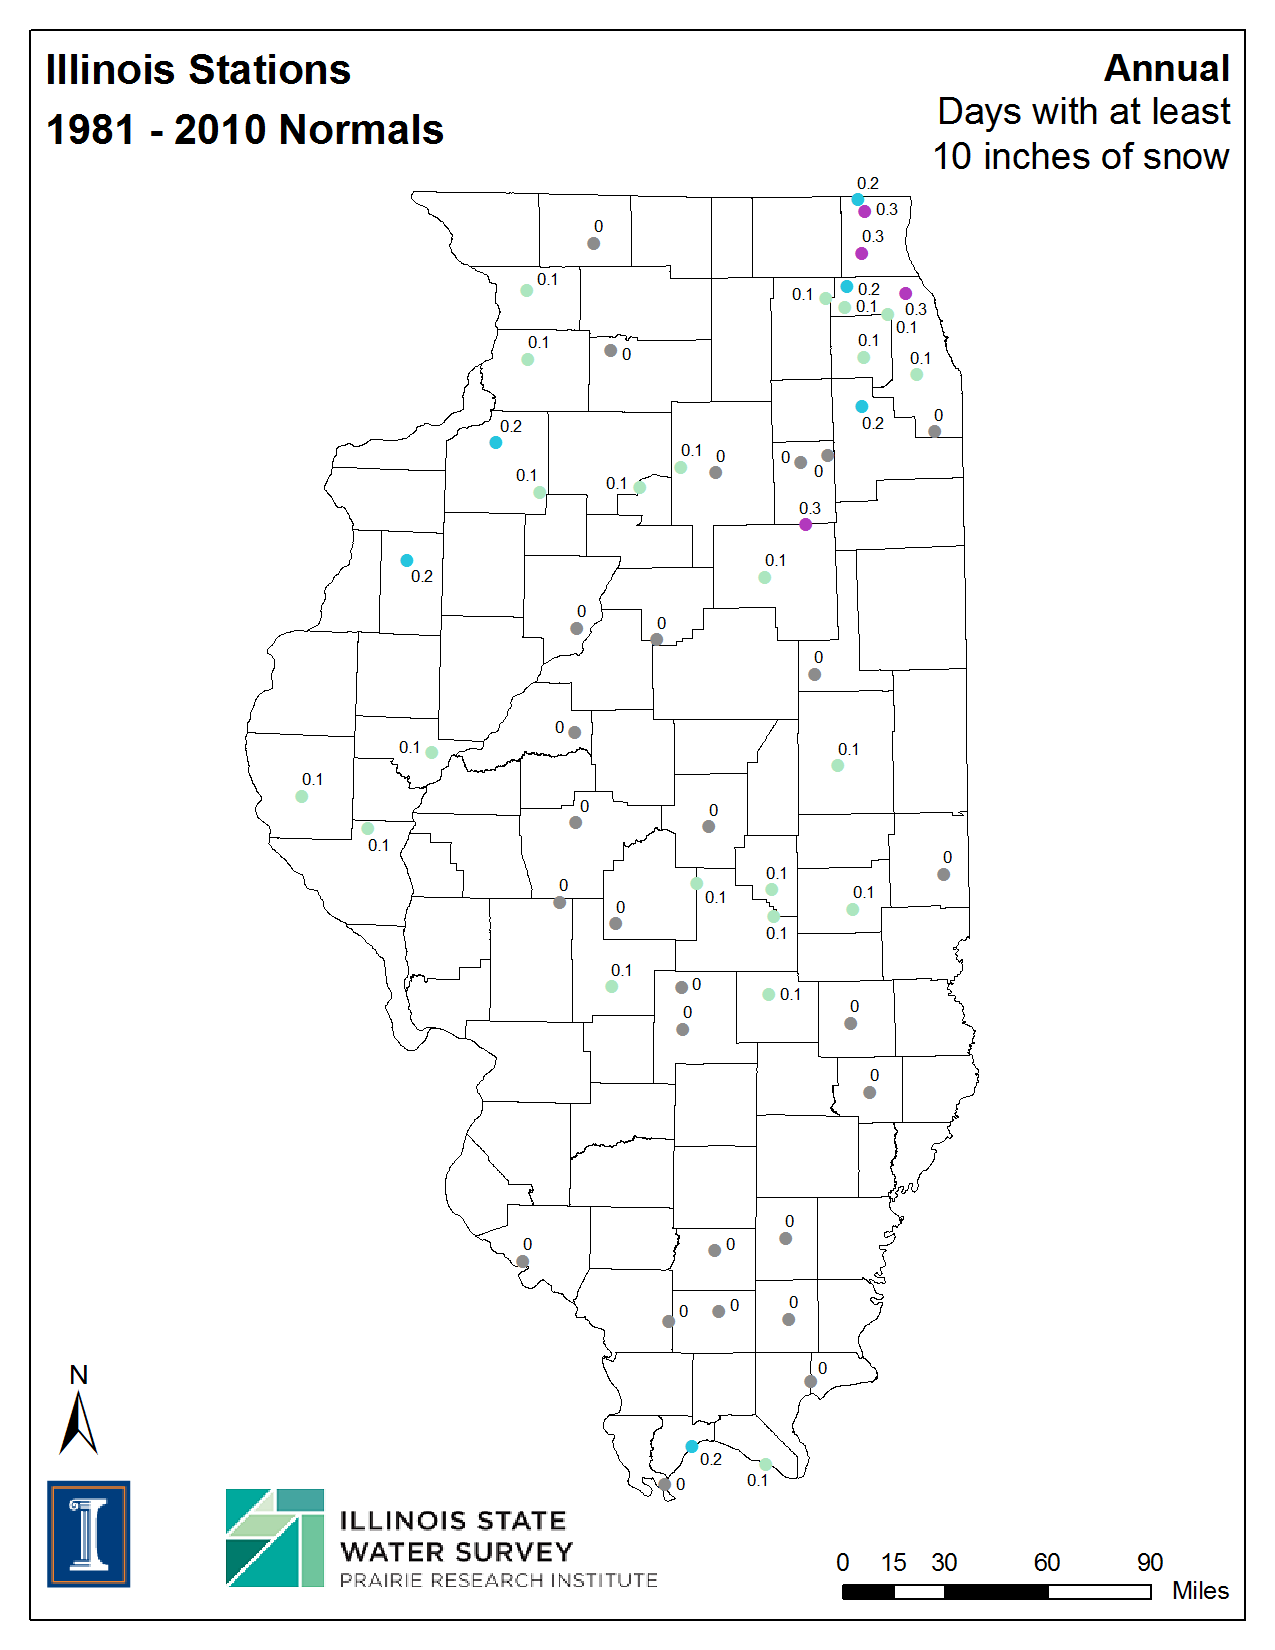
| Days with Snowfall Greater than 10.0 inches | ||||||
| Jan | Feb | Mar | Apr | May | Jun | |
| Jul | Aug | Sep | Oct | Nov | Dec | Annual |
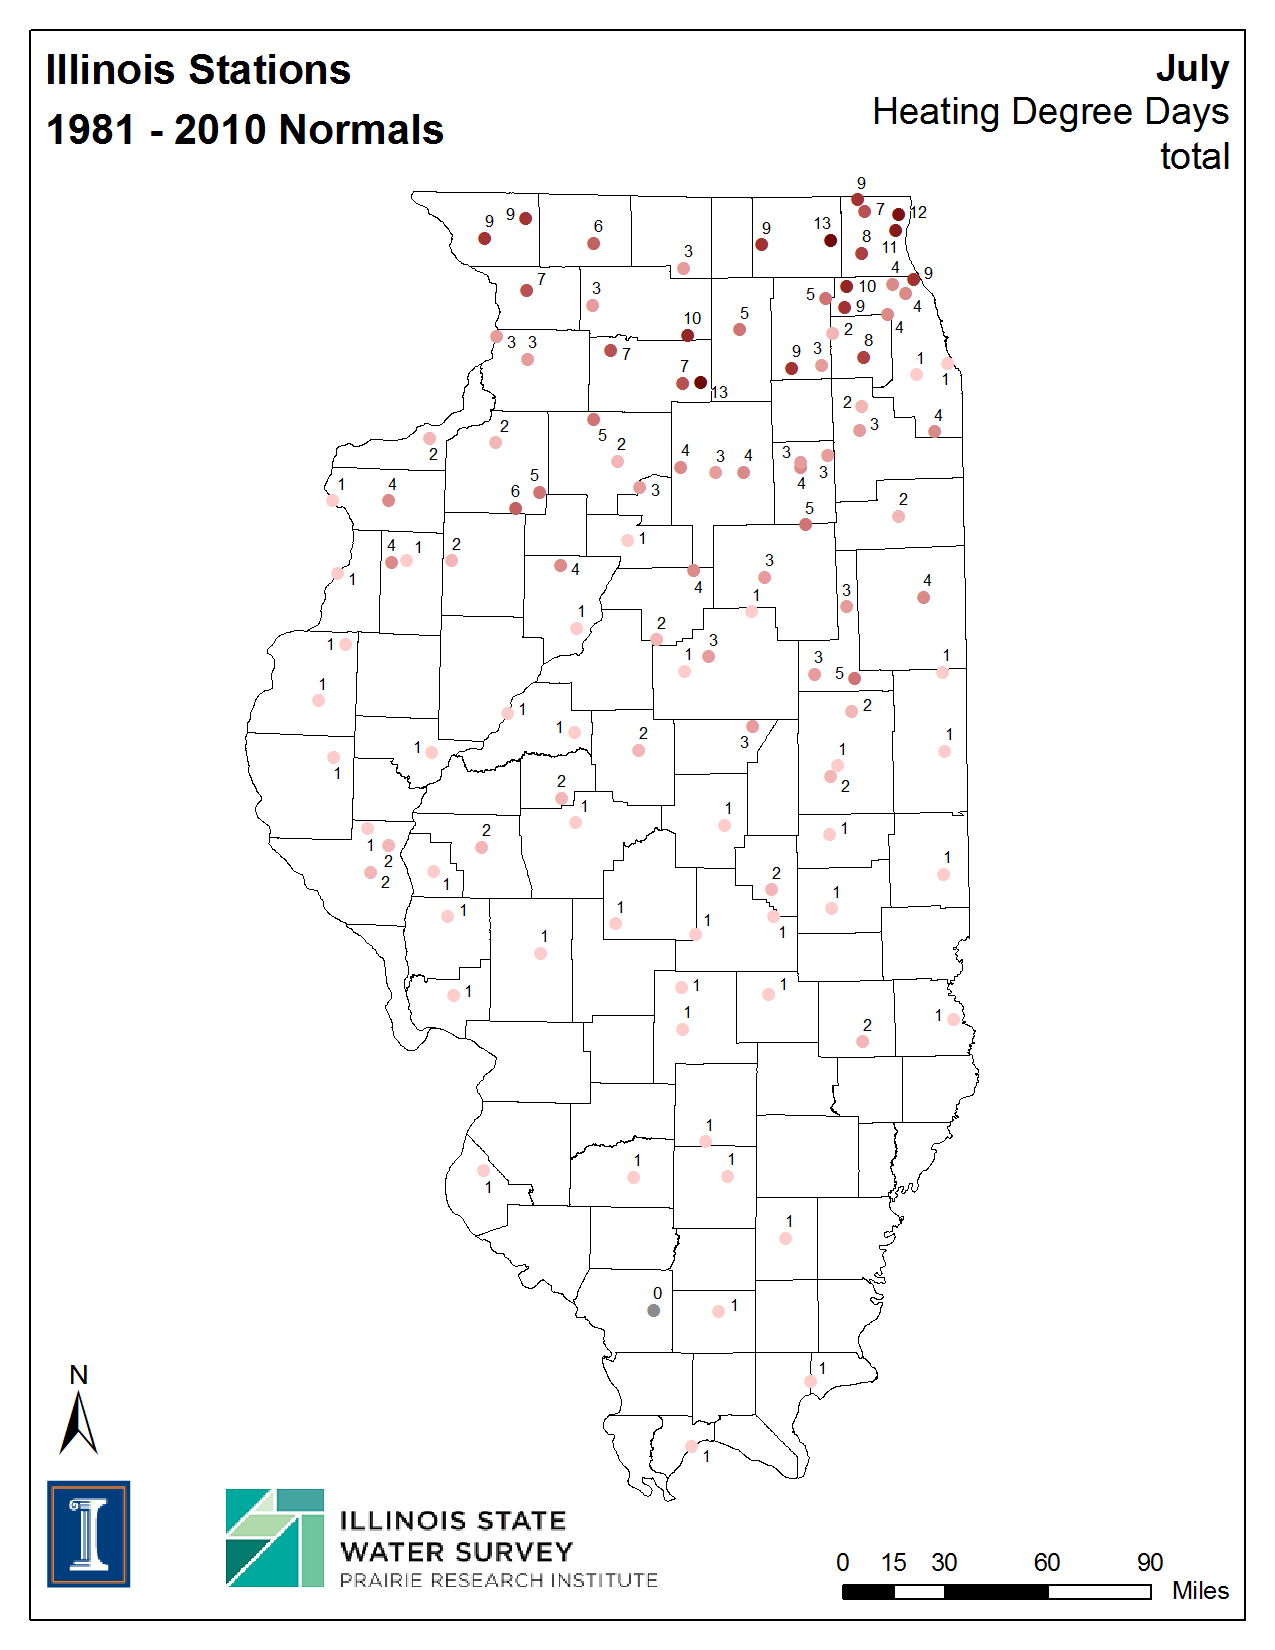
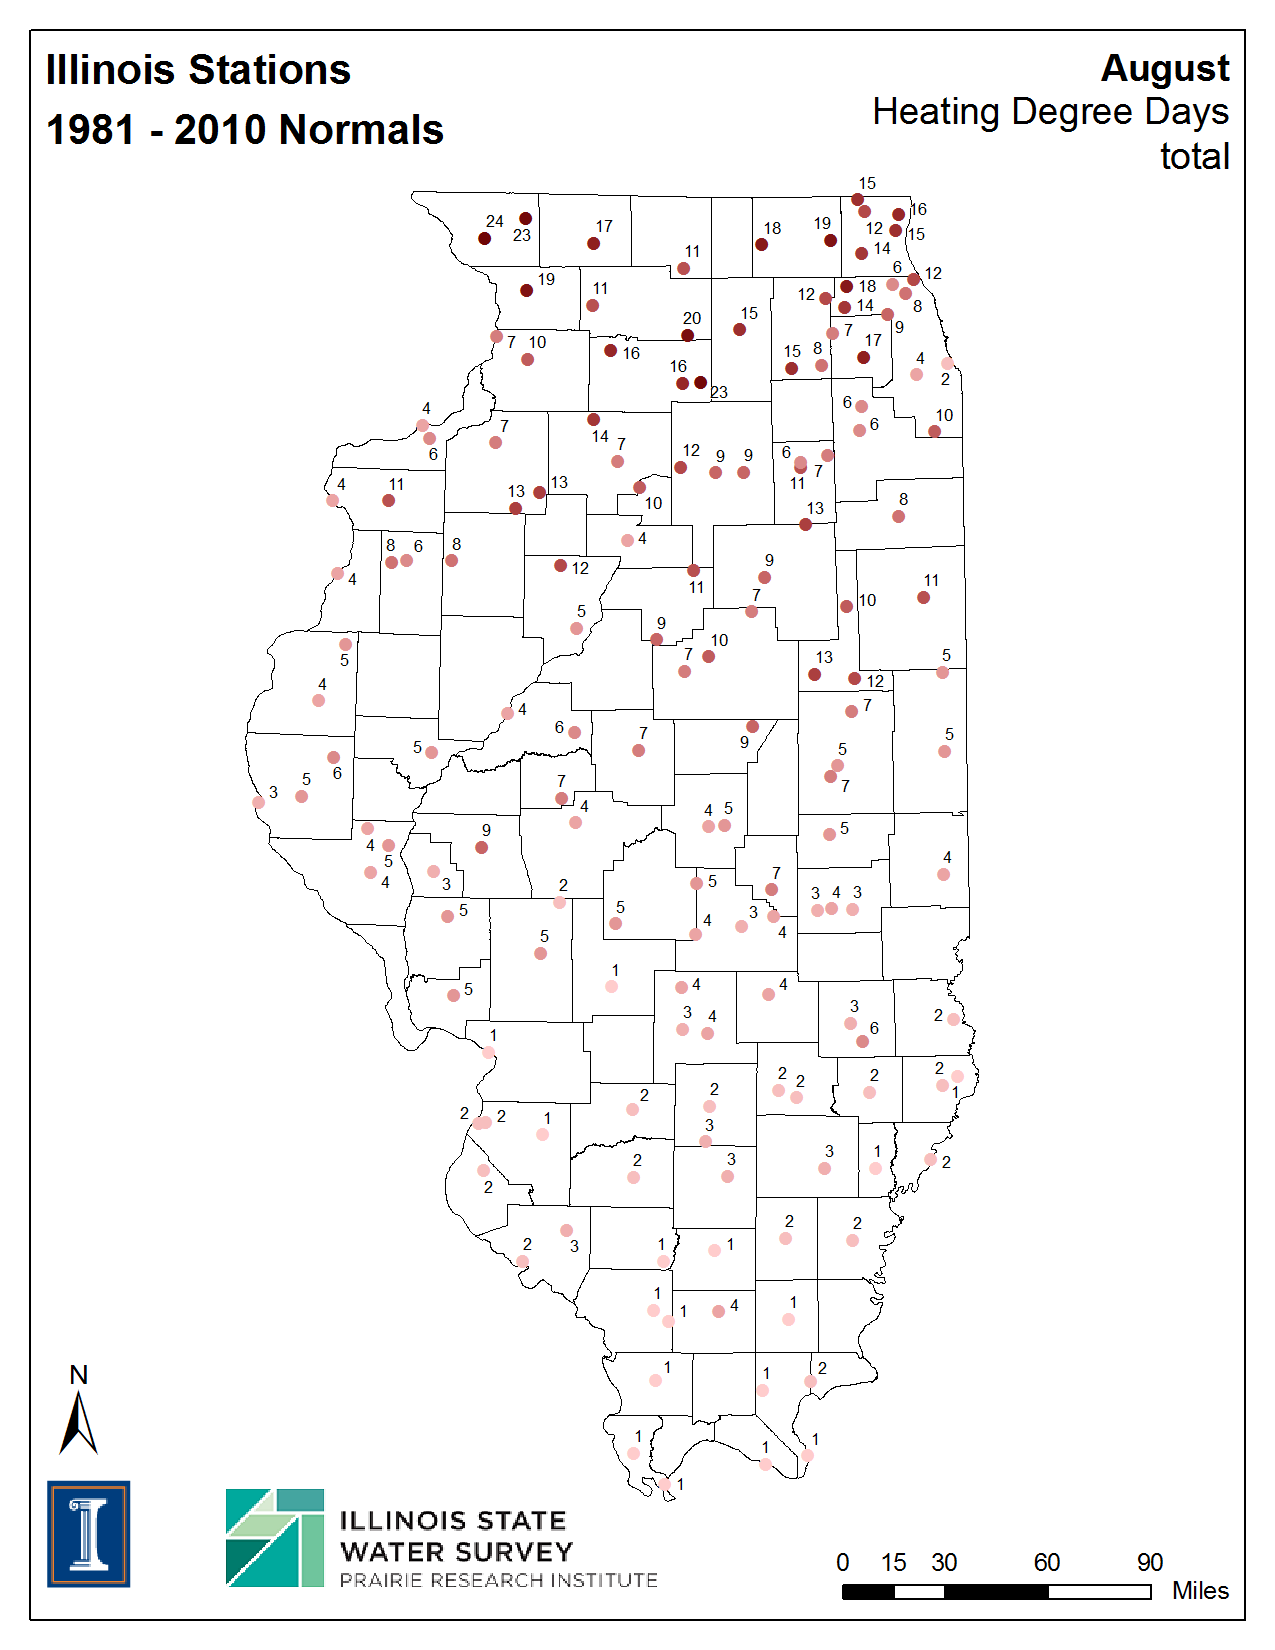
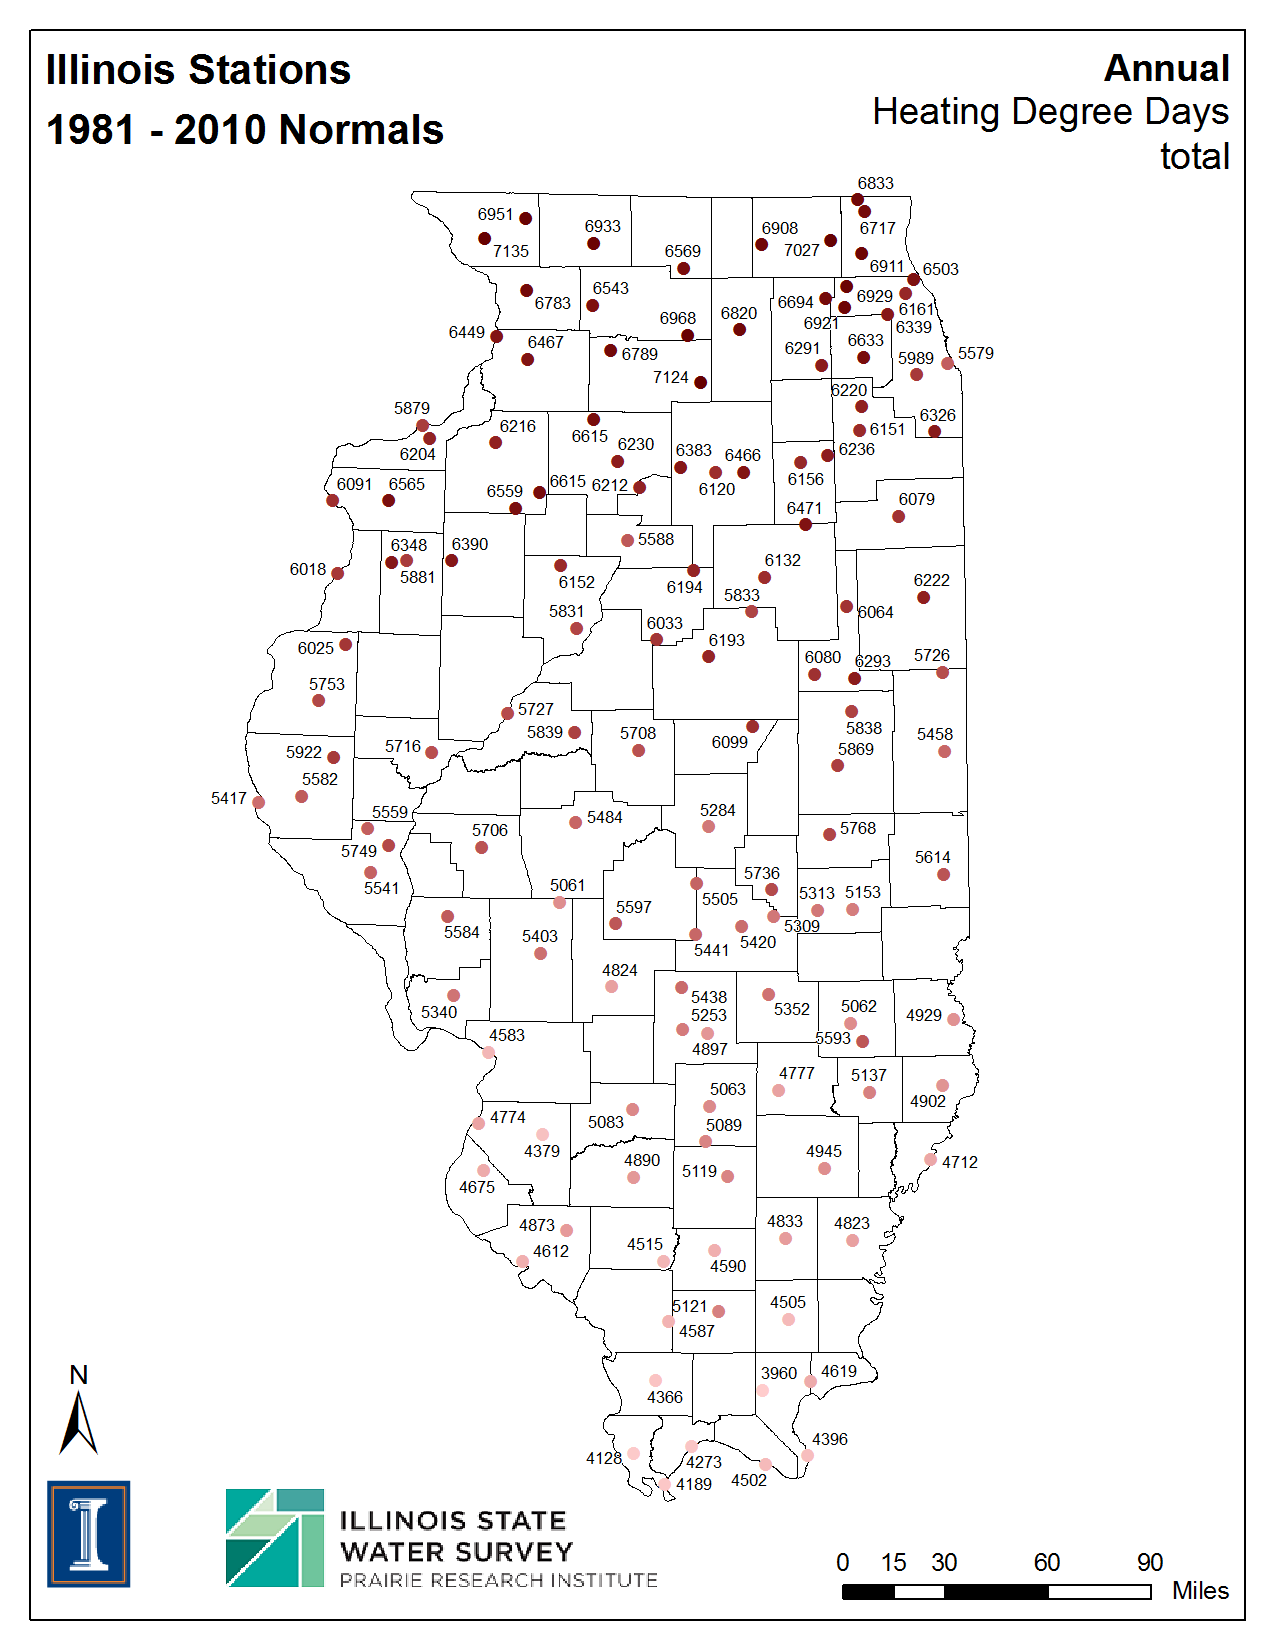
| Heating Degree Days | ||||||
| Jan | Feb | Mar | Apr | May | Jun | |
| Jul | Aug | Sep | Oct | Nov | Dec | Annual |
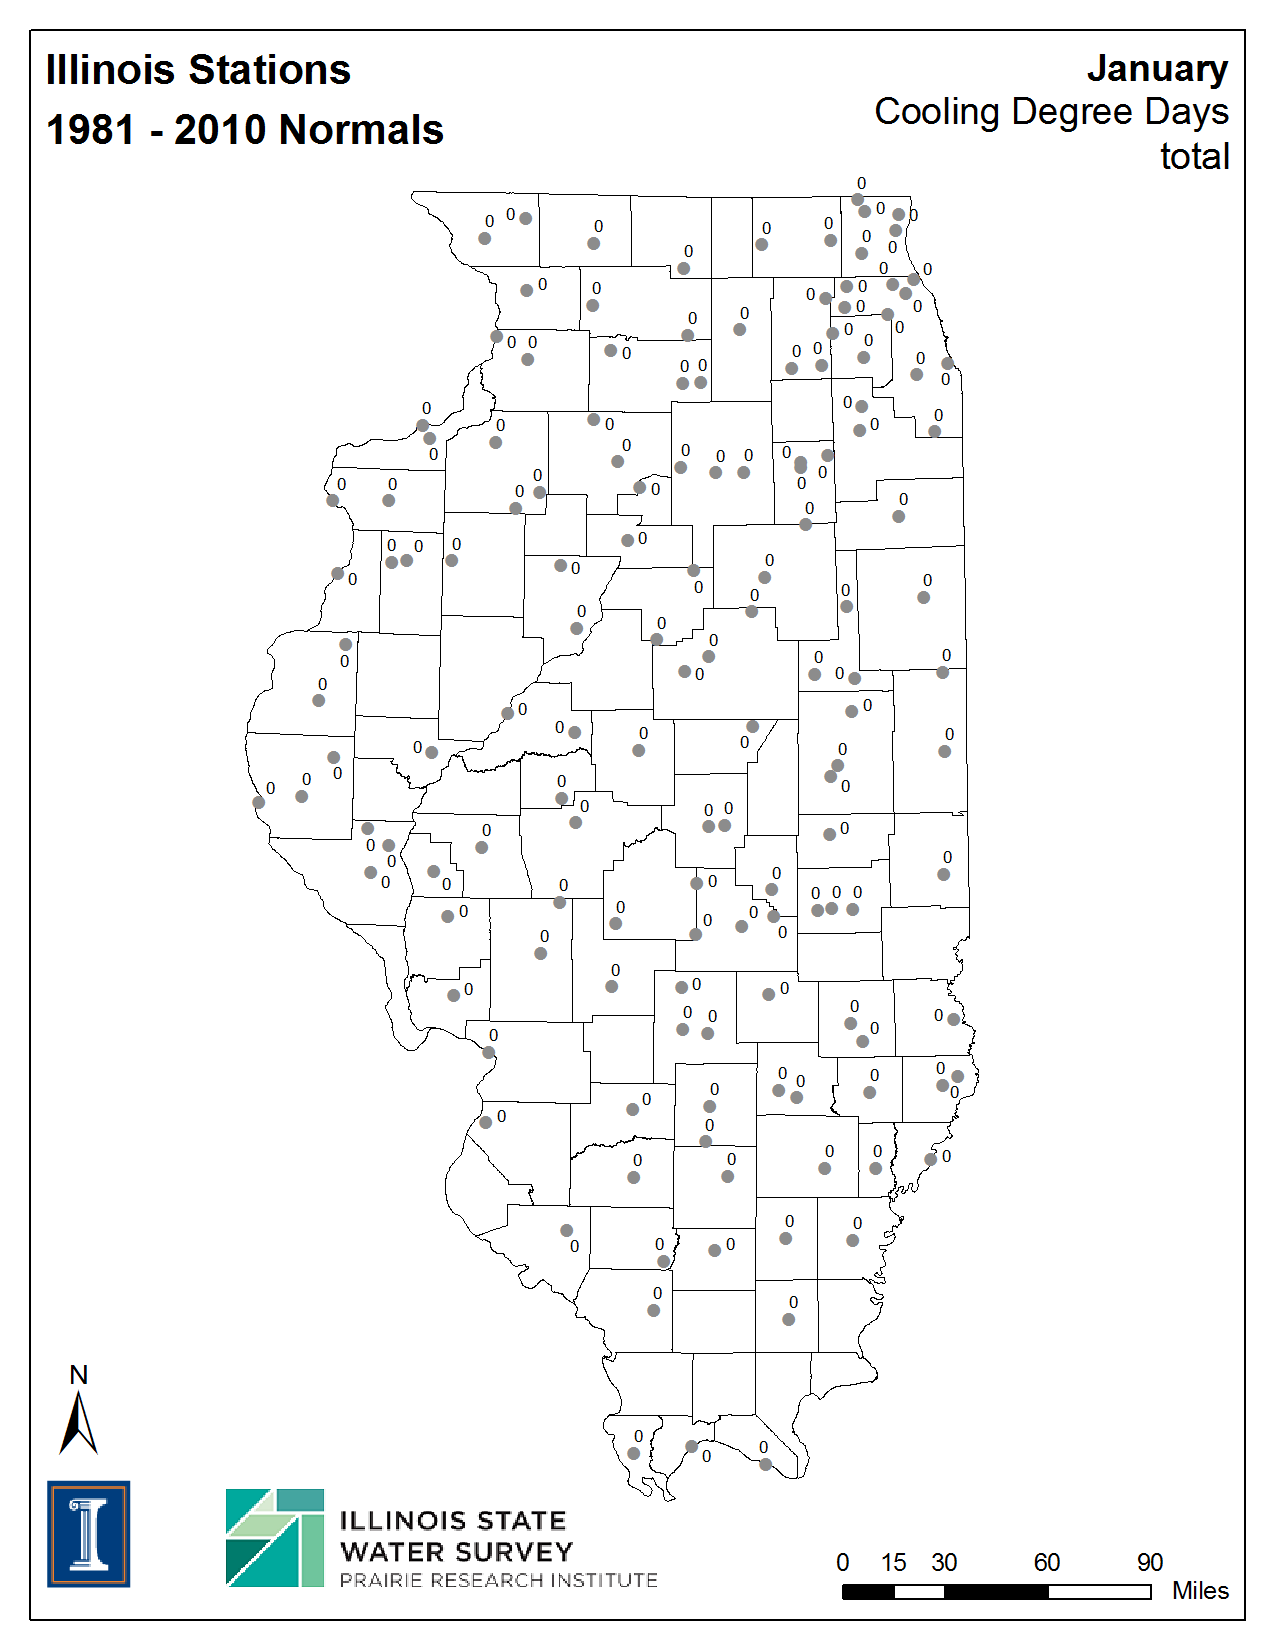
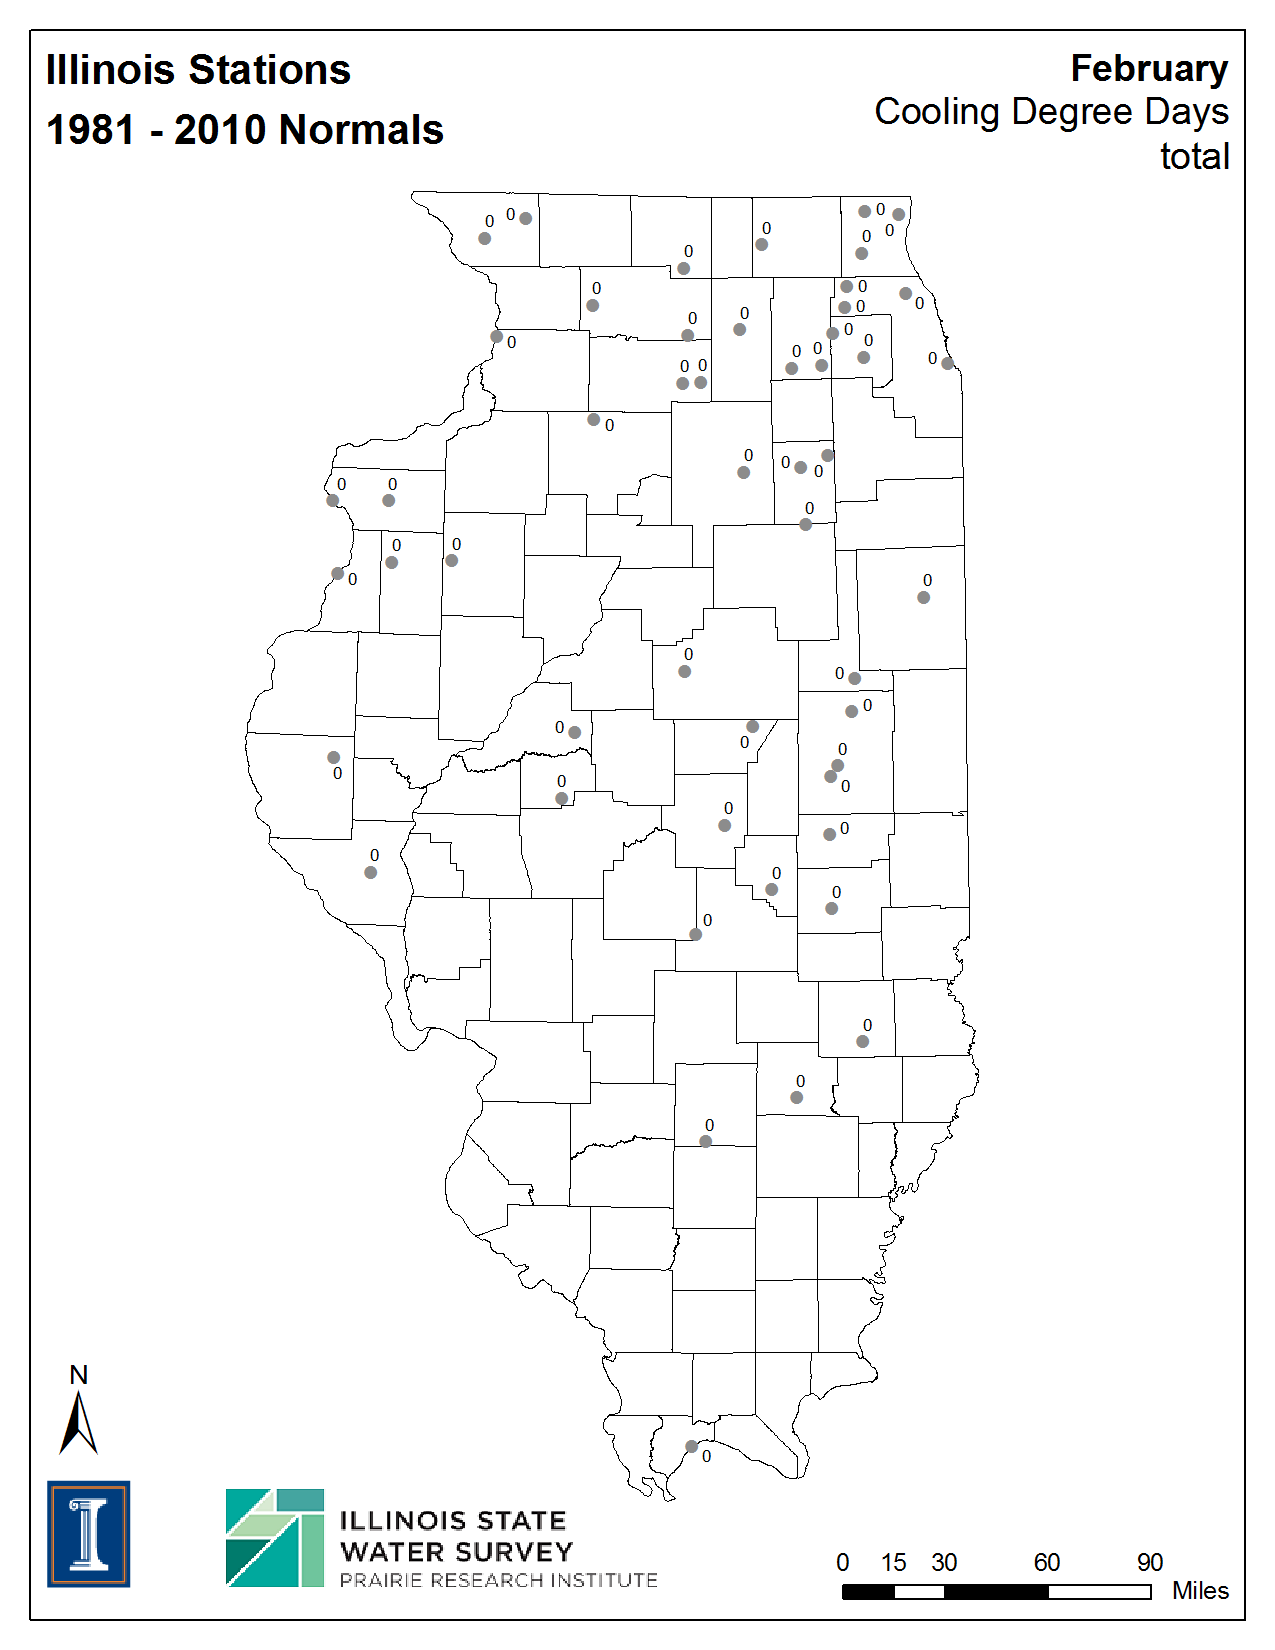
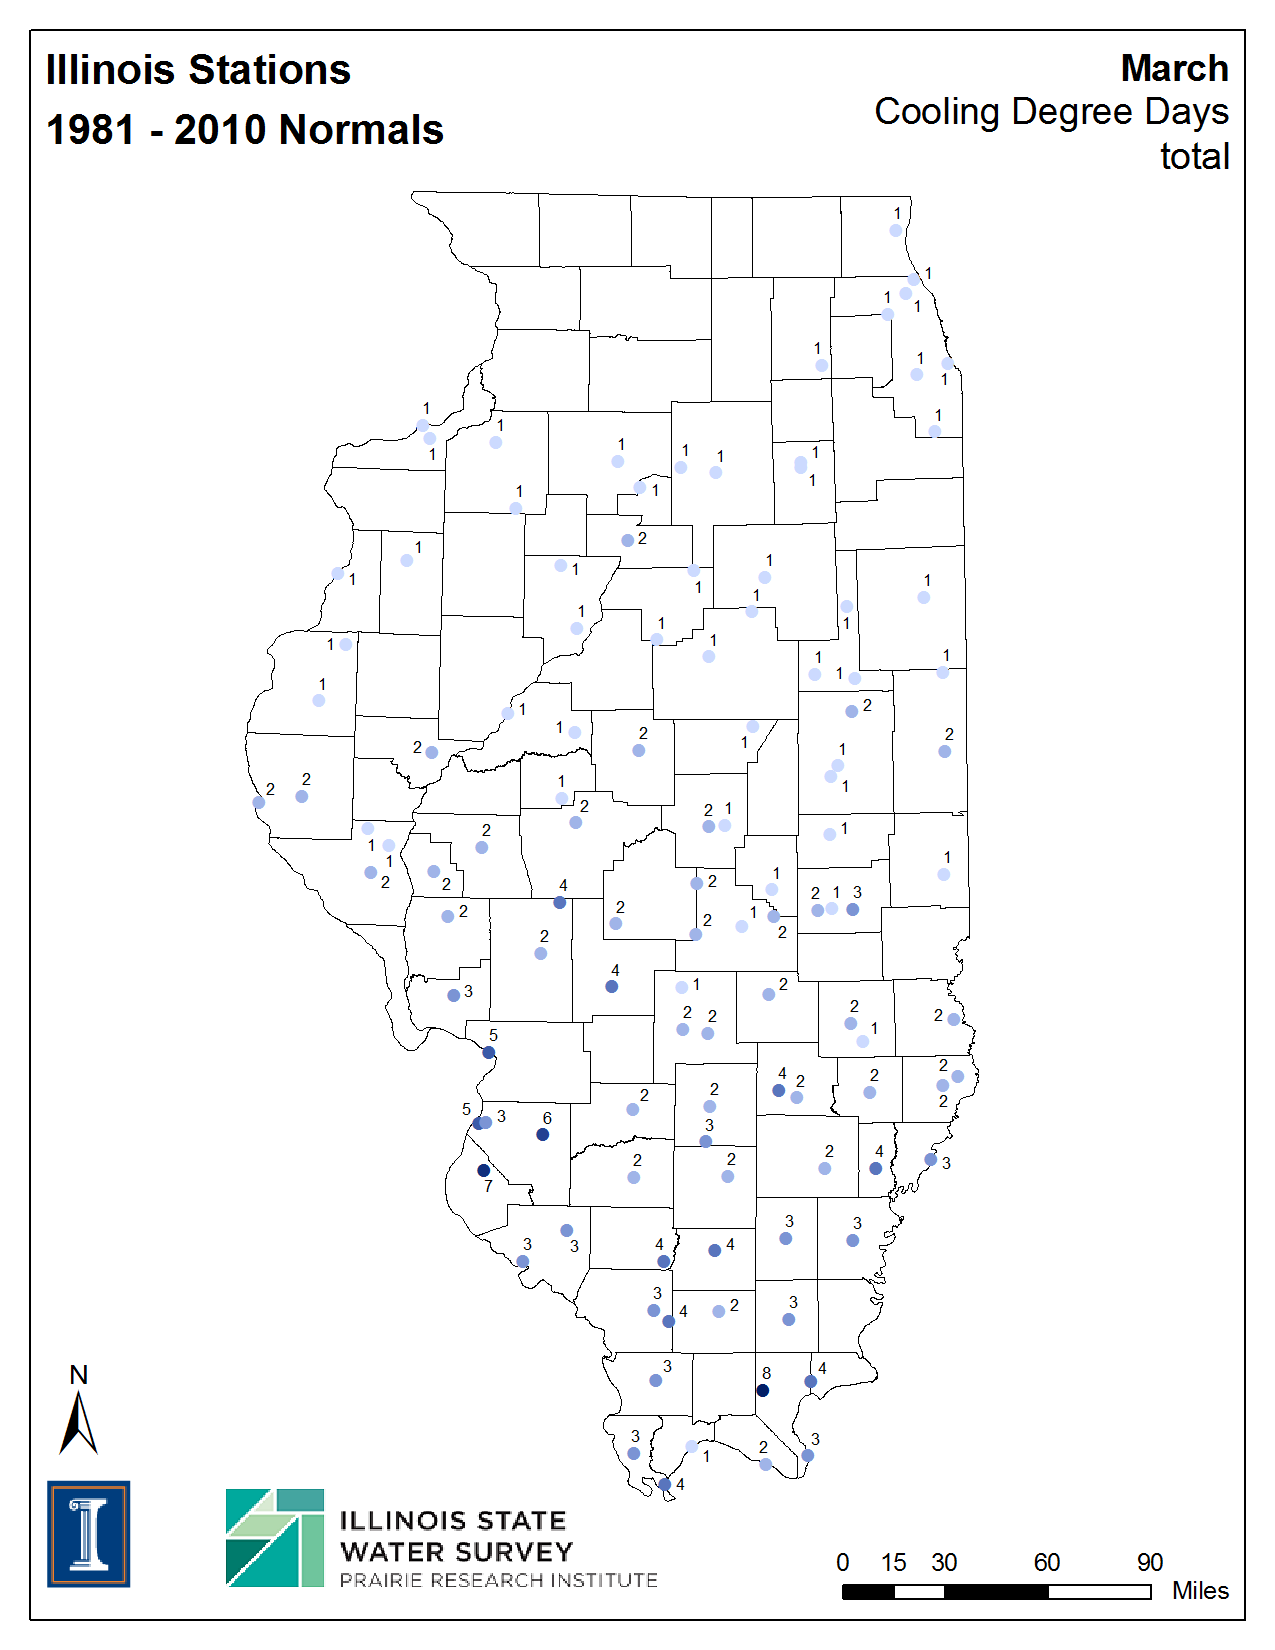
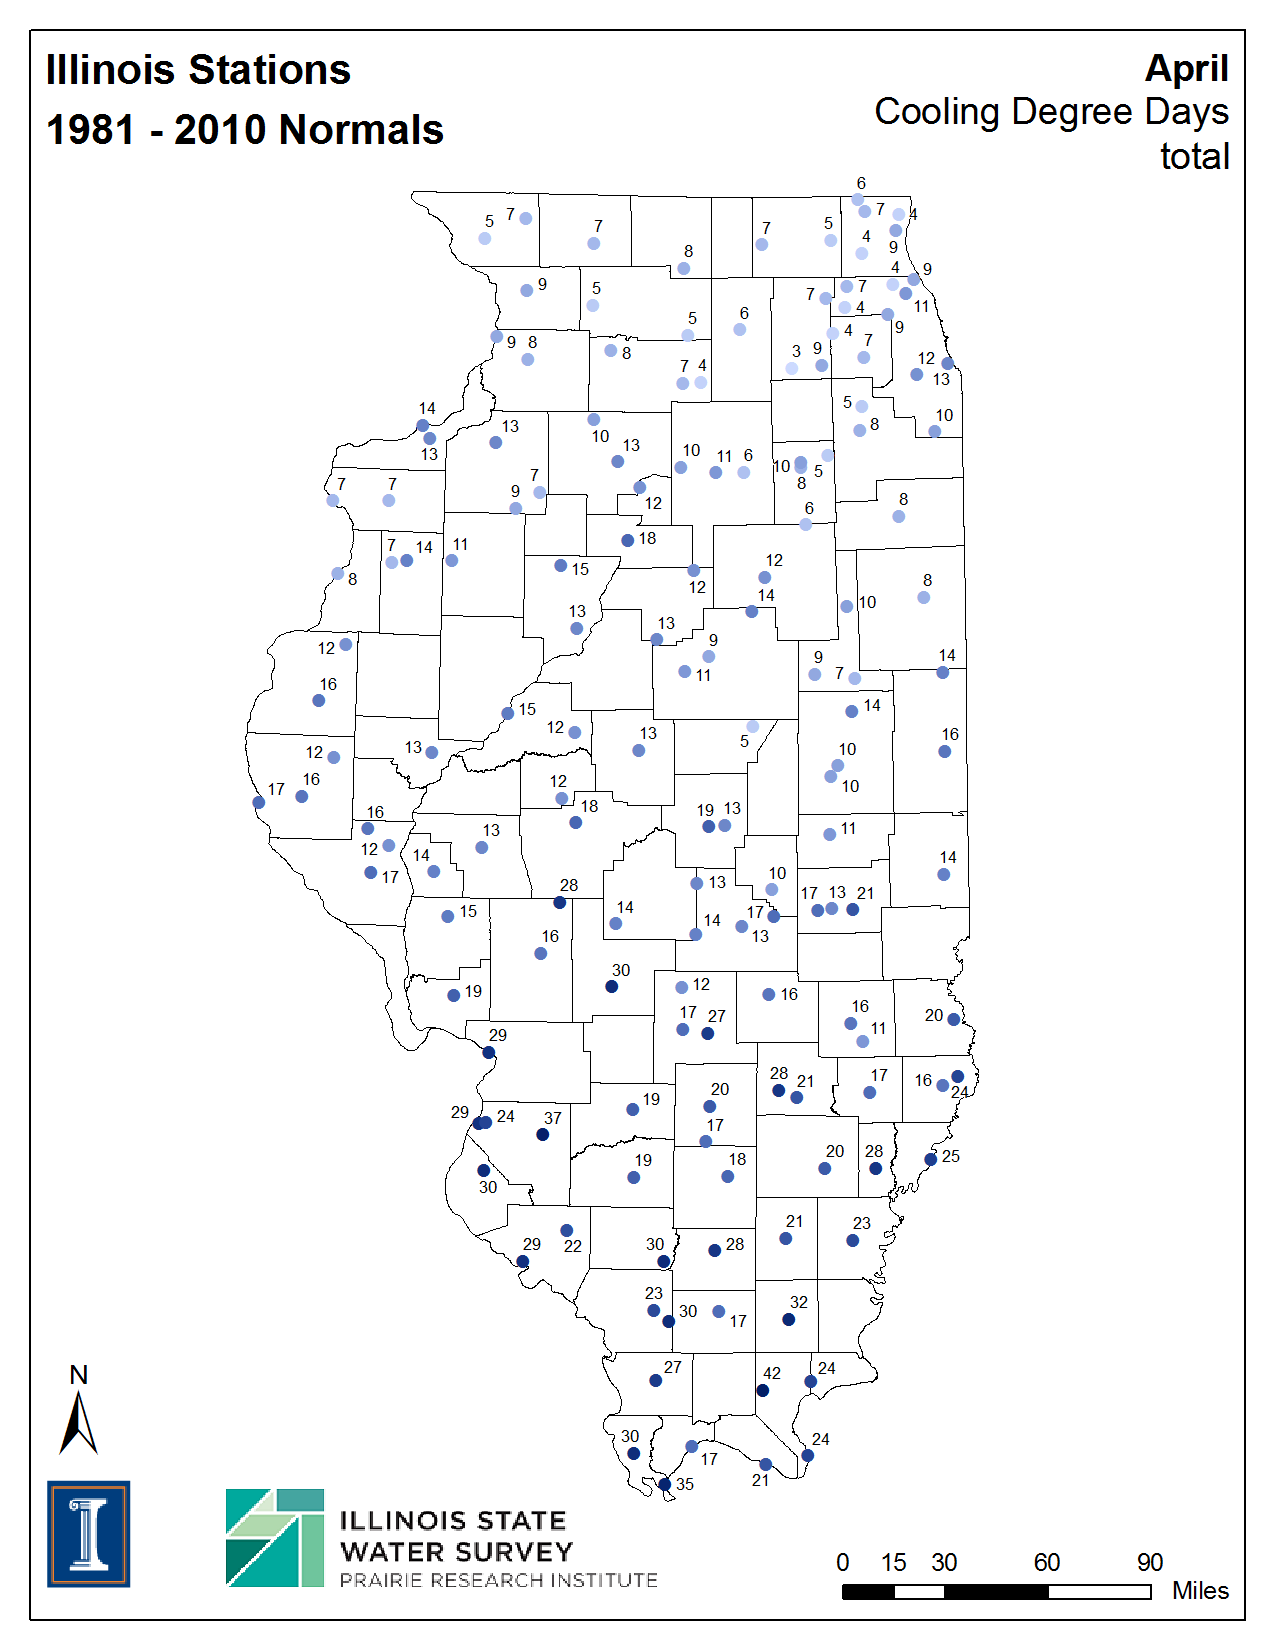
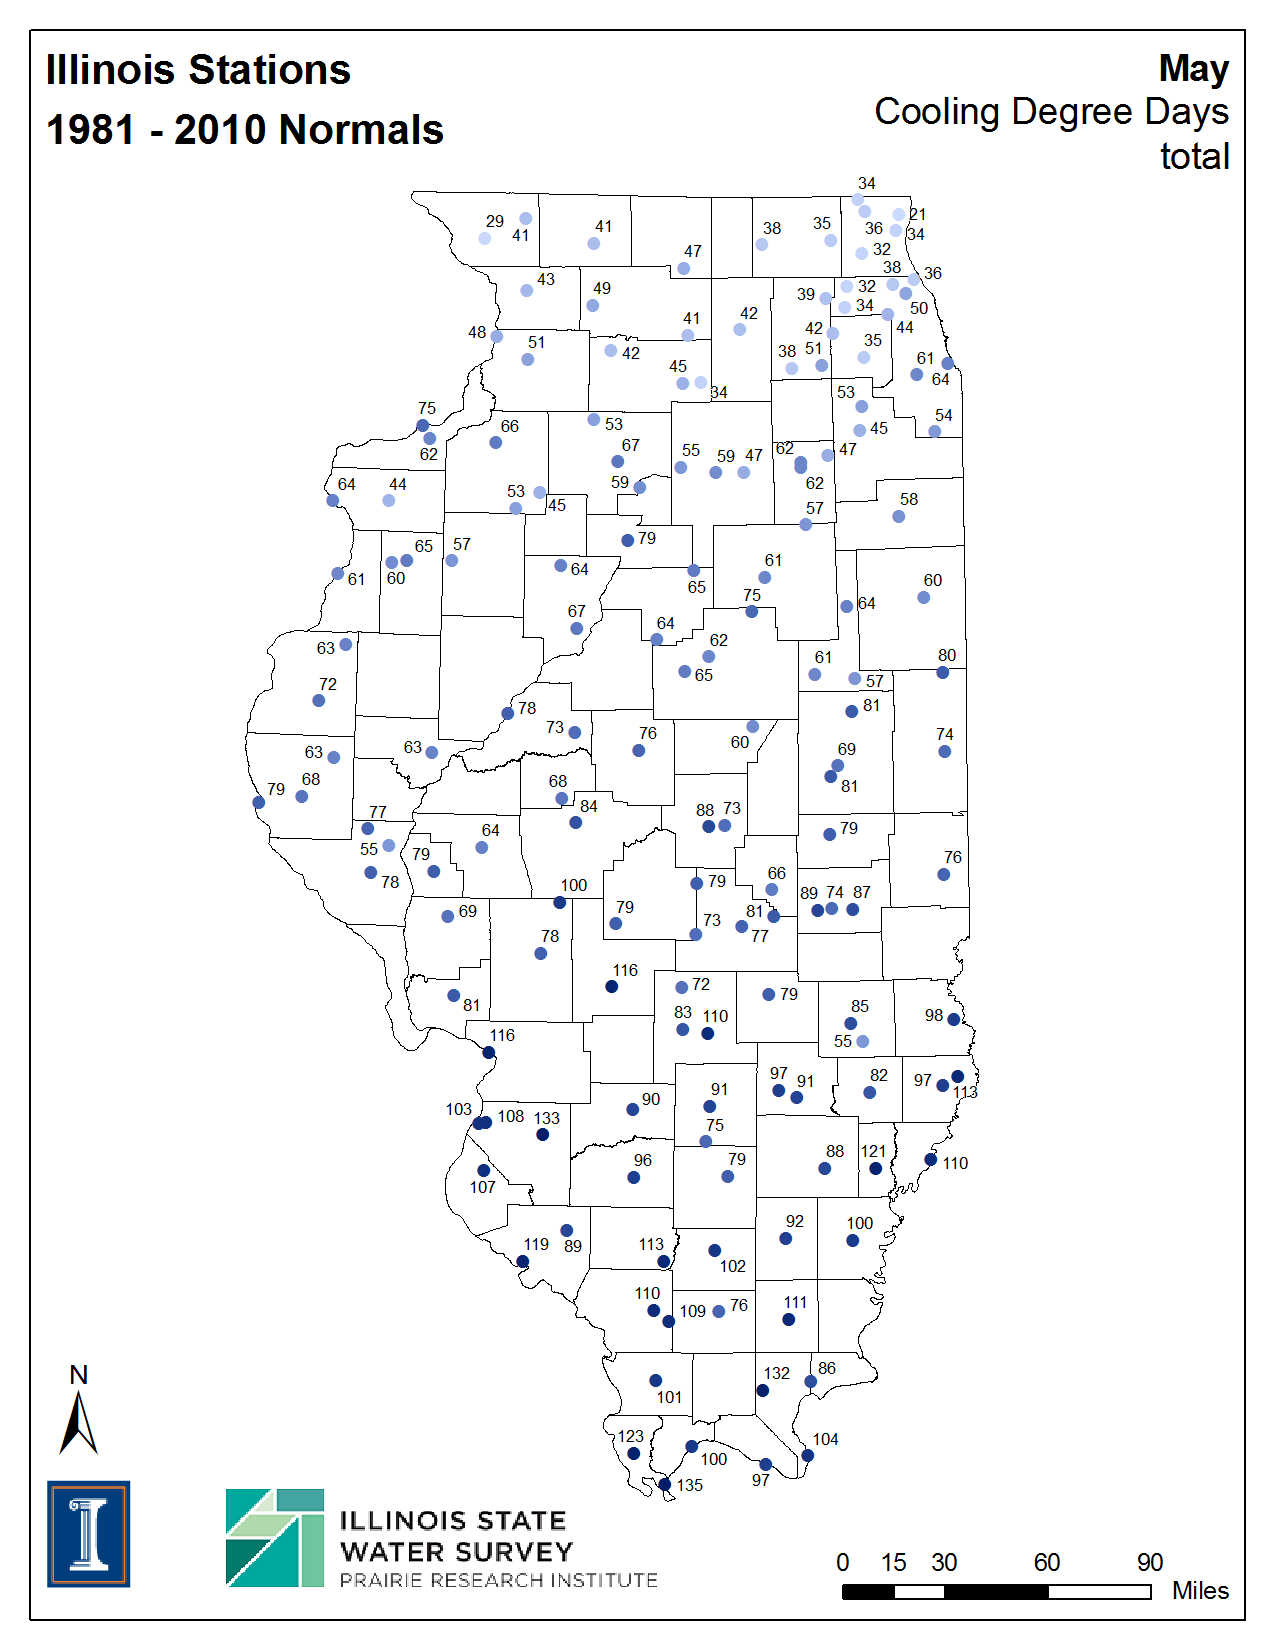
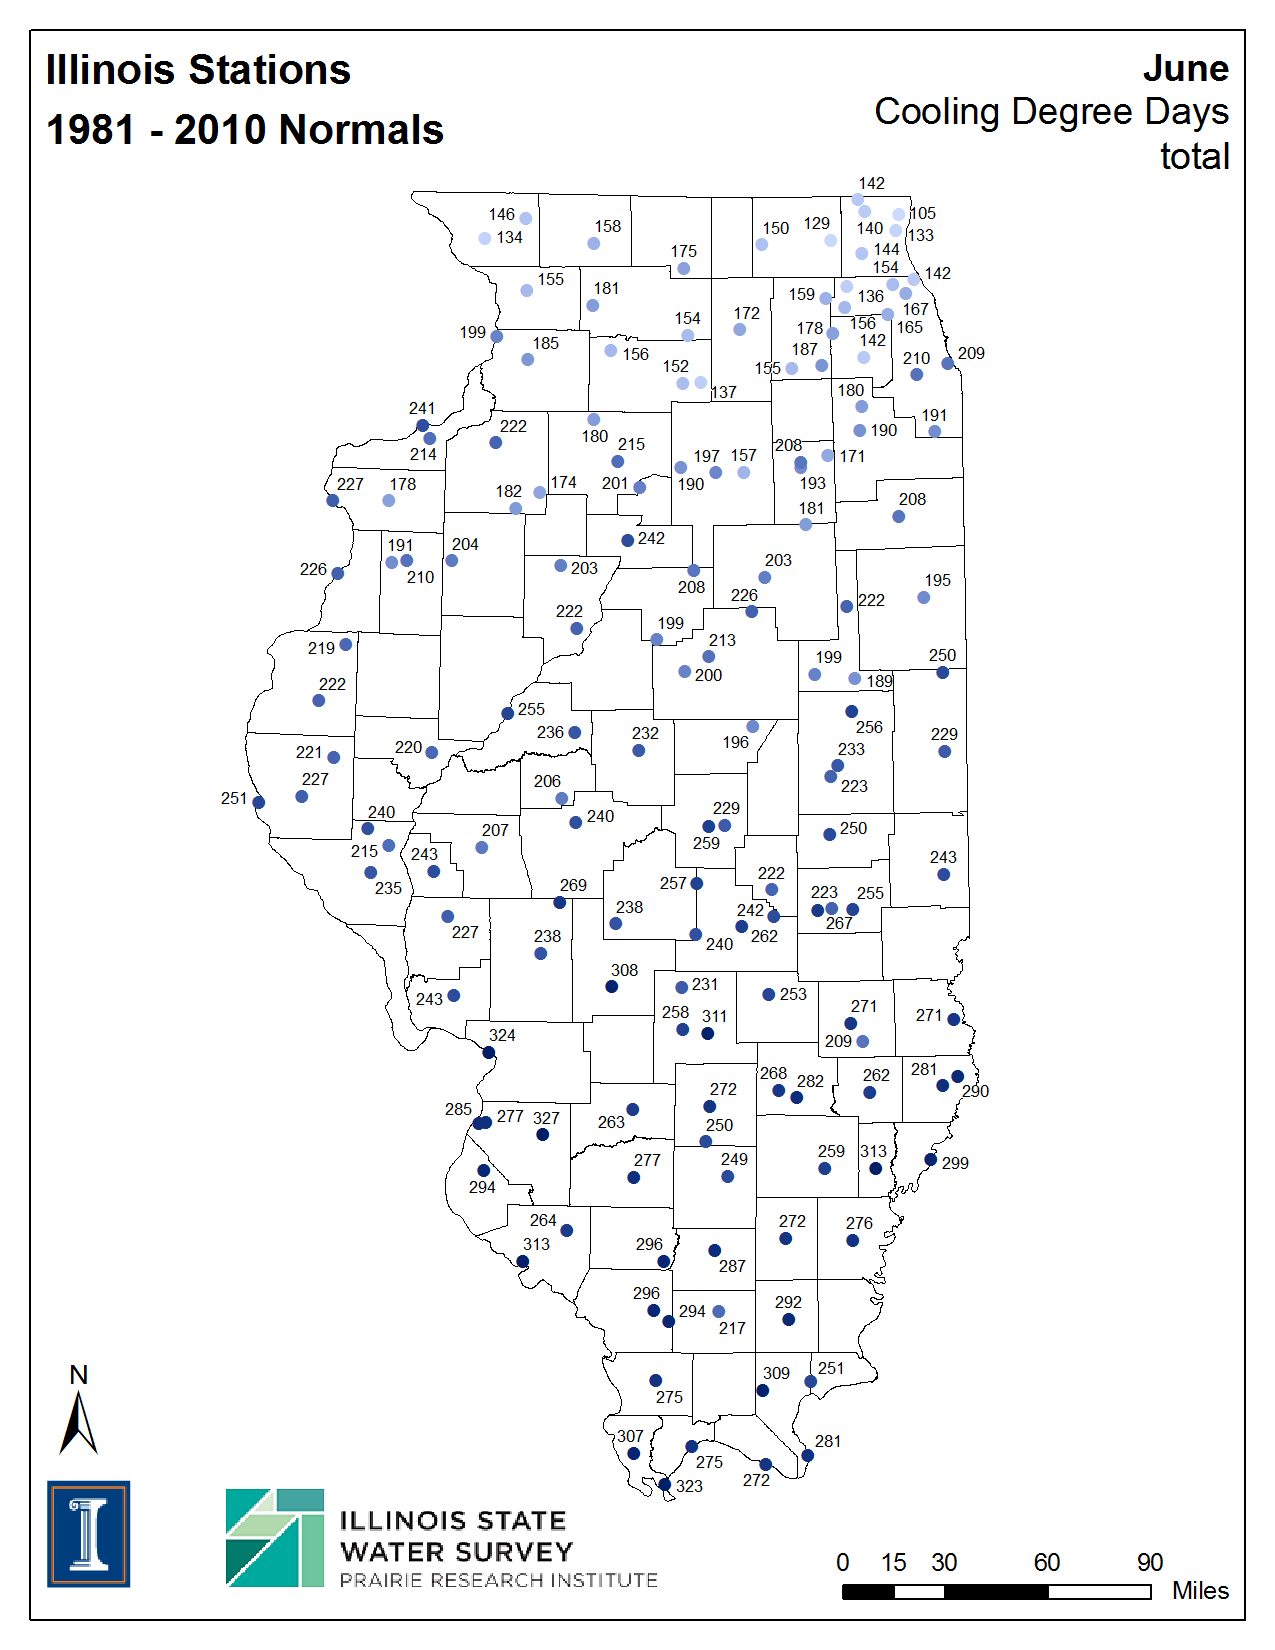
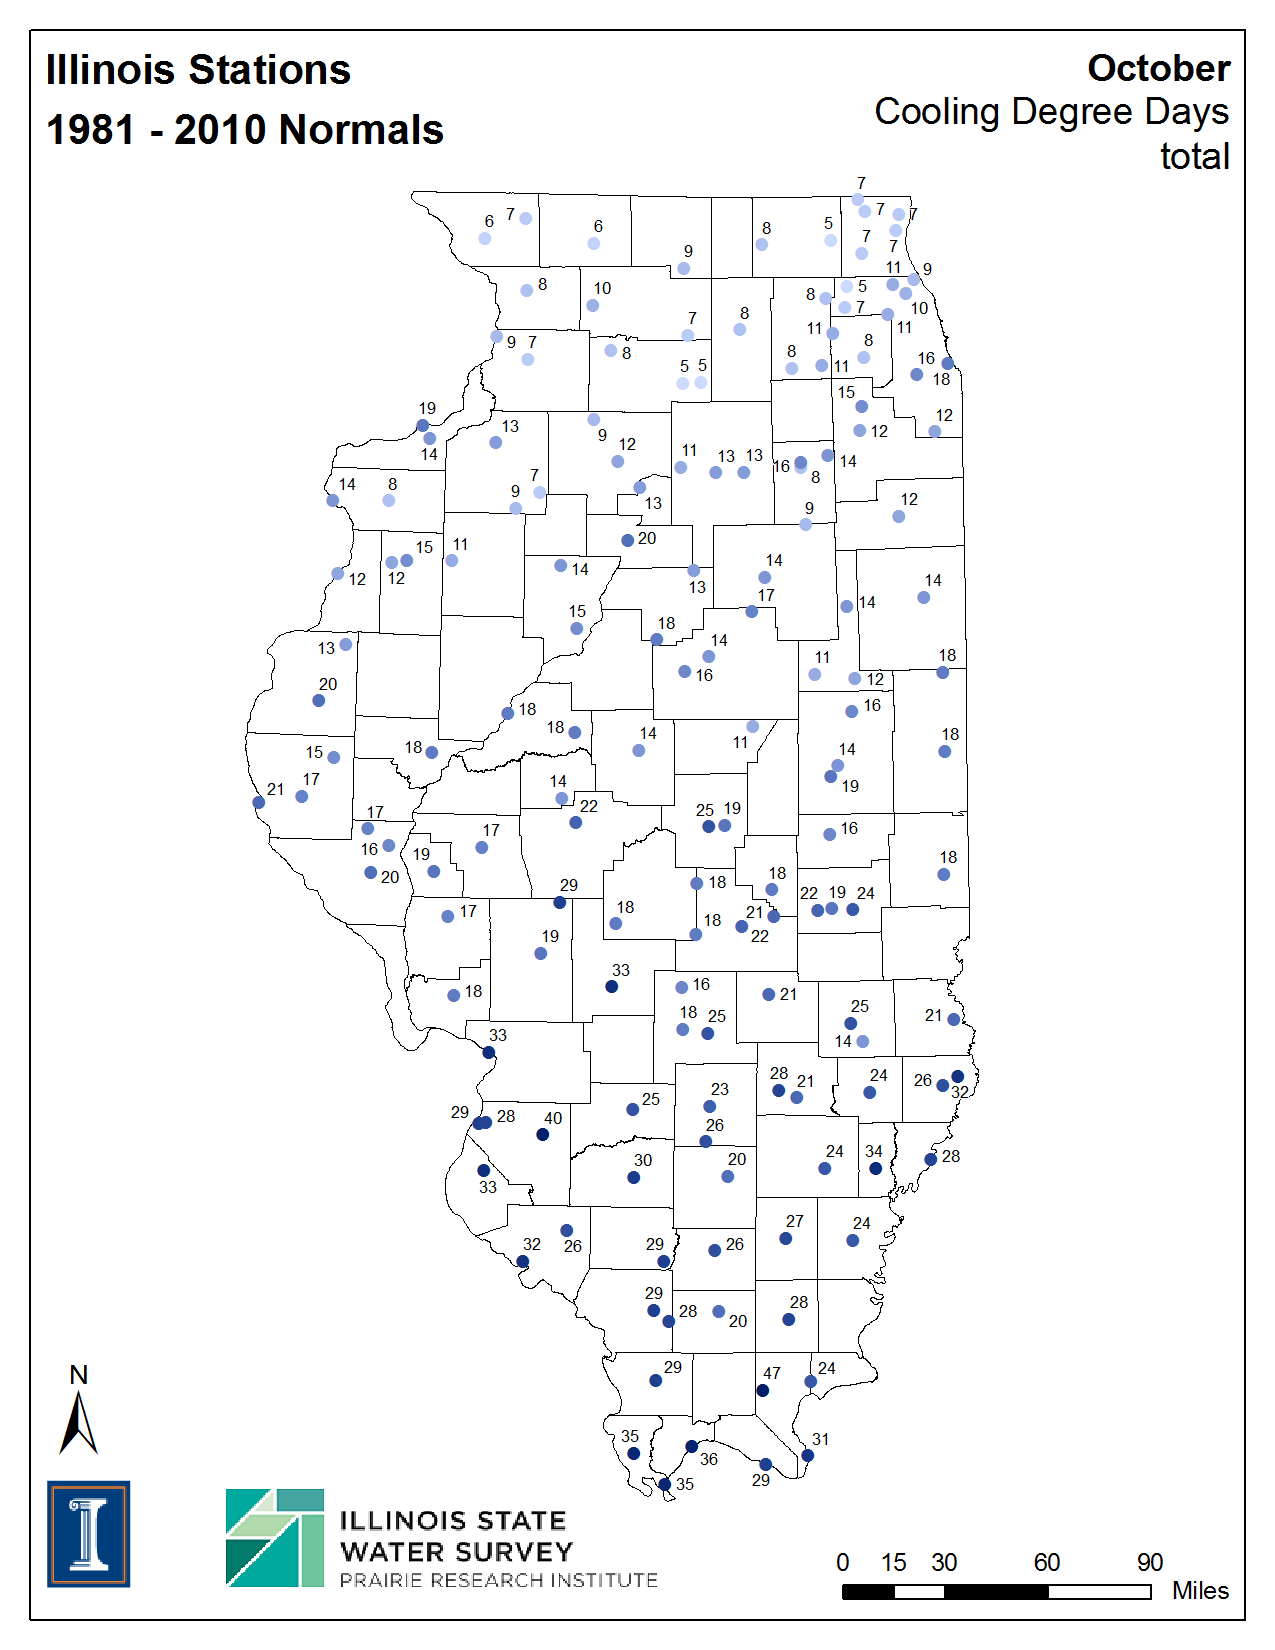
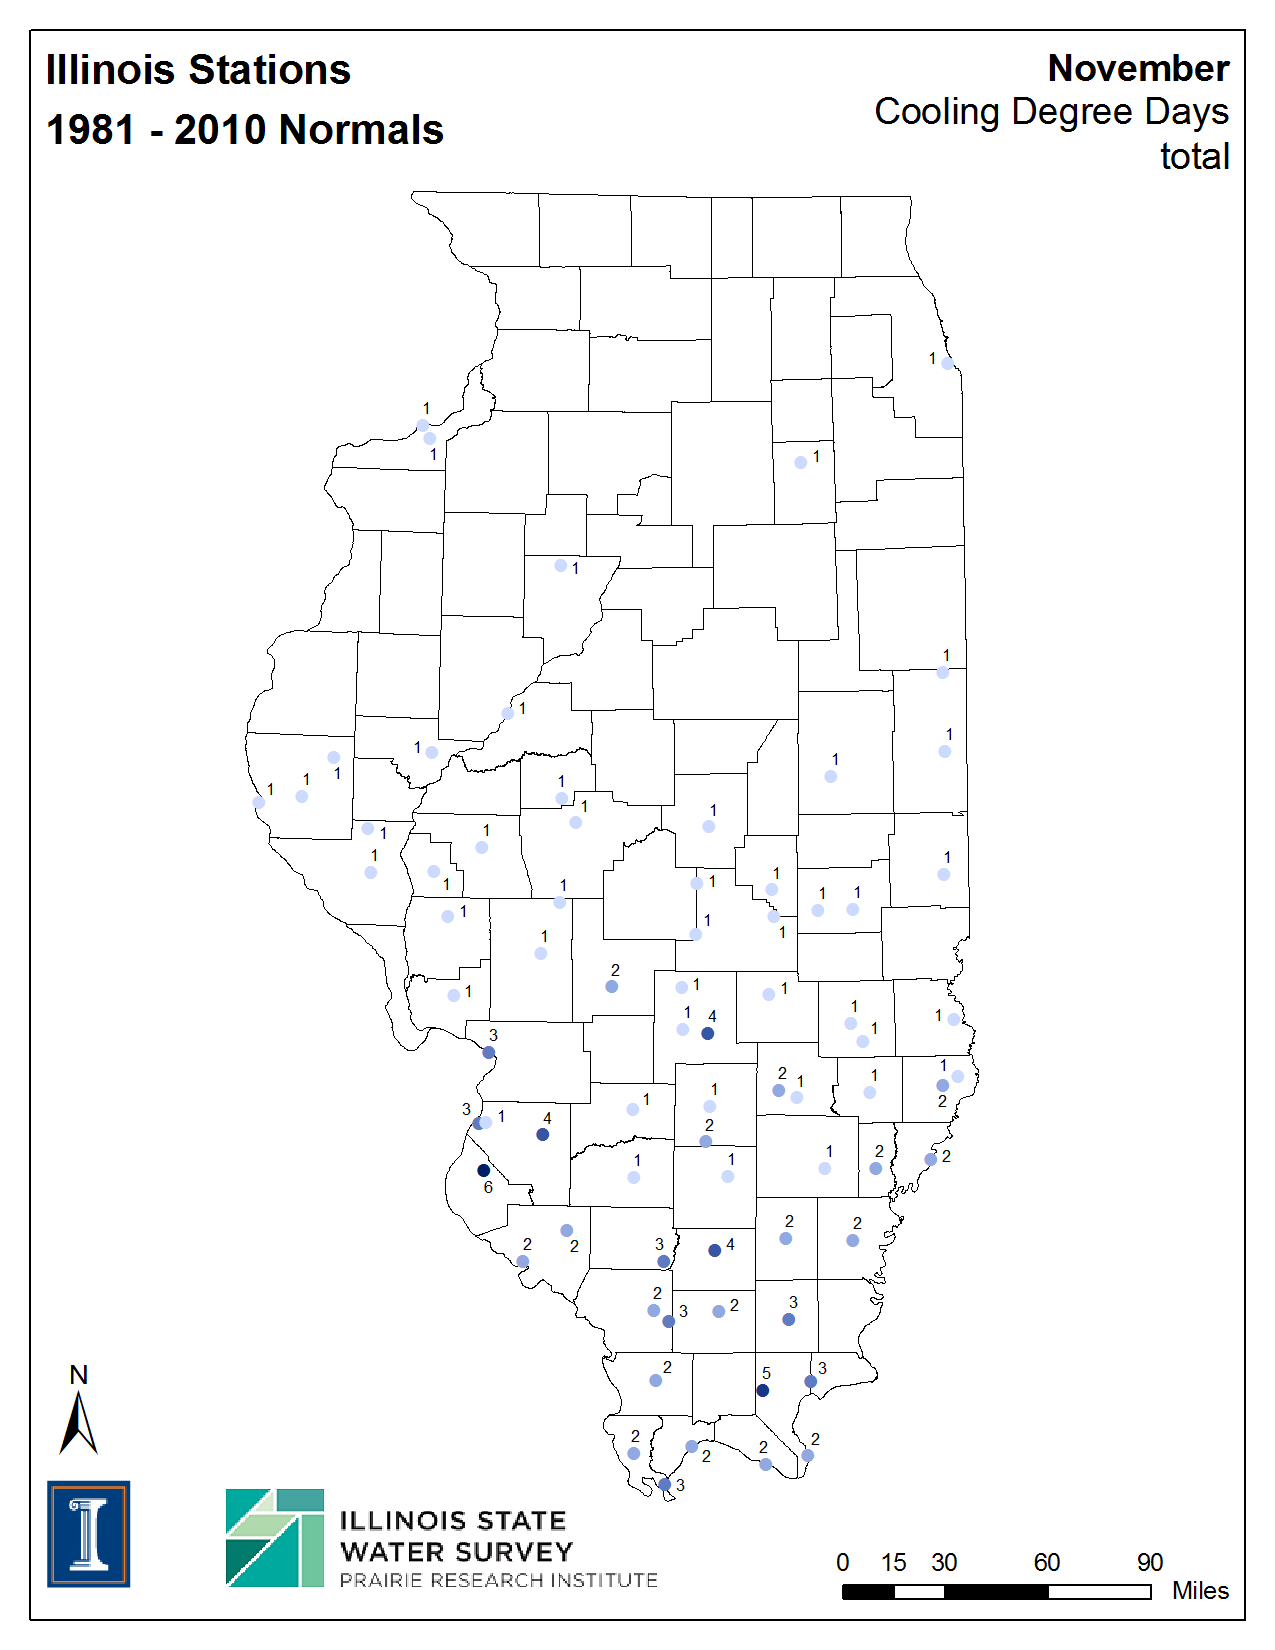
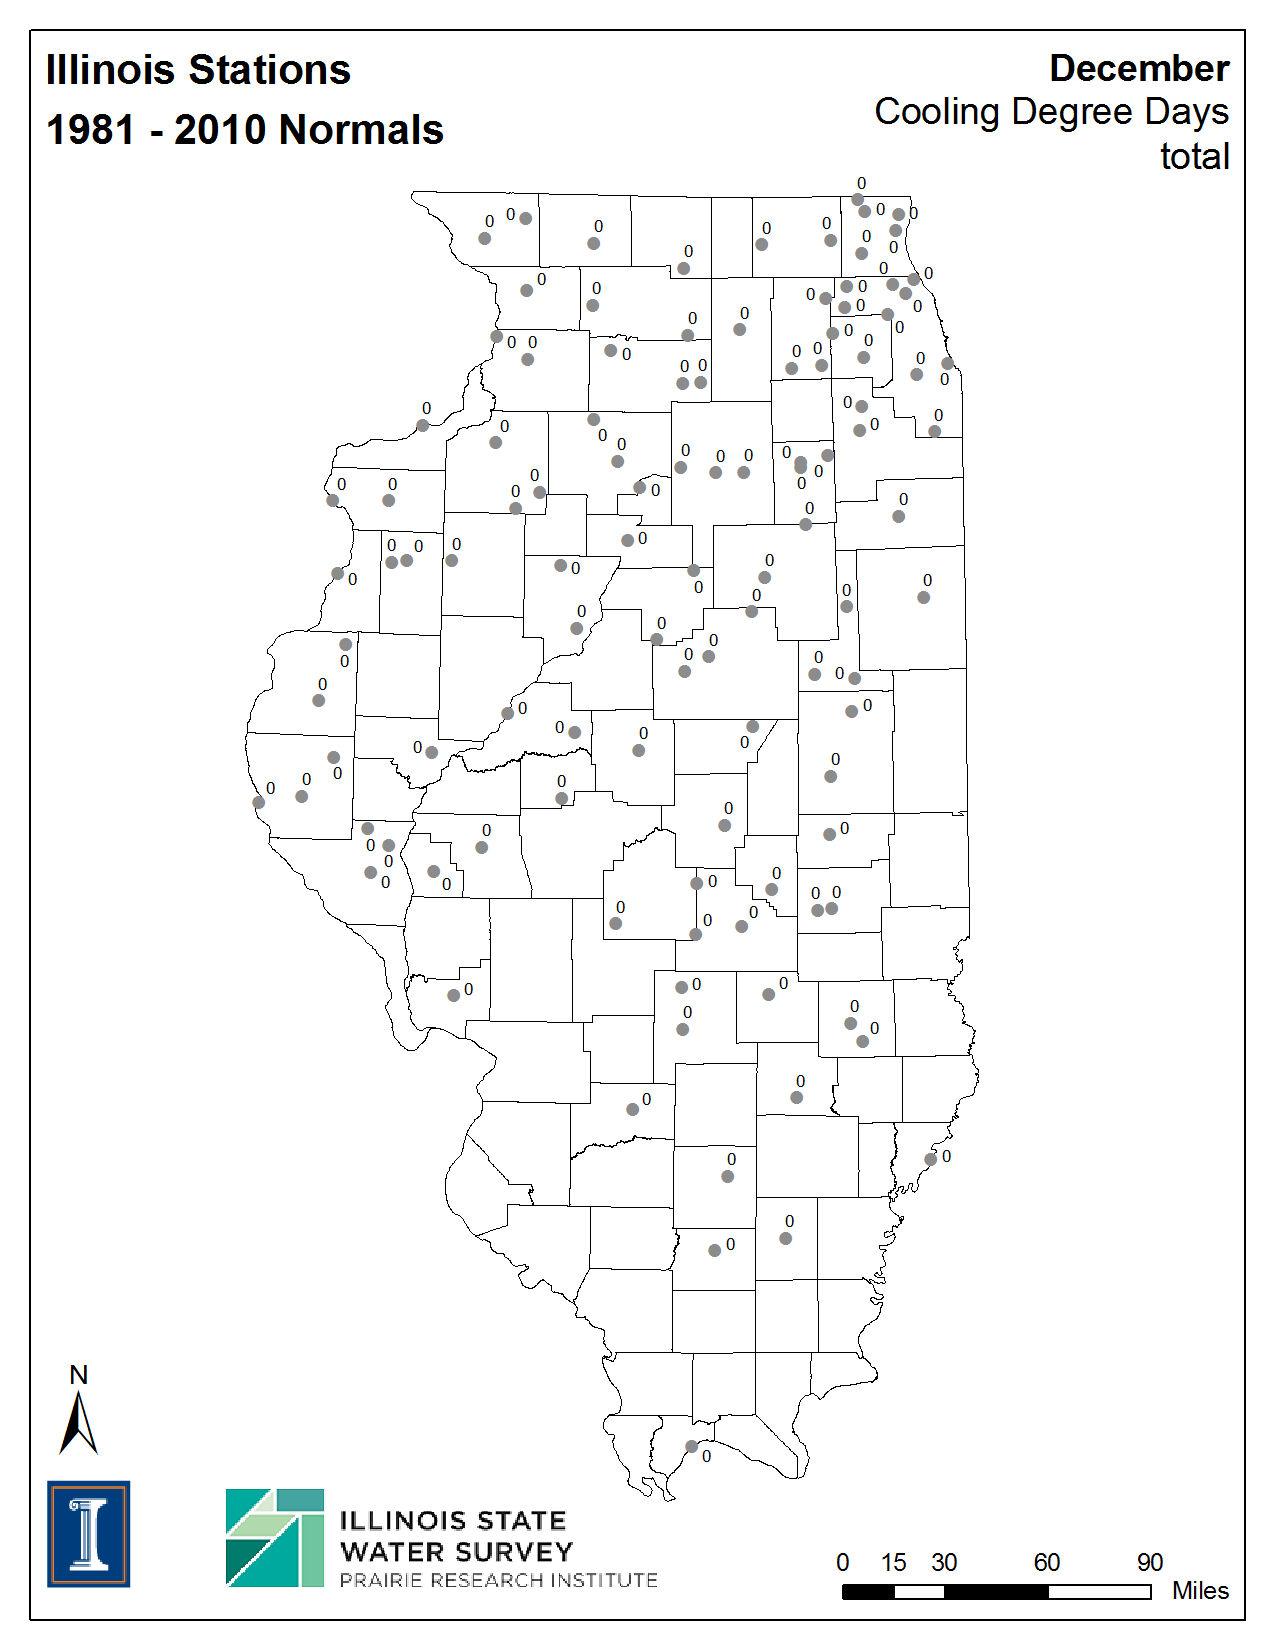
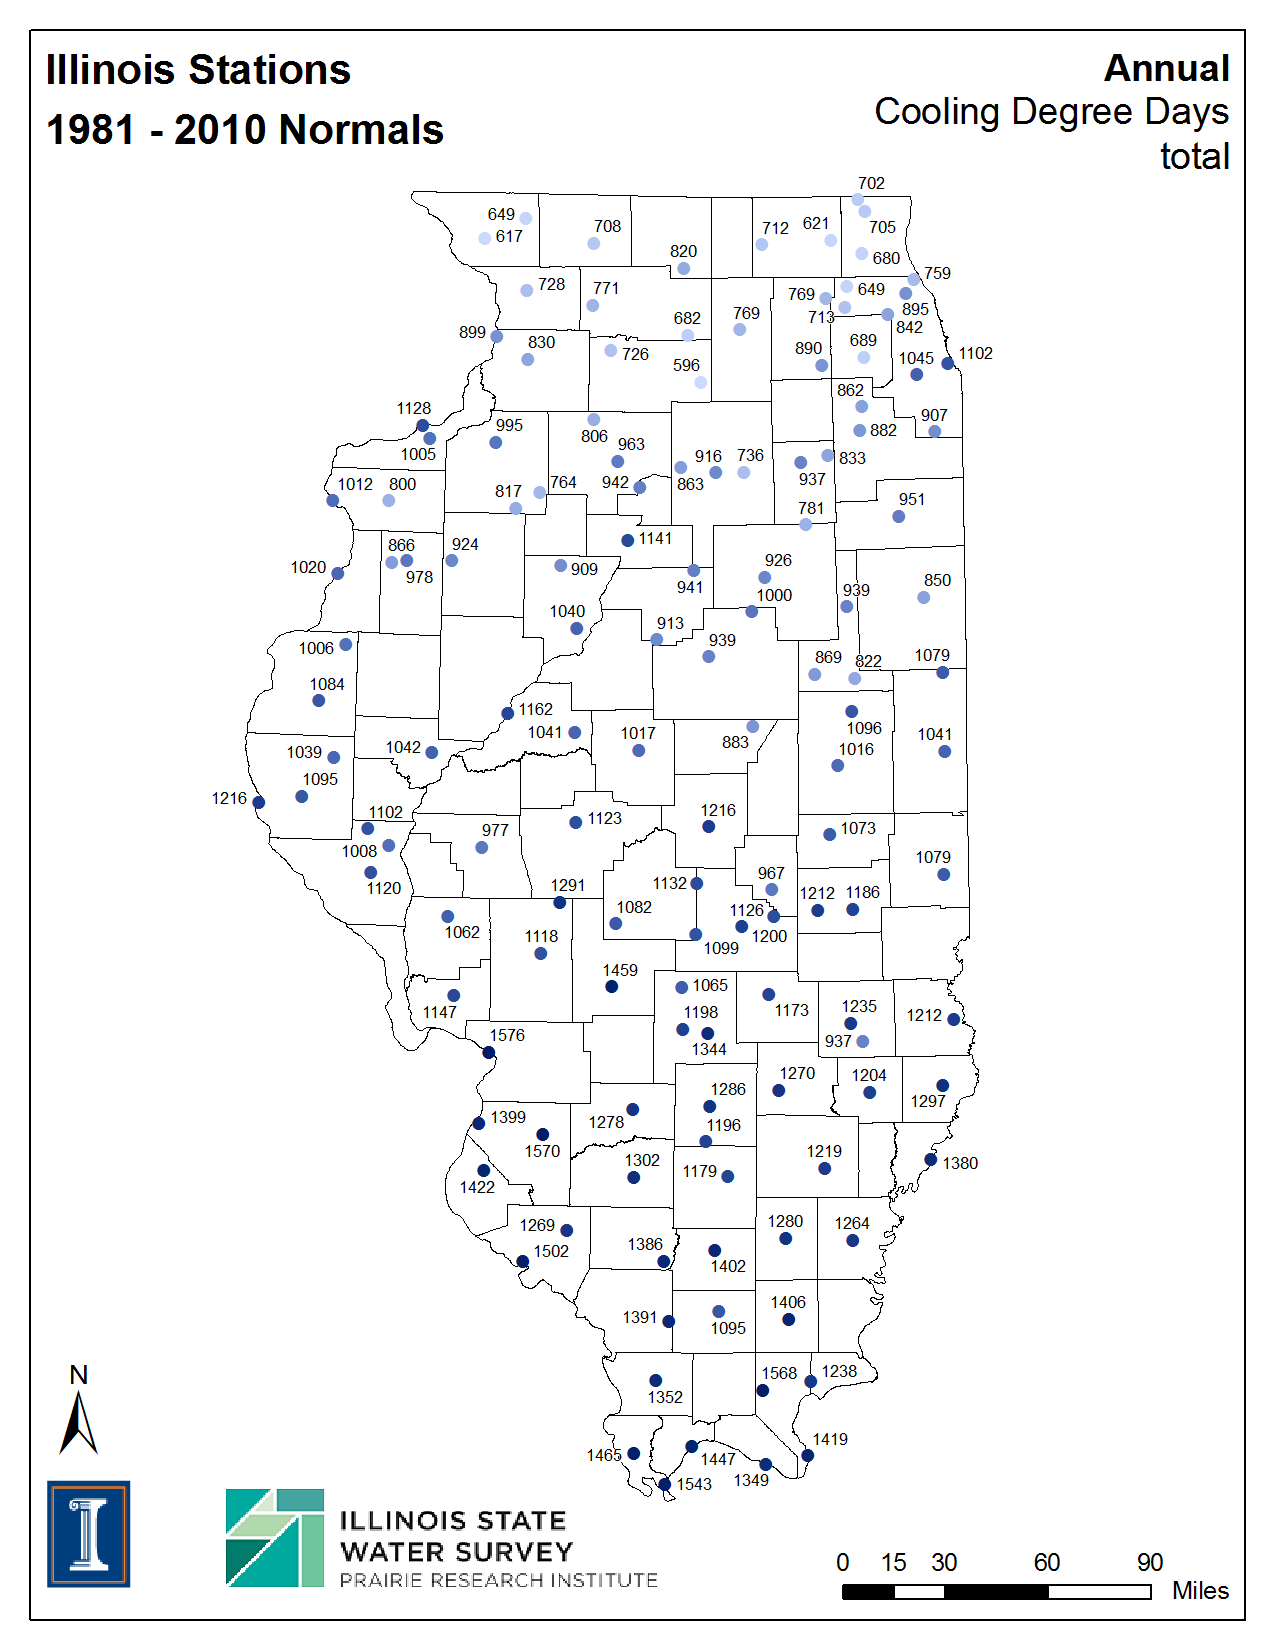
| Cooling Degree Days | ||||||
| Jan | Feb | Mar | Apr | May | Jun | |
| Jul | Aug | Sep | Oct | Nov | Dec | Annual |
See the frost and growing season page for information on those two topics.
See the wind speed and wind rose pages for information on those topics.
The data used in these products come from the National Weather Service (NWS) Cooperative Observer Program (COOP). This network of more than 11,000 volunteer observers nationwide, using approved instruments and observing techniques, provides high-quality climate data to the nation. The data are archived at the National Climatic Data Center (NCDC).