Illinois State Water Survey - University of Illinois at Urbana-Champaign
State Climatologist Office for Illinois
Time Series Plots for Champaign-Urbana, IL
Dr. Jim Angel, State Climatologist
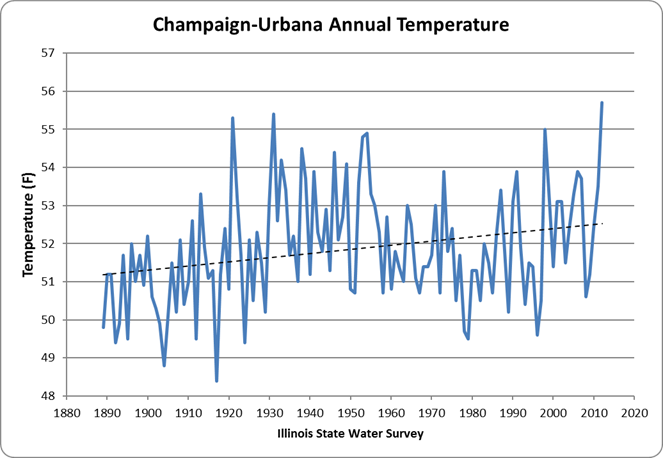
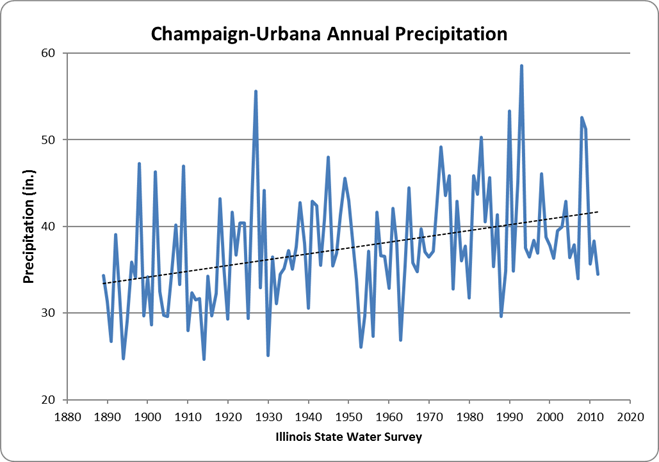
Here are time series plots of annual temperature, precipitation, and snowfall for Champaign-Urbana, Illinois. The dashed line is a simple linear trend to indicate overall changes. As these graphs show, there is considerable year-to-year and decade-to-decade changes in the records as a result of climate change and climate variability. Updated 5/6/2014.
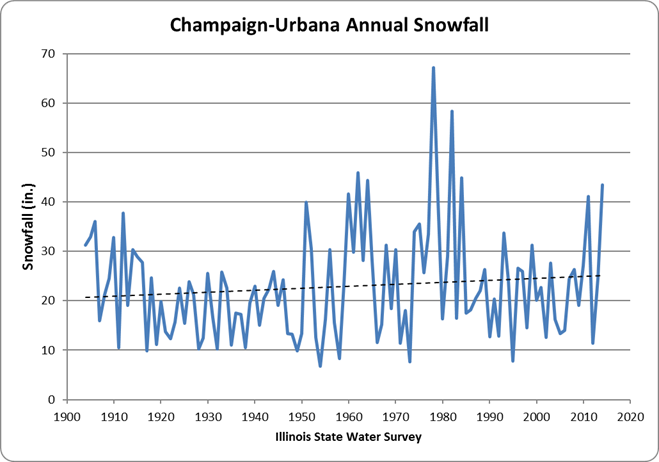
Because each snowfall season begins in one calendar year and ends in the next, the snowfall totals are plotted for the second year. For example, the 2007-2008 snowfall season is plotted as "2008". The typical snowfall season runs from November to March but measurable amounts have been reported as early as October and as late as May. To account for the wide variation, the annual snowfall was computed from July of the first year to June of the second year.