Institute of Natural Resource Sustainability
University of Illinois at Urbana-Champaign
Illinois State Climatologist Office
Jim Angel, state climatologist
Flood of 2008 in Illinois
Jim Angel, state climatologistIllinois has been plagued by floods in 2008 as the result of heavy rains, starting in January and continuing through June. Estimates of agricultural losses alone are $1.3 billion for the state.
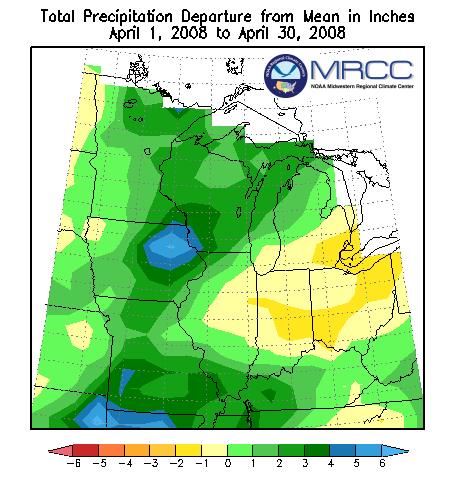
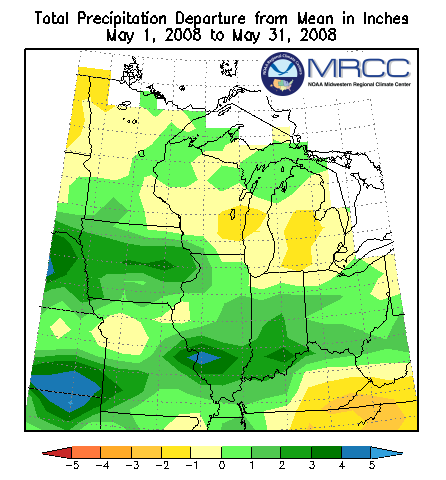
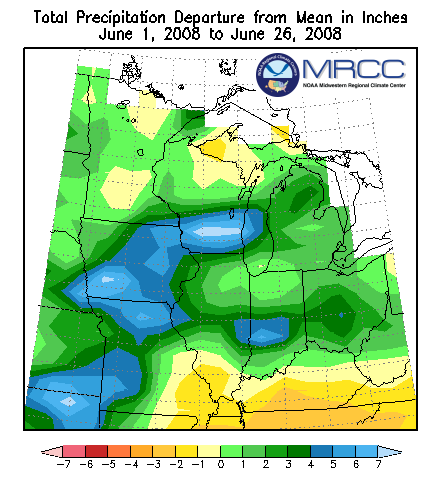
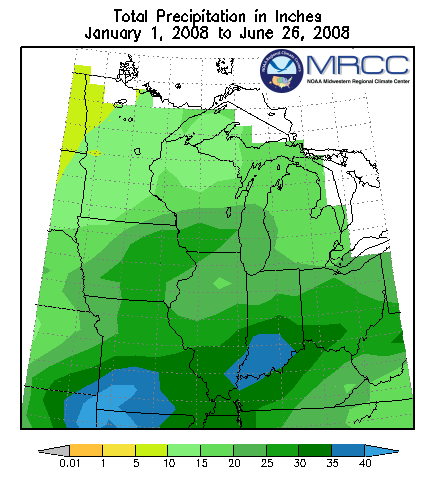
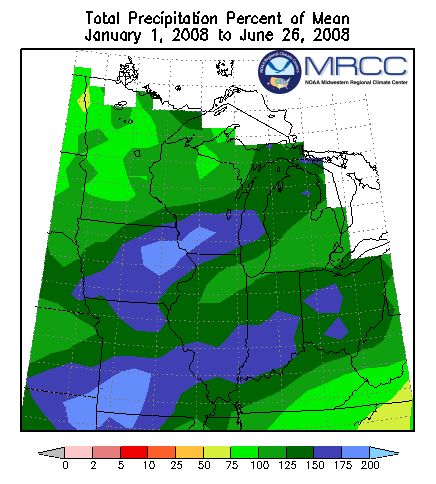
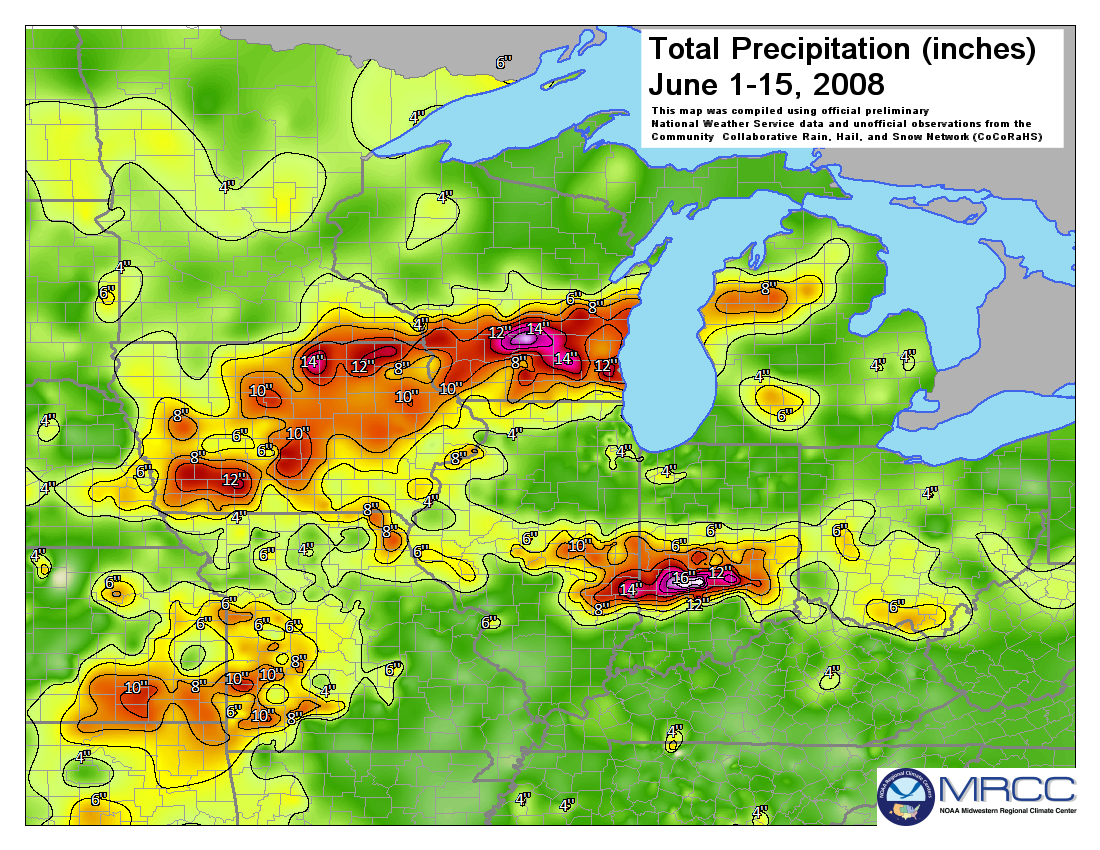
Figure 1 shows the precipitation distribution from January 1 to June 26, 2008, expressed as a departure from normal in inches. Almost all of the Midwest was above average. Areas in blue are in excess of 12 inches above normal and include much of IA and southwestern WI as well as southern MO, IL, and IN. The exceptionally heavy rains of June 1-15, 2008, pushed many rivers into flood stage (Figure 2). See the map gallery for more information on the precipitation in 2008.
The heaviest flooding has been in Iowa but much of Illinois has been at risk. Current observed and forecasted rivers flows can be found at NOAA's Advanced Hydrologic Prediction Service and the National Significant River Flood Outlook. Information on the impacts of the flooding can be found on the Midwestern Regional Climate Center's Climate Watch page.
Western Illinois
On June 23, the state of Illinois announced a Flood Recovery Assistance Hotline to help flood victims with state assistance programs. To date, Illinois has declared 24 counties as state disaster areas (Adams, Calhoun, Clark, Coles, Crawford, Cumberland, Douglas, Edgar, Hancock, Henderson, Knox, Jasper, Jersey, Lake, Lawrence, Madison, Mercer, Monroe, Pike, Randolph, Rock Island, St. Clair, Whiteside, and Winnebago). The latest on Illinois flood efforts can be found at Ready Illinois.
FarmWeek (June 23, 2008, page 6) reported that along the Mississippi River, some 54,000 acres in Henderson and Adams counties were subjected to flooding. In Rock Island County, 25,000 acres were damaged or destroyed (mostly due to the Rock River).
Southeastern Illinois
Six southeastern counties have been named state disaster areas (Clark, Coles, Crawford, Cumberland, Jasper, and Lawrence) on June 10 (see press release). Heavy rains in May and June caused levees along the Embarras and Wabash rivers to fail. Some 200 homes were evacuated in the area around Lawrenceville. Floodwaters temporarily knocked out the water supply to Lawrenceville, affecting roughly 10,000 people. On June 15, water service was restored after divers repaired a broken water main that was located under floodwaters. FarmWeek (June 23, 2008, page 6) reported that an estimated 40,000 acres flooded in White County, 20,000 acres in Clay County, and 80,000 acres in Lawrence County.
Northern Illinois
The Fox, Pecatonica, and Rock rivers were above flood stage in June, largely due to heavy rains in Wisconsin. On June 9, the Illinois Department of Natural Resources began restricting boating access to the Fox River.
Impact on Crops
The heavy rains and flooding have had an impact on Illinois crops as well. Generally, areas receiving heavy rains have experienced delays in planting and crop development. See the Illinois Weather and Crops report for weekly conditions. According to an American Farm Bureau Federation report in June, Illinois has lost $1.3 billion in agricultural production from flooding and excessive rains. University of Illinois research indicates that planting corn or soybeans after June 20 may lead to a 50 percent reduction in crop yield, according to an article in Inside Illinois.
Figure 1. Total precipitation departure from normal in inches, January 1 - June 26, 2008. Figure courtesy of the Midwestern Regional Climate Center (MRCC). Up to date maps of Illinois precipitation can be found at Current Conditions.
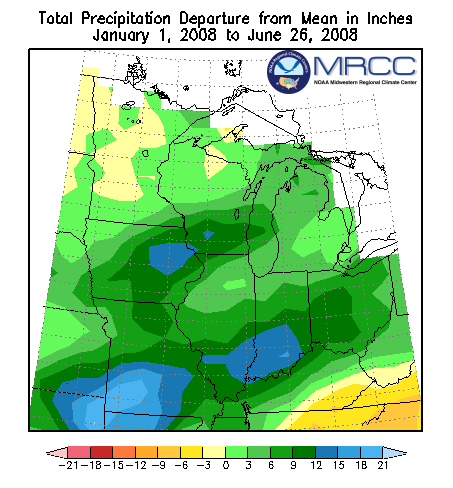
Figure 2. Heavy rains of June 1-15, 2008, across the Midwest. These intense rains, falling on saturated soils, fed into streams and rivers that were already near flood stage. Here is the higher resolution version of the map.

- Illinois State Water Survey
- All files and information ©2008
- Last Modified: June 27, 2008