Illinois State Water Survey - University of Illinois at Urbana-Champaign
State Climatologist Office for Illinois
Tornado Plots For Illinois
Dr. Jim Angel, State Climatologist
Using tornado statistics provided by the National Climatic Data Center, here we explore the relationship of selected tornado characteristics with hour of the day, month of the year, from year to year, etc. This was part of a Capstone project by Michael Patrick, a senior (2011) in the Department of Atmospheric Science at the University of Illinois. Nearly all the plots have been updated through 2016. Click any plot to enlarge.
Tornadoes, Fatalities, and Injuries by Year
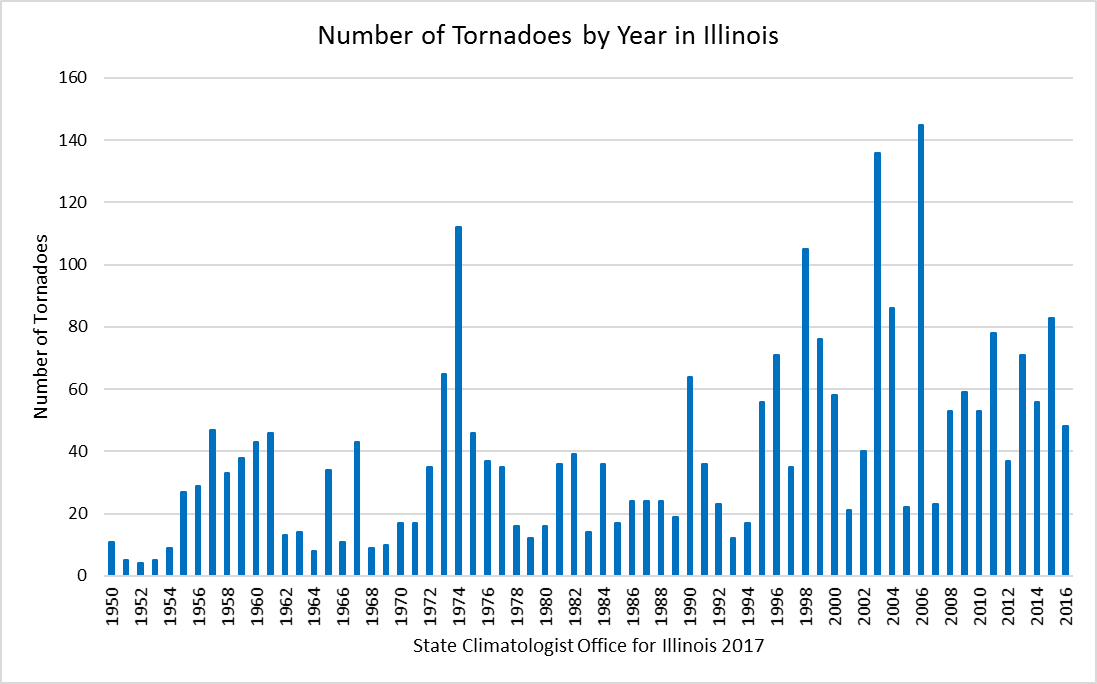
Figure 1. This plot shows the number of tornadoes per year from 1950 to 2016. The apparent upward trend over time is due largely to better tornado reporting since the mid 1990s due to better radar and spotter networks. This issue is discussed in more detail on the tornado trends page.
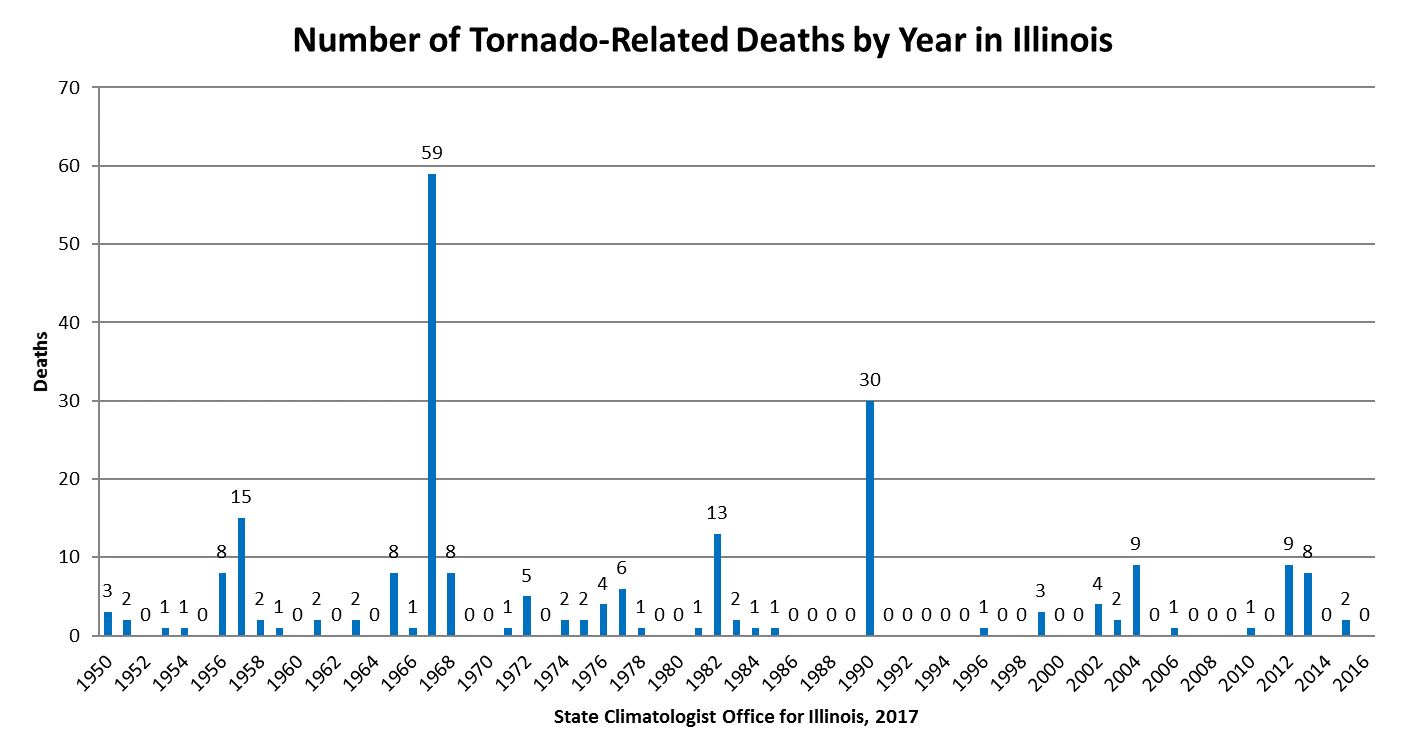
Figure 2. This plot shows the number of tornado-related fatalities from 1950 to 2016. The 1967 Belvidere and Oak Lawn event and the 1990 Plainfield event are the two standouts in the historical record.
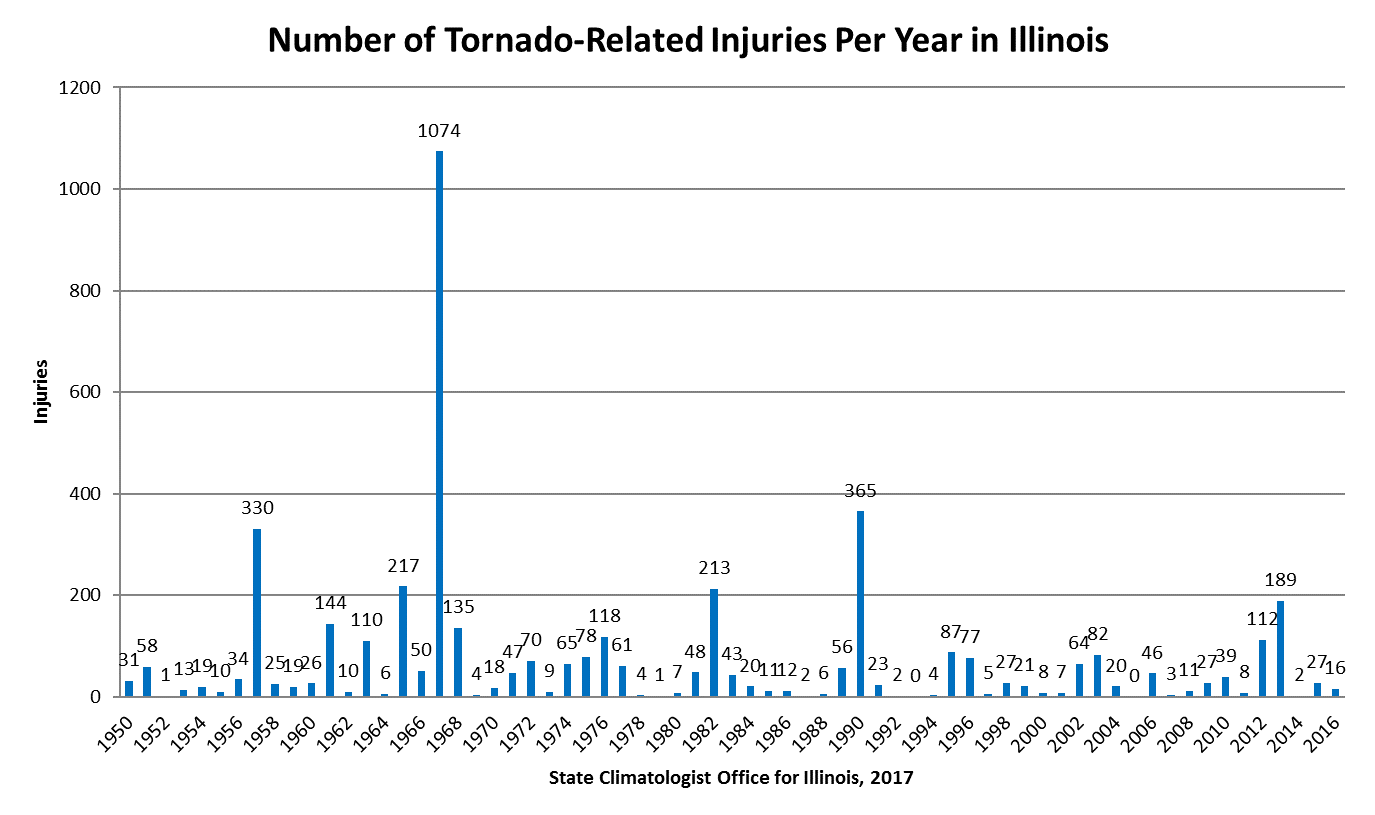
Figure 3. This plot shows the number of tornado-related injuries from 1950 to 2016. On average, the number of injuries is 20 times higher than the fatalities from tornadoes.
Tornadoes, Fatalities, and Injuries by Month
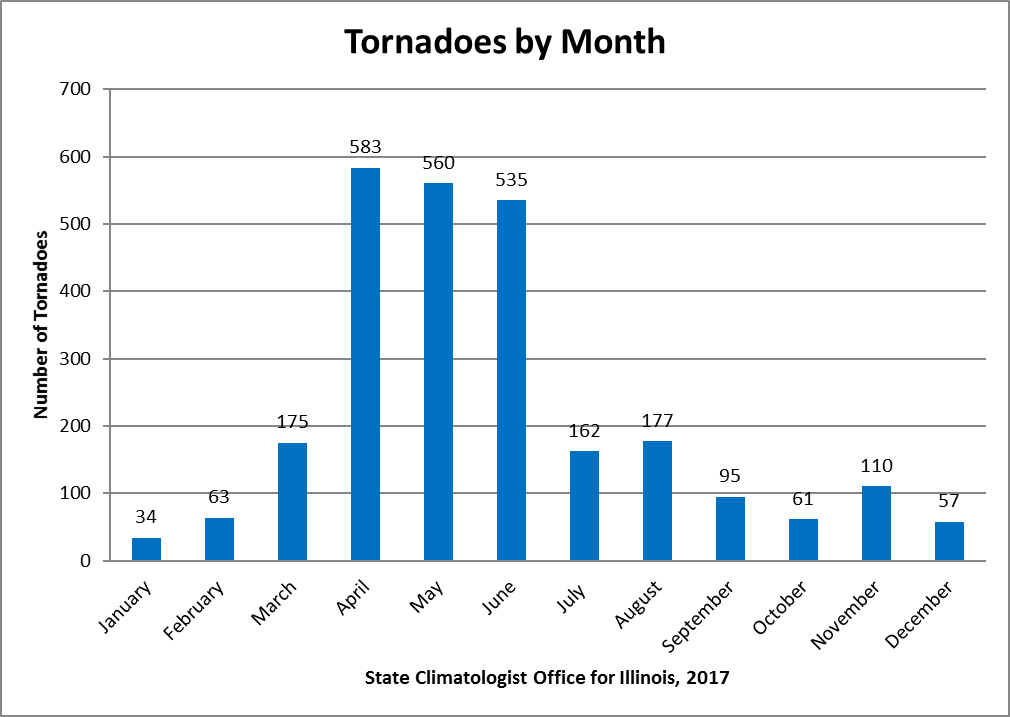
Figure 4. This plot shows the number of tornadoes by month in Illinois. About 66 percent of all historical events occurred in April, May, and June. However, tornadoes can occur at any time in Illinois. Please take tornado watches and warnings seriously, regardless of the month.
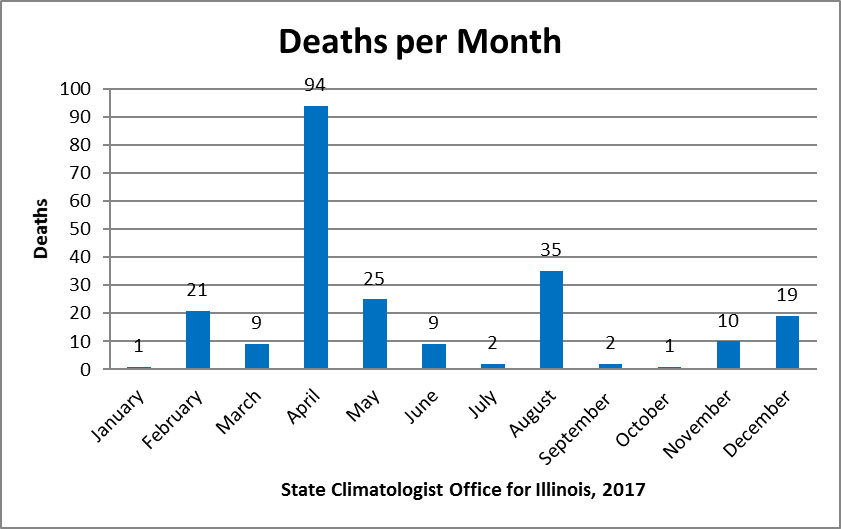
Figure 5. This plot shows the number of tornado-related fatalities by month for Illinois. April is the deadliest month with 94 reported deaths. The second deadliest month was August, mostly due to the 29 deaths associated with the August 28, 1990, Plainfield event.
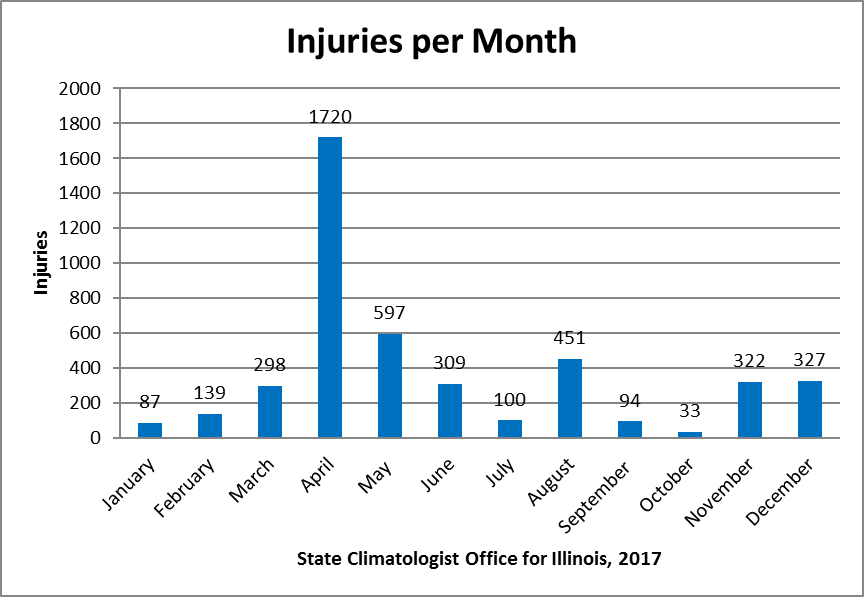
Figure 6. This plot shows the number of tornado-related injuries by month for Illinois. April is the worst month for injuries. April has a high frequency of tornadoes, deaths, and injuries. The number of deaths and injuries drop sharply in May and June even though the number of tornadoes is nearly as high as May and June. This may be due in part to better preparation and response to tornado watches and warnings as the season progresses.
Tornadoes, Fatalities, and Injuries by Hour of the Day
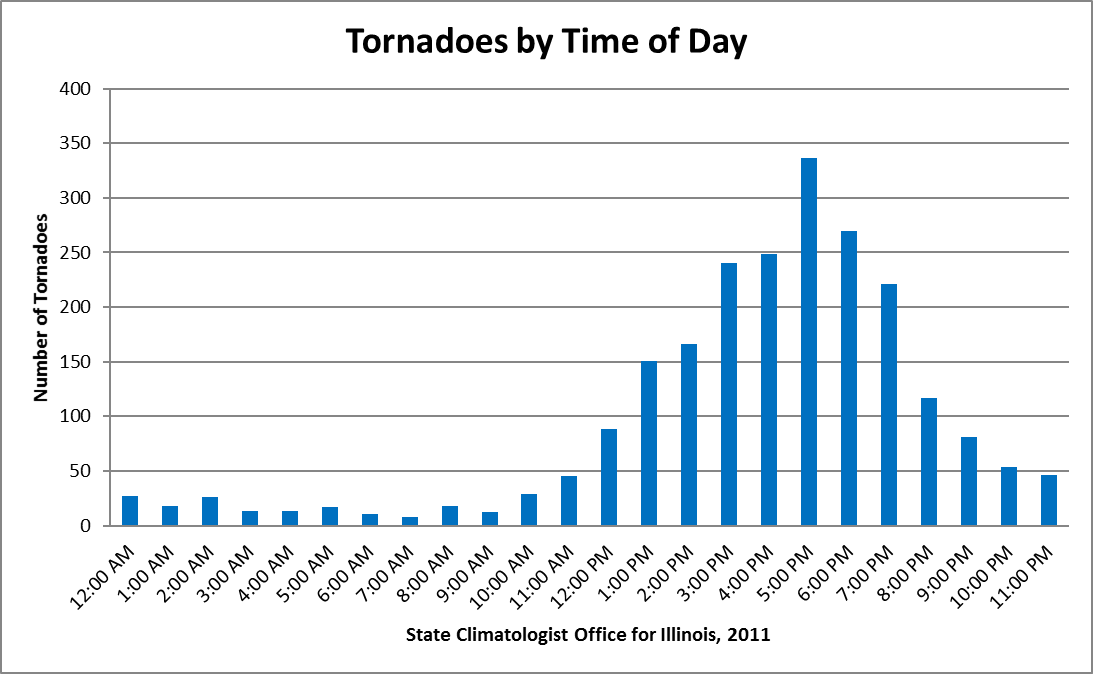
Figure 7. This plot shows the number of tornadoes by the time of day in Illinois. Tornadoes rarely occurred in Illinois between midnight and noon. However, the numbers rapidly increase each hour in the afternoon. They peak at 5 pm and decline through the rest of the evening.
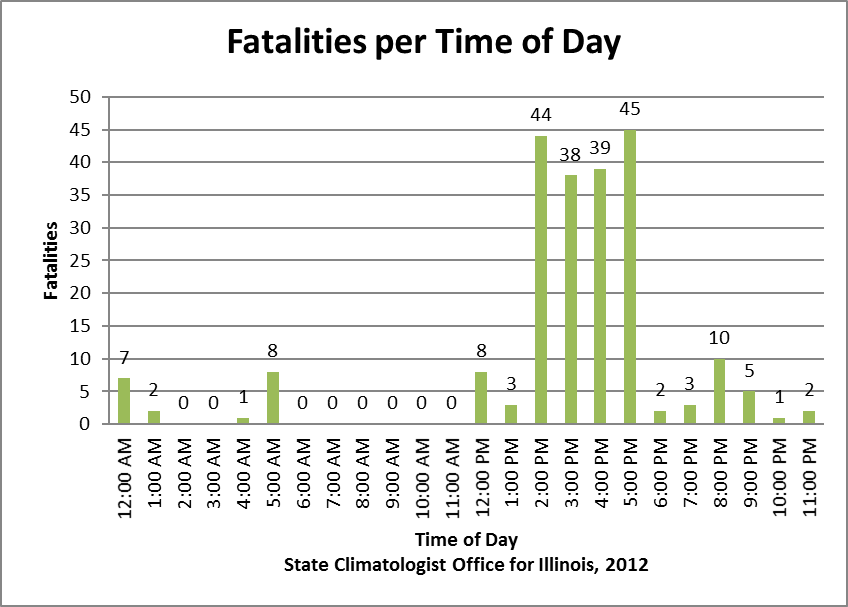
Figure 8. This plot shows the number of tornado-related fatalities by hour in Illinois. Most of the fatalities occurred between 2 and 5 pm.
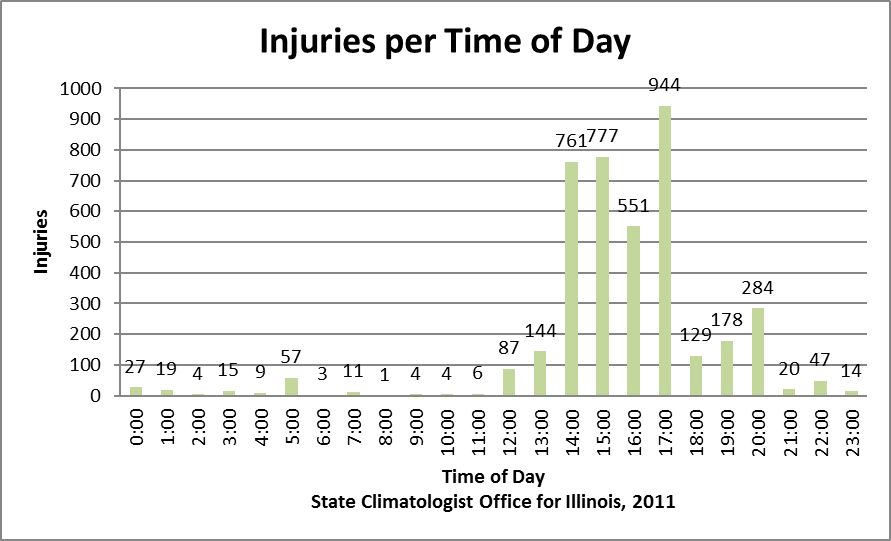
Figure 9. This plot shows the number of tornado-related injuries by hour in Illinois. Most of these occurred between 2 and 5 pm. It is interesting that the number of fatalities and injuries drop off sharply after 5 pm even though the number of tornadoes is relatively high from 5 to 9 pm. While I can only speculate (again), I think the sharp drop off after 5 pm is due in part to the fact that most people are home and settled with more access to weather warnings and better shelter.
Tornadoes, Fatalities, and Injuries by F-Scale
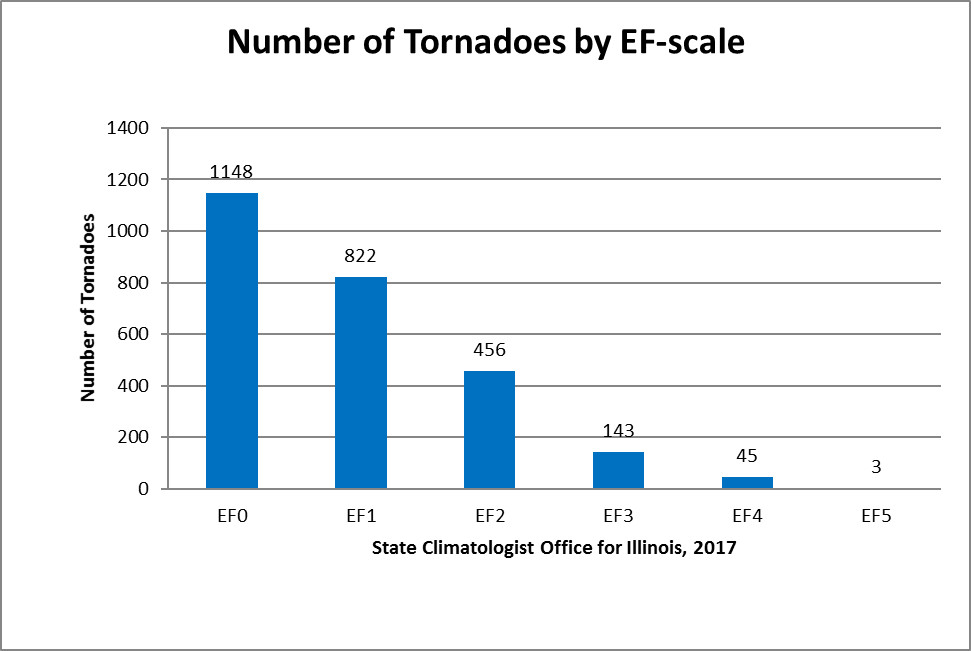
Figure 10. This plot shows the number of tornadoes in each category of the Fujita scale. The good news about tornadoes in Illinois is that the majority are at the weaker end of the Fujita scale. In fact, the most type of event, an "EF0", tend to cause little if any damage and injuries or deaths are rare. The worst category of tornadoes, an "EF5", are extremely rare. Only three have occurred in the records since 1950.
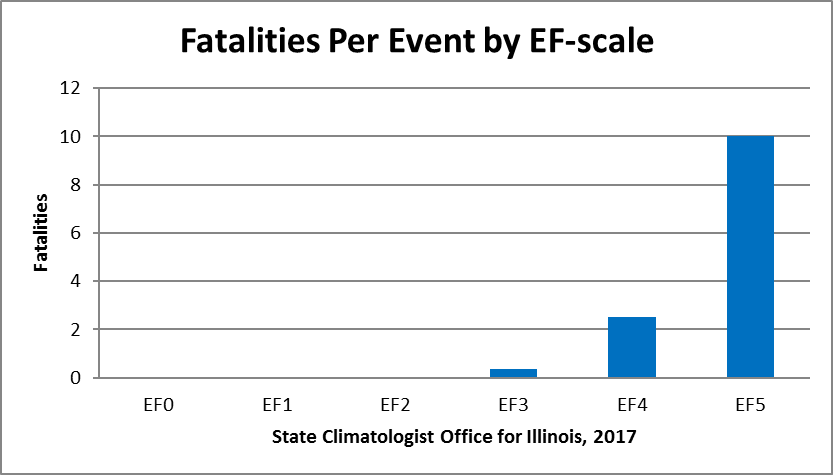
Figure 11. This plot shows the number of fatalities per tornado event in each category of the Fujita scale. As expected, the death rate increase as the tornado becomes stronger with the rate reaching 10 deaths per event for EF5 tornadoes.
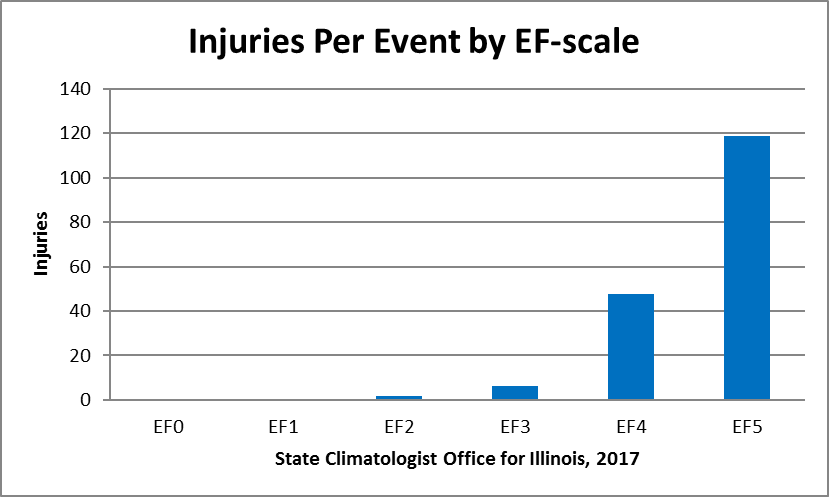
Figure 12. This plot shows the number of tornado-related injuries per tornado event in each category of the Fujita scale. The pattern is similar to the number of fatalities with the highest injury rate reaching 120 per event for EF5 tornadoes.