Sediment and Nutrient Monitoring at Selected Watersheds within the Kaskaskia River Watershed for Evaluating the Effectiveness of the Conservation Reserve Enhancement Program (CREP)

Project Staff
Sponsor
Illinois Department of Natural Resources
Project Period
2013–current
Principal Investigators
Erin Bauer, Kip Stevenson, Elias Getahun, and Laura Keefer
The Illinois State Water Survey (ISWS) is monitoring several small watersheds in Illinois to help the Illinois Department of Natural Resources evaluate the effectiveness of the Conservation Reserve Enhancement Program (CREP). The CREP goals aim to reduce the amount of sediment and nutrients entering the main stems of the Illinois and Kaskaskia Rivers. ISWS provides year-round sediment and nutrient yield monitoring of nine subwatersheds. Monitoring began in 1999 in five subwatersheds of the Illinois River Basin (IRB-CREP). In 2013, four subwatersheds in the Kaskaskia River Basin (Kaskaskia-CREP) were added. This webpage is an overview of the Kaskaskia River Watershed aspect of the CREP monitoring project.
Kaskaskia-CREP Watershed Monitoring Area
The Kaskaskia-CREP stations are in Central/Southern Illinois near Carlyle Lake. Two stations are south of the lake; Lost Creek near Huey, Illinois, and NF Kaskaskia near Vernon, Illinois. Hurricane Creek near Bingham, Illinois, and East Fork Shoal near Witt, Illinois, are north of Carlyle Lake.

Kaskaskia Watershed
Monitored subwatersheds and station locations

North Fork Kaskaskia River at high flow. The water level is skimming the bridge deck, 2020.
Intensively Monitored Subwatersheds of the Kaskaskia River Basin
| Station | Name | Drainage Area(sq. mi) |
|---|---|---|
| 402 | Lost Creek | 38.0 |
| 403 | North Fork Kaskaskia | 35.5 |
| 404 | Hurricane Creek | 27.7 |
| 405 | East Fork Shoal Creek | 30.9 |
Intensive monitoring includes collecting frequent water quality samples and discharge measurements which are used for calculating annual loads and creating watershed models. Each site is visited weekly and during storm events throughout the year to collect measurements and samples through seasonal and surface water stage variations.
Kaskaskia-CREP Site Images
Lost Creek (402)
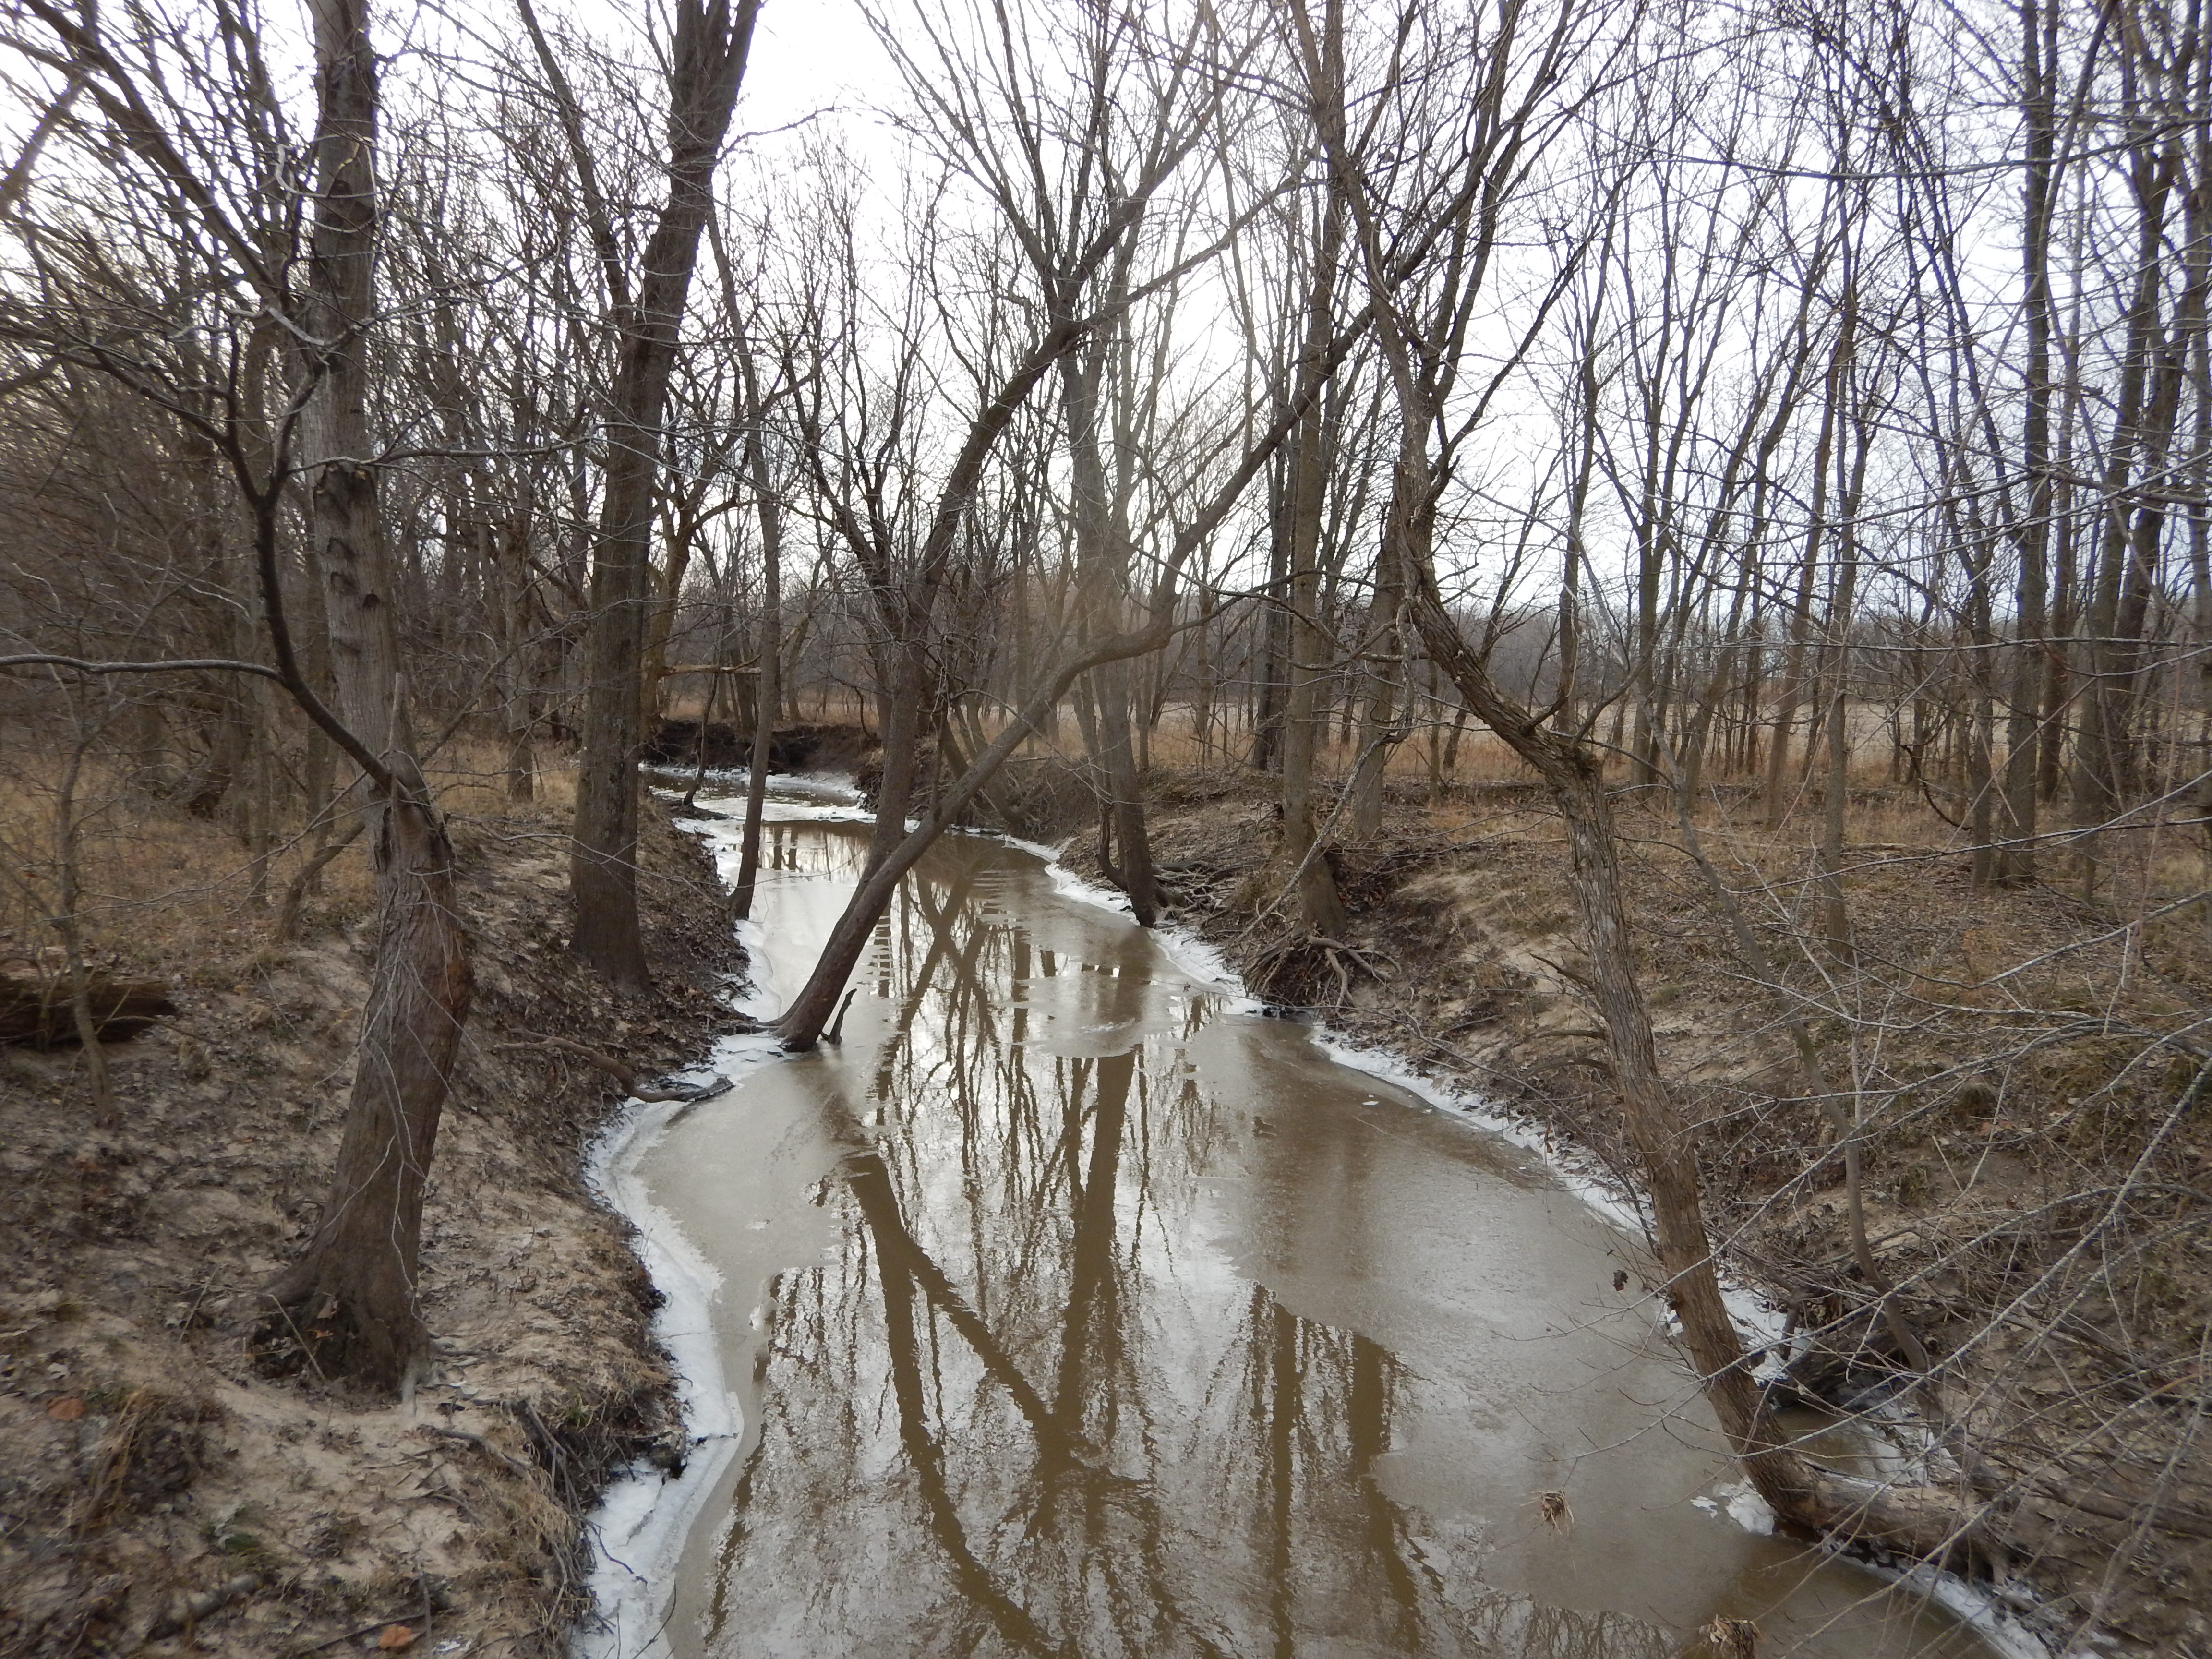
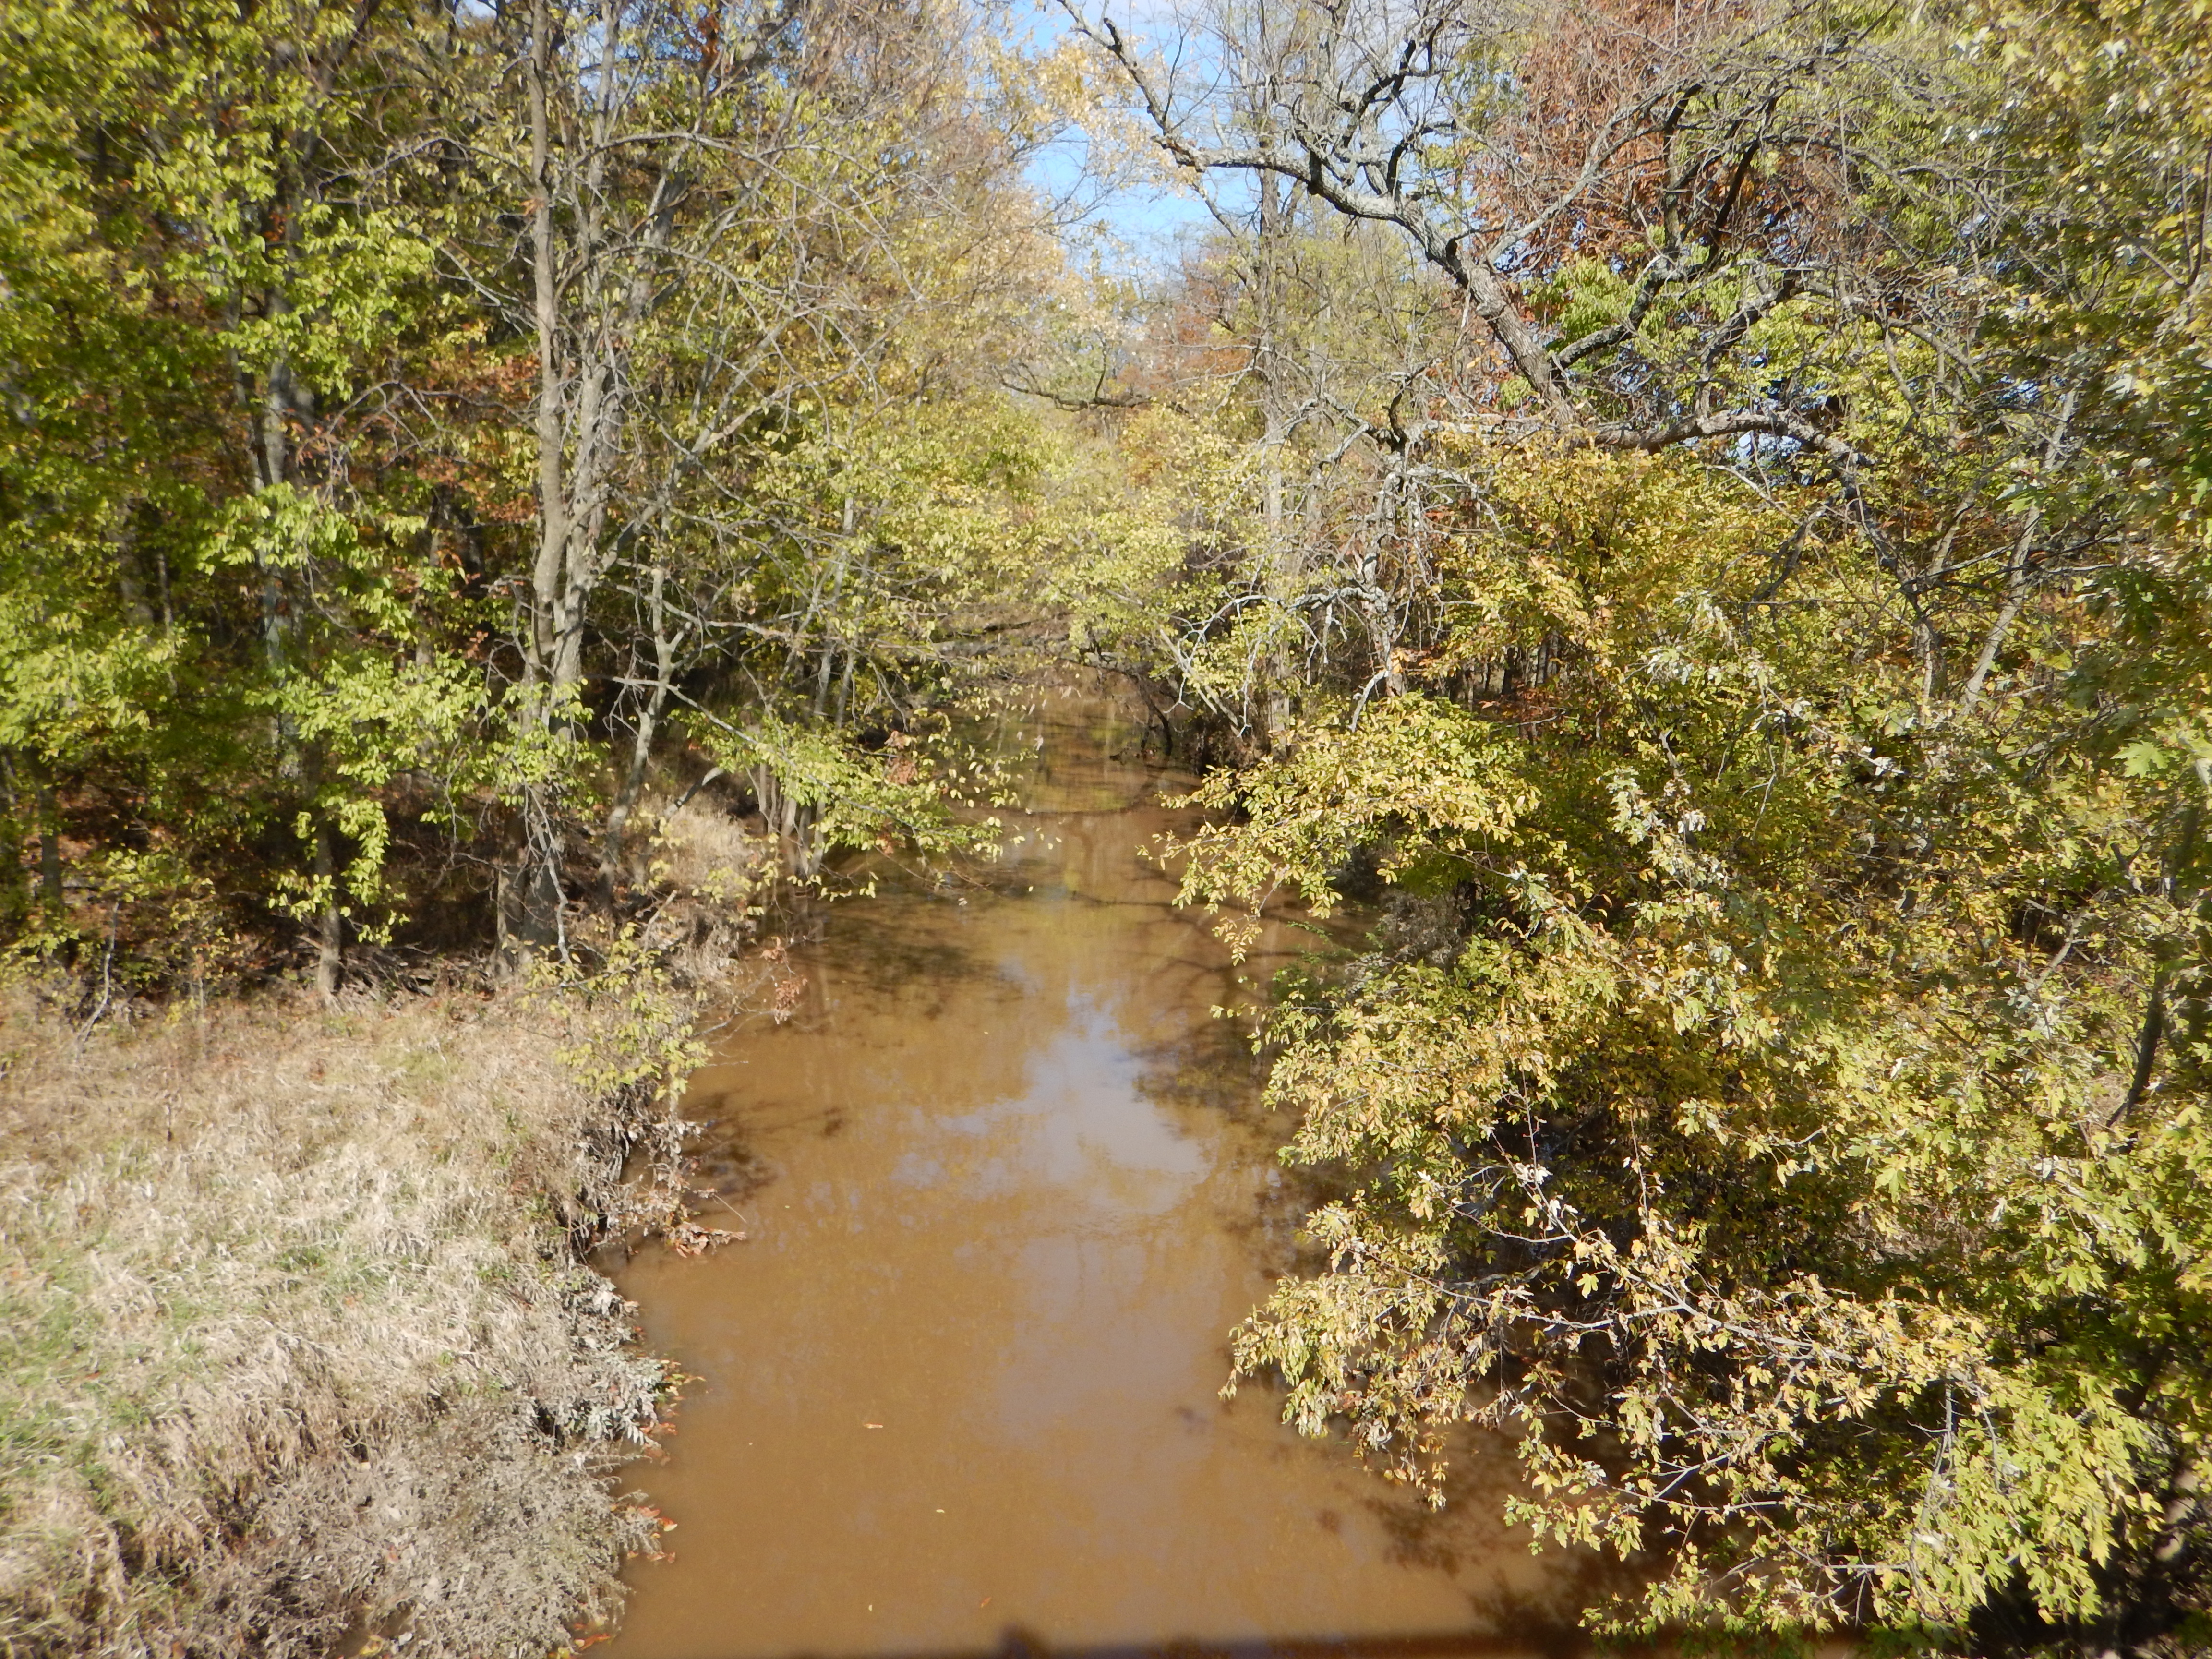
North Fork Kaskaskia (403)
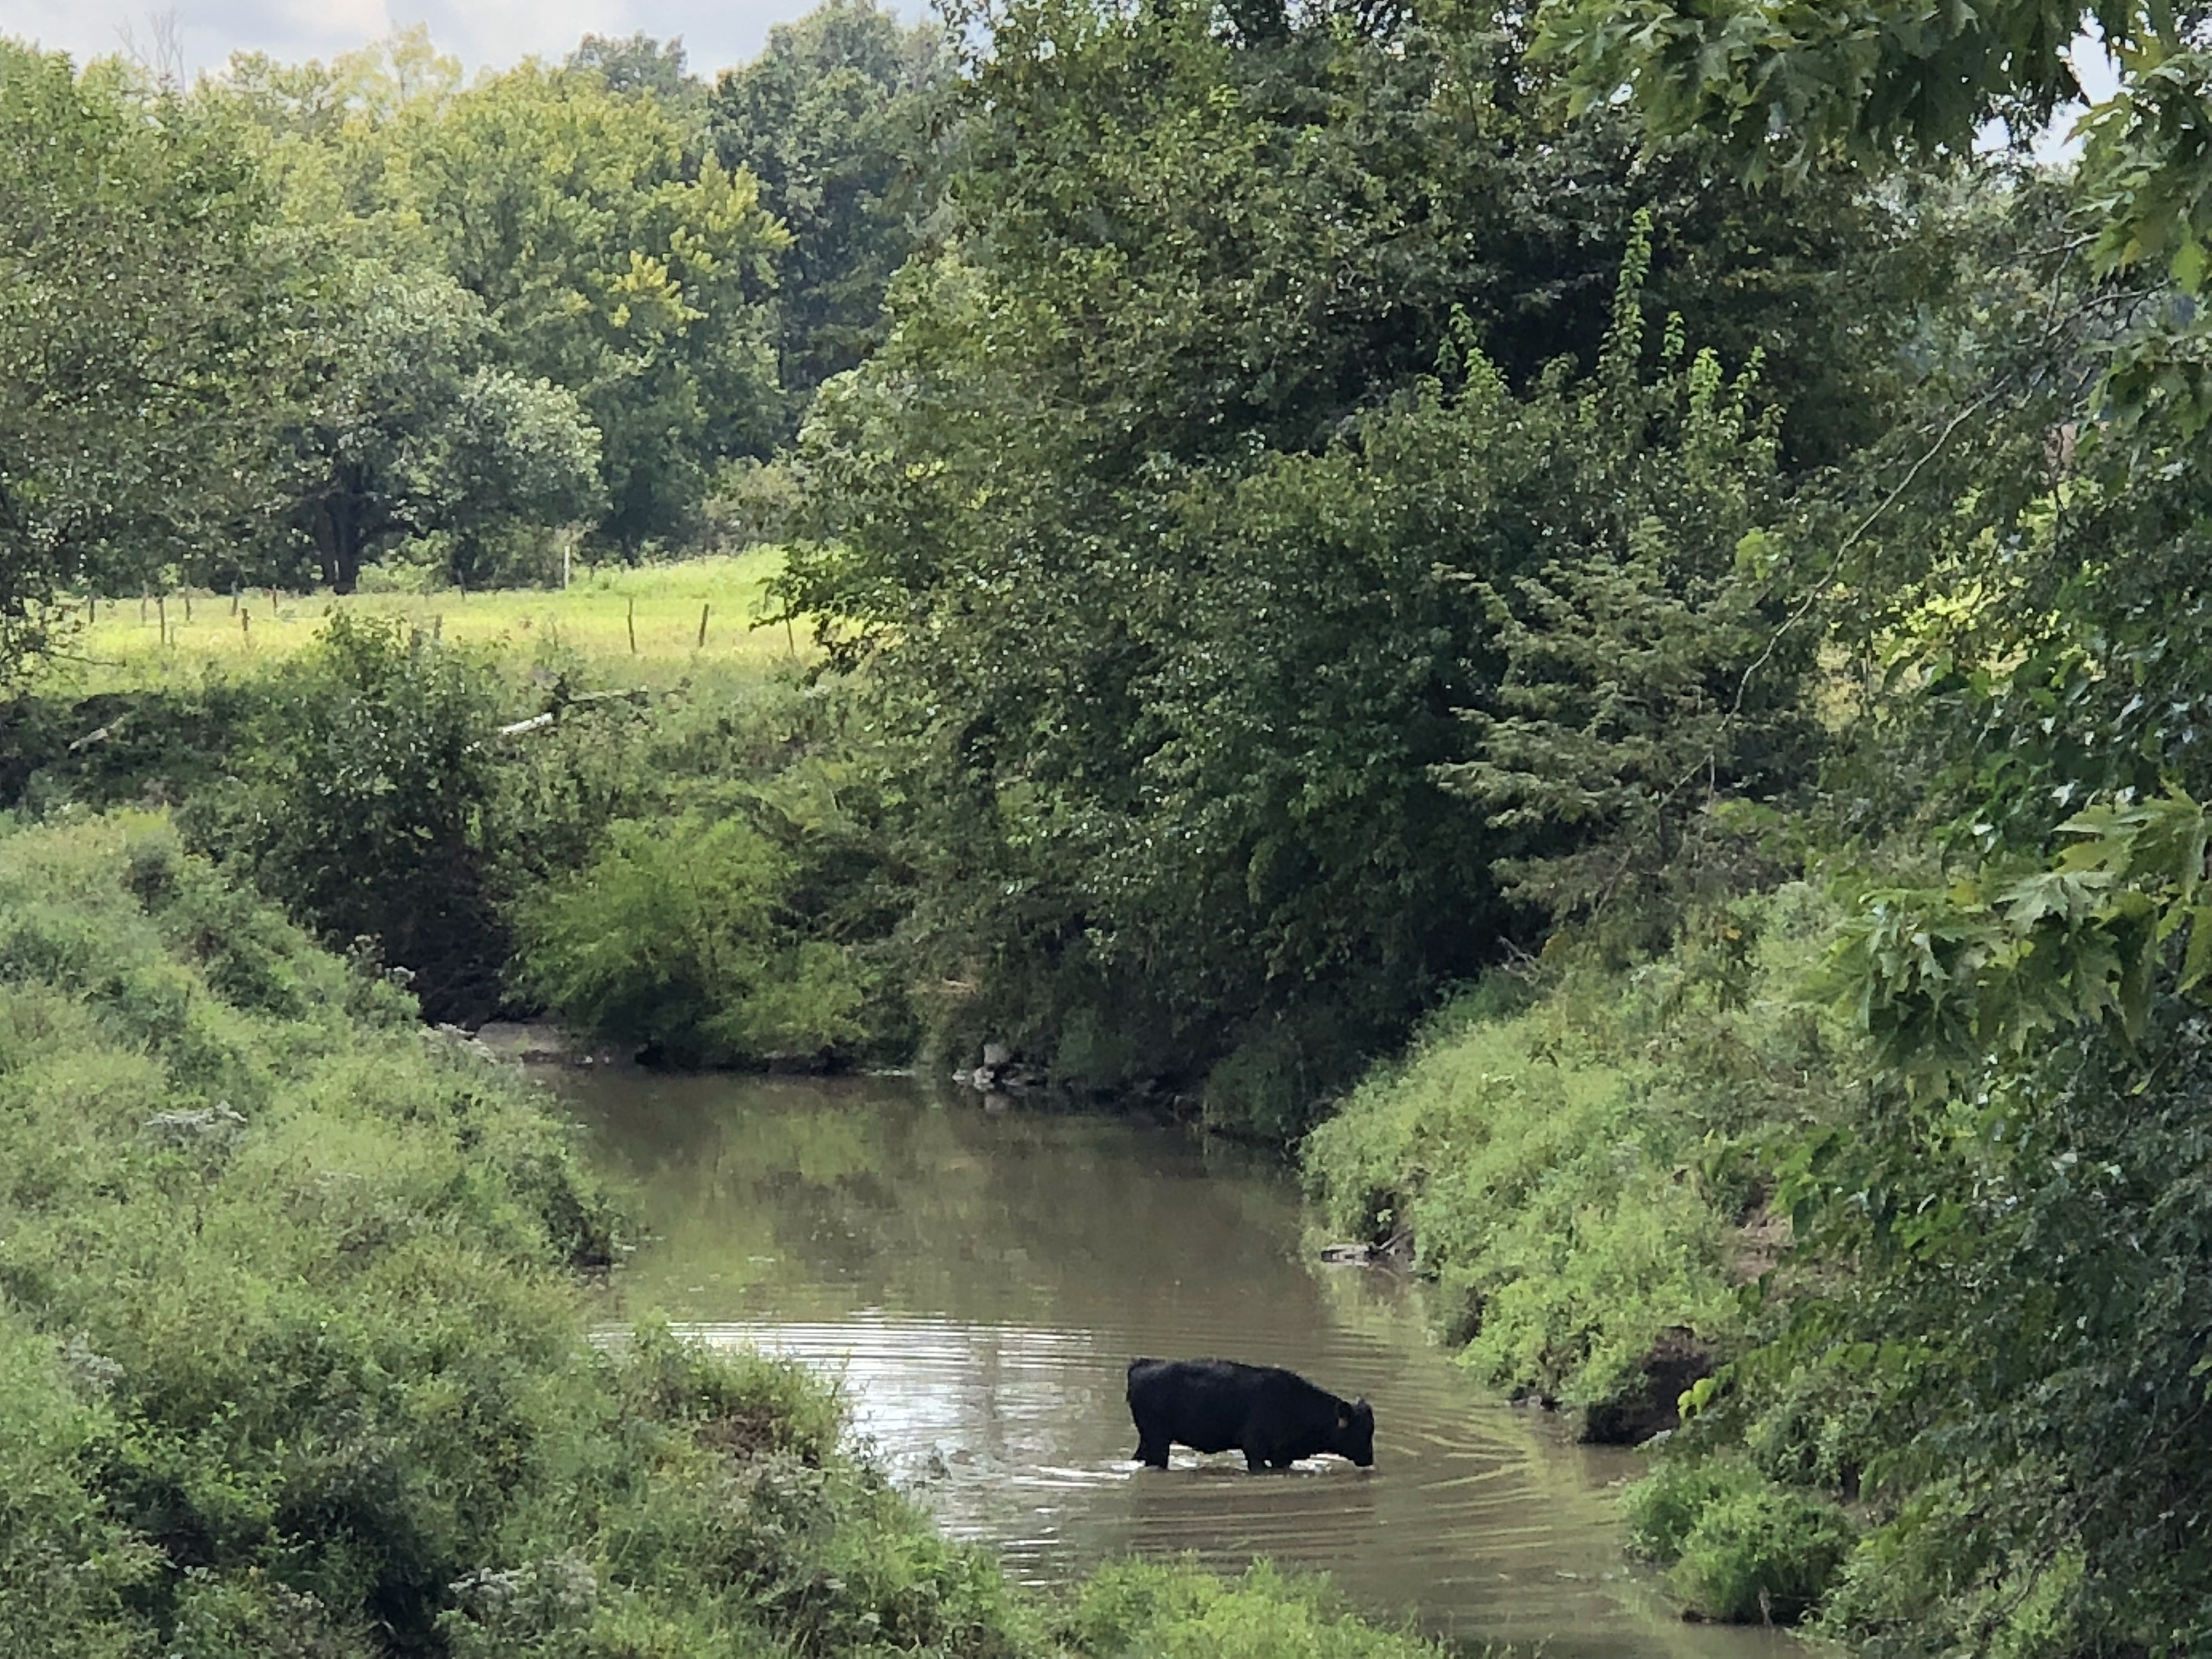
Hurricane Creek (404)
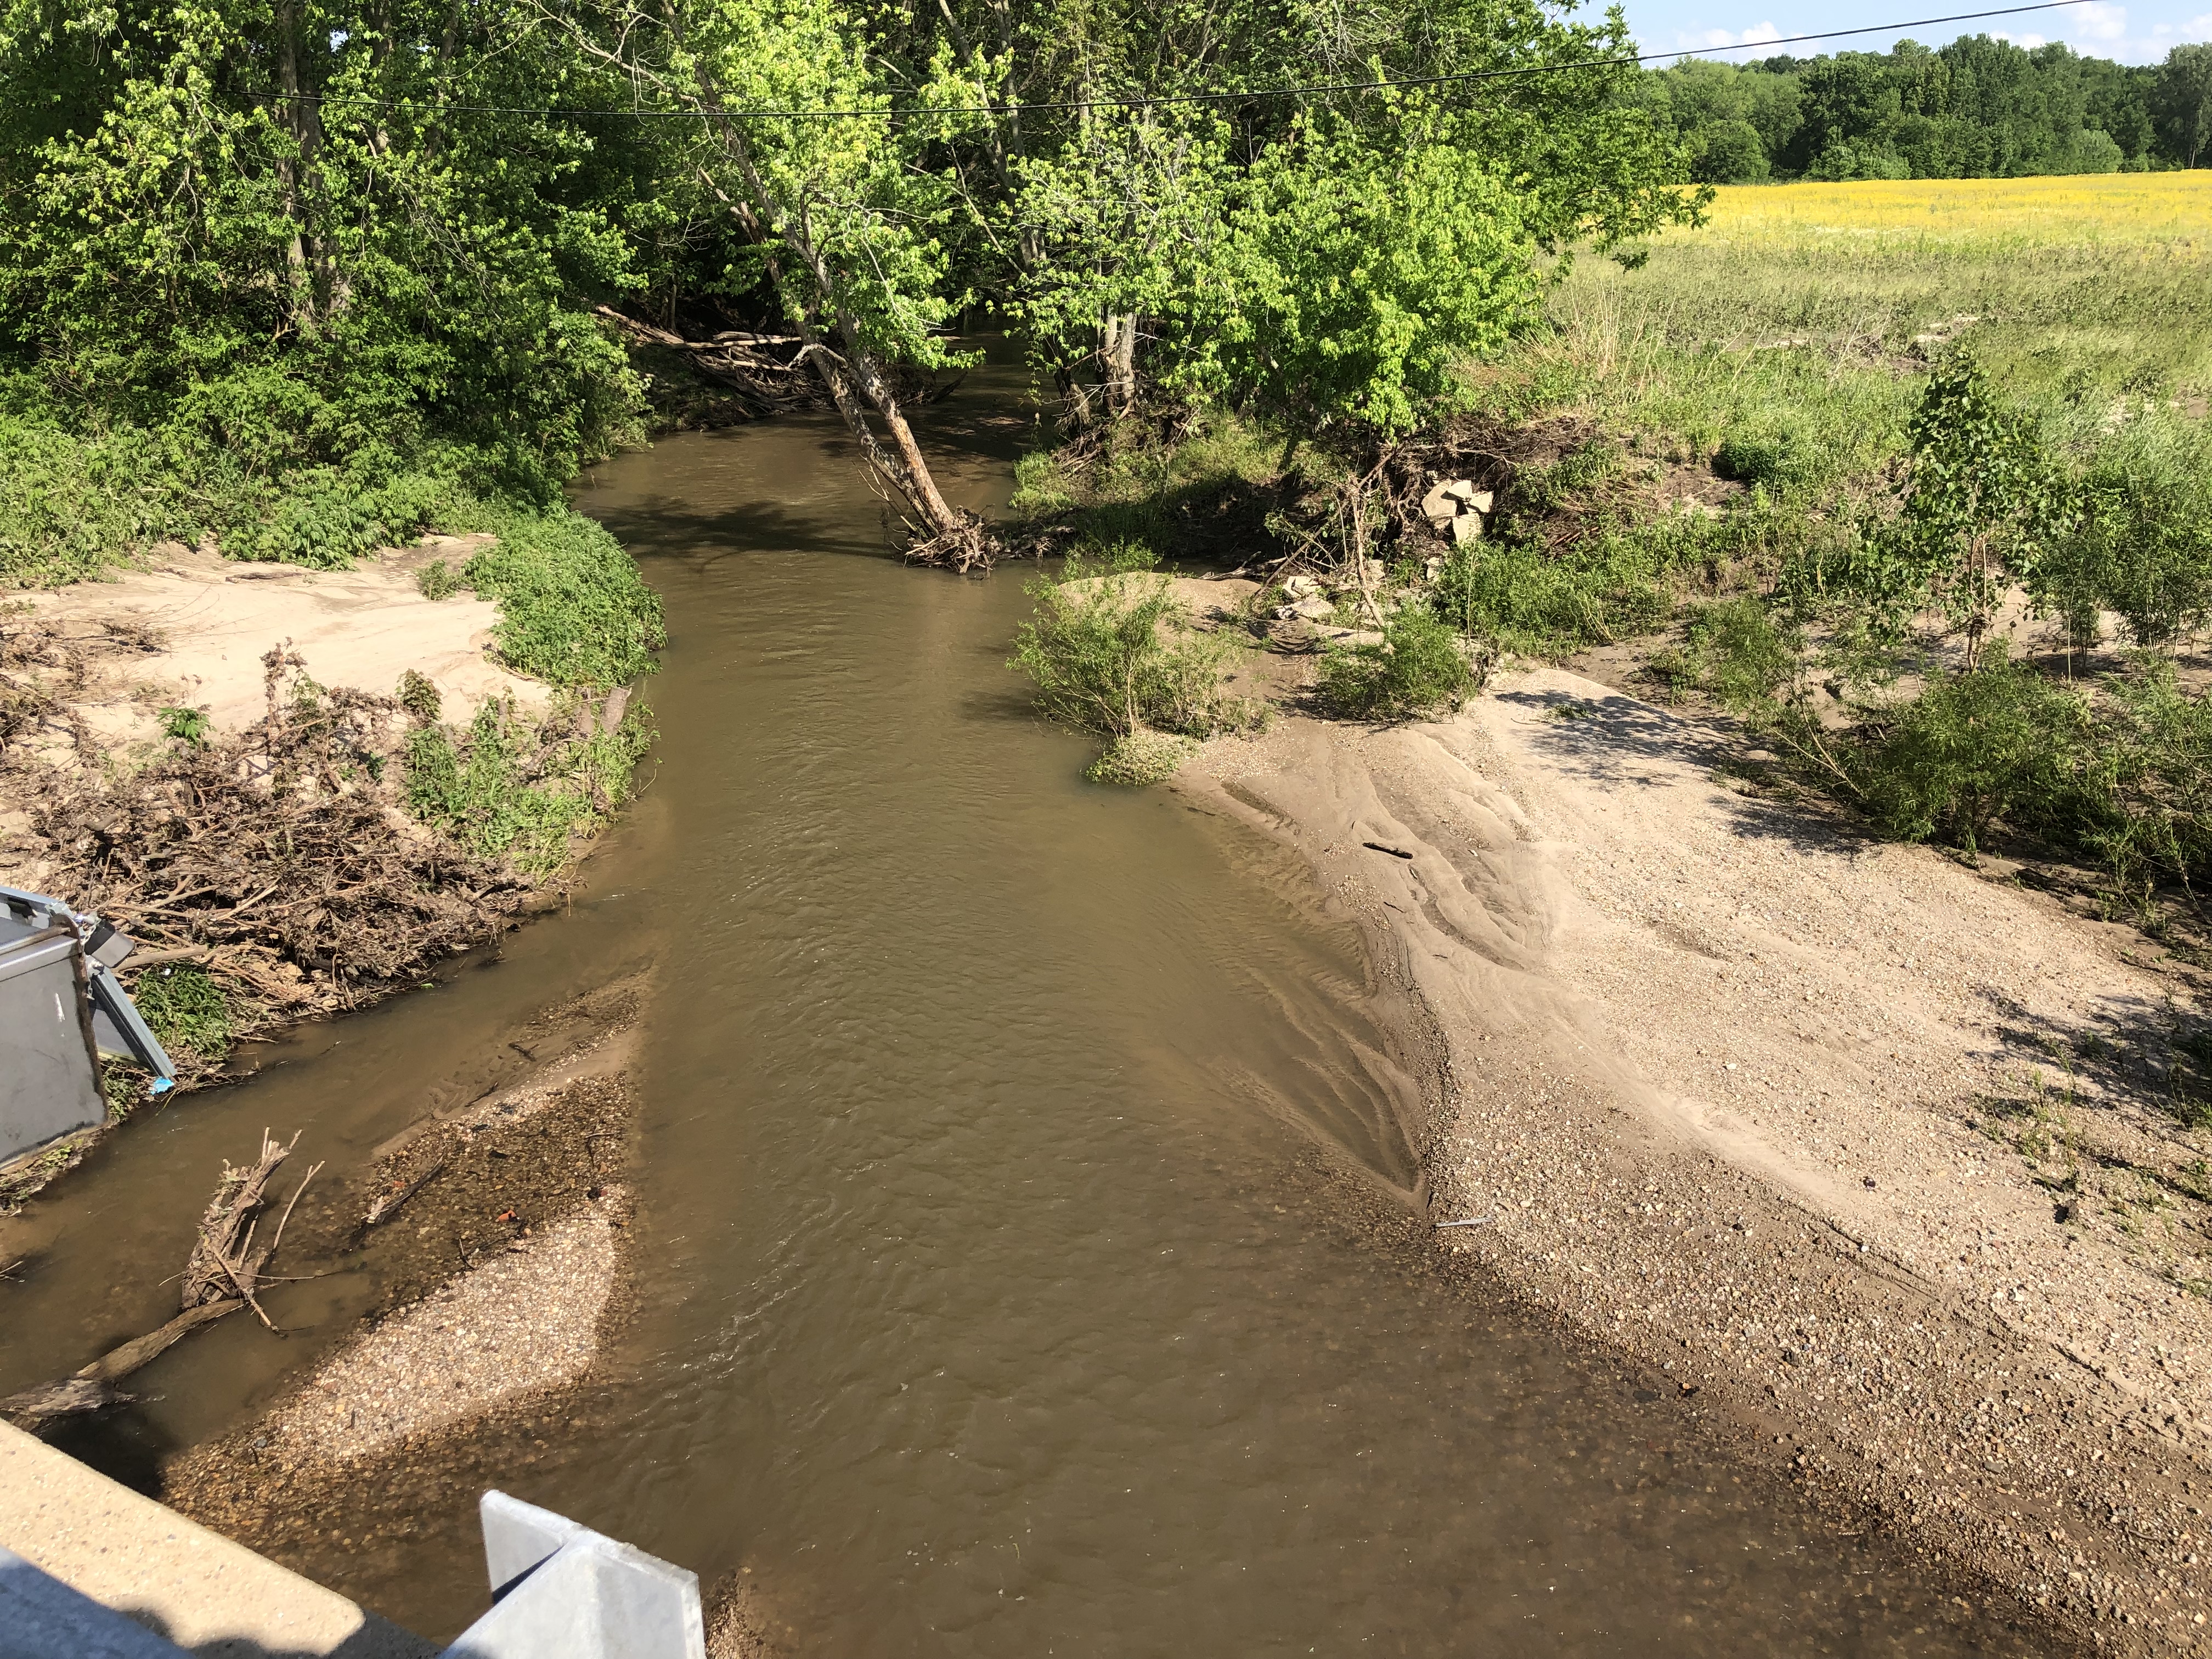
East Fork Shoal (405)
Stream Gauging and Auto Sampling Equipment
The monitoring stations are equipped with a datalogger, surface water radar, modem, antenna, and solar panel to recharge the batteries required to operate the monitoring equipment (left photo), along with an automatic water pump sampler (right photo).

Monitoring equipment for collecting, storing, and sending data.

Hurricane Creek site visit.

Automatic water pump for sample collection.
Water Quality Sampling
Baseflow nutrient and suspended sediment samples are collected weekly. Each station's datalogger is programmed to enable the automatic water pump to collect samples when the stream stage is above a predetermined elevation. During storm events, samples are collected more frequently and at specific points along the hydrograph. This allows for more samples to be collected during critical periods (rises, peaks, and falls) in the hydrograph as the stage (water-level) reacts to run off from precipitation in the study area.
The hydrographs and sample concentrations in the figures below depict the reaction of two different watersheds to a rain event in late February 2018. Each watershed has unique characteristics that affect the timing of runoff, stream stage, and sediment and nutrient loads.

Collecting auto samples

Hydrograph of February 2018 Rain Event
North Fork Kaskaskia River

Hydrograph of February 2018 Rain Event
Hurricane Creek
In the plots above, many samples are collected when the stage is changing rapidly. When the stage is rising quickly most nutrient and sediment concentrations are highest. Notice that most concentrations are highest before the peak in each hydrograph, but conversely, nitrate concentrations are diluted as the stage increases. Each station has its own customized sampling parameters based on hydrographs recorded since 2014. These sampling parameters can be modified remotely to collect the best distribution of samples and adjusted seasonally to account for changing baseline conditions.

Samples collected throughout one rain event. The variation in sample color is caused by the amount of sediment suspended in the water column at the time the samples were collected.
Monitored Nutrient Analytes and Sediment
| NITROGEN ANALYTES | PHOSPHORUS ANALYTES | SEDIMENT | ||||
| Total Kjeldahl Nitrogen | (TKN) | Orthophosphate | (oPO4-P) | Suspended Sediment Concentration | ||
| Nitrate as Nitrogen | (NO3-N) | Total Dissolved Phosphorus | (TP-Dis) | Suspended Sediment Particle Size | ||
| Ammonium as Nitrogen | (NH4-N) | Total Phosphorus | (TP) |
Nutrient samples analyzed by the ISWS Health and Environmental Applications Laboratory.
Sediment samples analyzed by the ISWS/ISGS Sediment Materials Laboratory.
Measuring Stream Discharge
The image below shows the velocity distribution of a high flow discharge measurement taken at East Fork Shoal Creek (405) with a Sontek S5 Acoustic Doppler Current Profiler (ADCP). This image illustrates the velocity of the water moving through the cross section of the stream. The dark blue and purple colors represent flow less than 2 feet per second as on the left and right edges of the water and in this case, where vegetation grows on the banks of the stream. The lime green and yellow indicate flow around 4 to 5 feet per second in the center of the cross section.

Measuring discharge with an ADCP

The velocity distribution of a stream discharge measurement at the monitoring station on East Fork Shoal Creek.
Unpublished Annual Reporting
| Illinois CREP Annual Reports | Kaskaskia Watershed Monitoring Report Locations |
| 2021 Illinois CREP Report | n/a |
| 2020 Illinois CREP Report | n/a |
| 2019 Illinois CREP Report | n/a |
| 2018 Illinois CREP Report | n/a |
| 2017 Illinois CREP Report | Appendix C |
| 2016 Illinois CREP Report | Appendix C |
| 2015 Illinois CREP Report | Appendix D |
| 2014 Illinois CREP Report | Appendix D |