Illinois Climate Network: Long Term Station Statistics – Brownstown
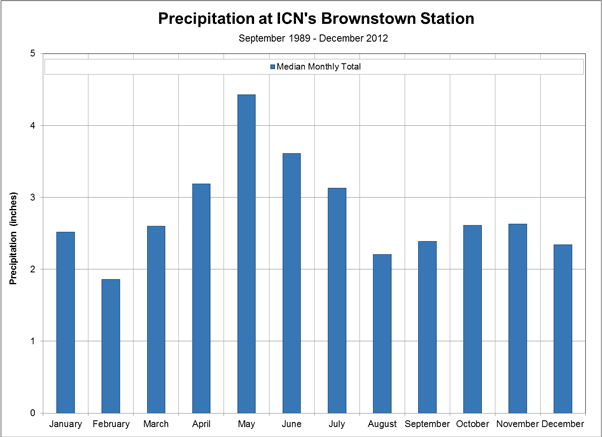
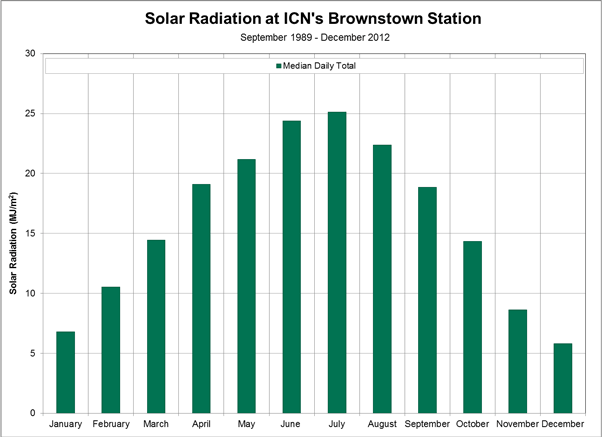
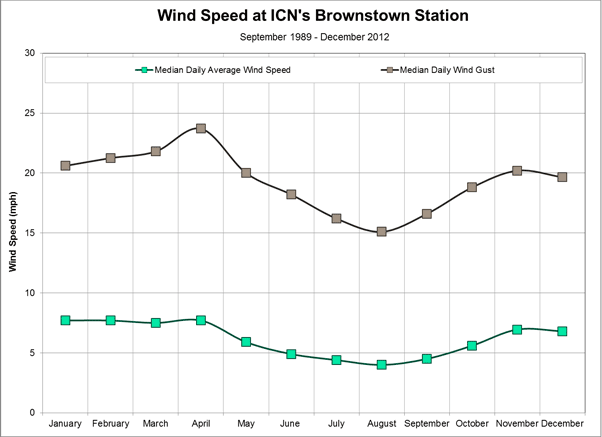
Long term statistics are calculated using daily data from the beginning of monitoring to December 31, 2012. Plots of median daily average, daily totals, and monthly totals are presented below. More daily and monthly statistics, including percentiles and averages, are available for download.
|
|
|
|
|
|
|
|
|
|
|
|
|
|
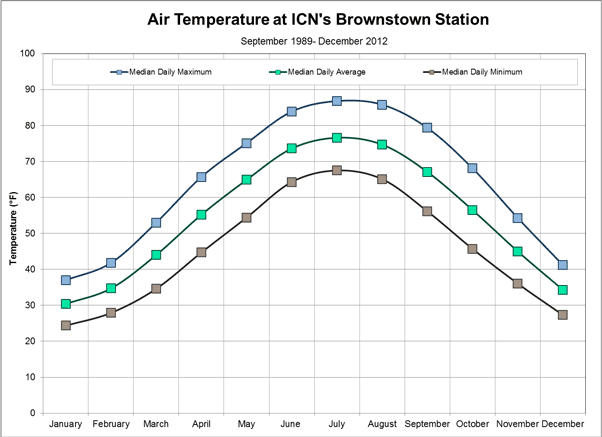
Air Temperature |
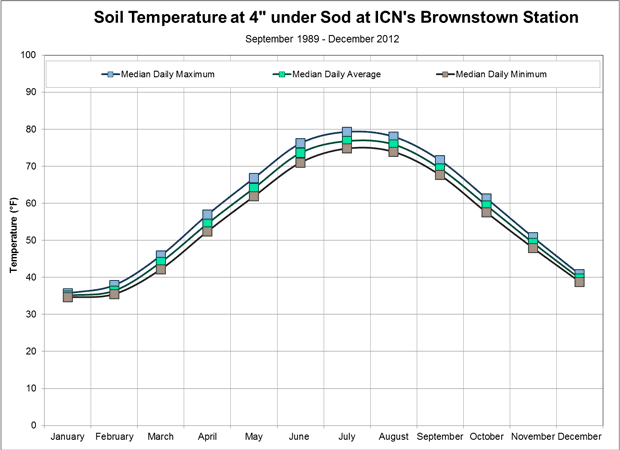
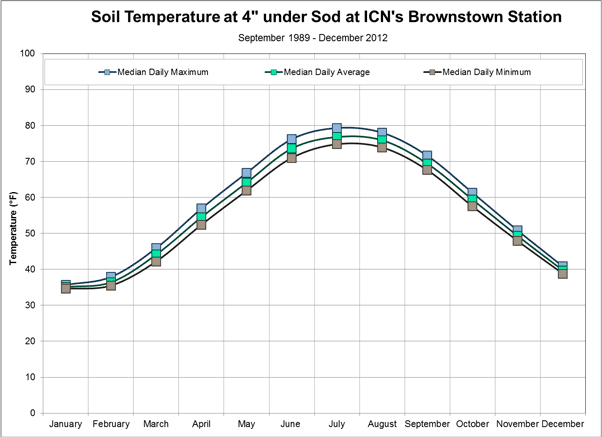
Soil Temp (4") |
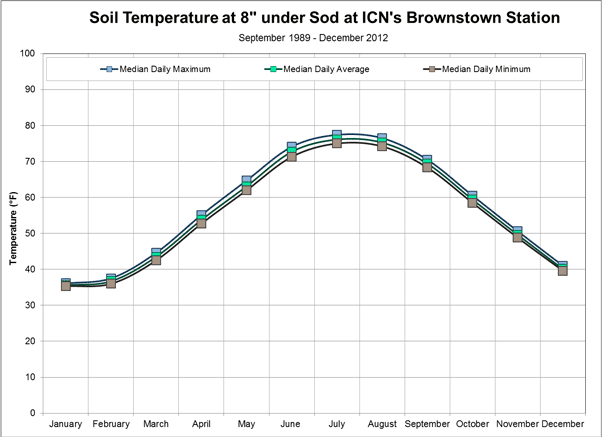
Soil Temp (8") |
Precipitation |
Solar Radiation |
Wind Speed |
Data Disclaimer
Water and Atmospheric Resources Monitoring Program. Illinois Climate Network. (2013). Illinois State Water Survey, 2204 Griffith Drive, Champaign, IL 61820-7495.