Streamflow Maps
These maps display 14-day average streamflow percentiles for selected USGS stations throughout Illinois. The percentage values on the maps describe the average streamflow for the preceding 14-day period, as compared to that same period for all years of record. For example, a value of 20 indicates that 20% of the years on record experienced a lower total flow amount than the current year.
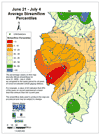
The percentage values on this map describe Illinois streamflows for June 21 - July 4, as compared to the same 14-day period for all years of record at selected USGS gaging stations. The streamflow data used to produce this map are provisional and may be subject to change.
Maps are available in lo res (100k) and hi res (150k) formats for viewing.
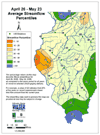
The percentage values on this map describe Illinois streamflows for April 26 - May 23, as compared to the same 14-day period for all years of record at selected USGS gaging stations. The streamflow data used to produce this map are provisional and may be subject to change.
Maps are available in lo res (100k) and hi res (150k) formats for viewing.
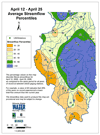
The percentage values on this map describe Illinois streamflows for April 12 - April 25, as compared to the same 14-day period for all years of record at selected USGS gaging stations. The streamflow data used to produce this map are provisional and may be subject to change.
Maps are available in lo res (100k) and hi res (150k) formats for viewing.
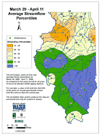
The percentage values on this map describe Illinois streamflows for March 29 - April 11, as compared to the same 14-day period for all years of record at selected USGS gaging stations. The streamflow data used to produce this map are provisional and may be subject to change.
Maps are available in lo res (100k) and hi res (150k) formats for viewing.
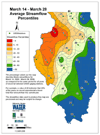
The percentage values on this map describe Illinois streamflows for March 14 - March 28, as compared to the same 14-day period for all years of record at selected USGS gaging stations. The streamflow data used to produce this map are provisional and may be subject to change.
Maps are available in lo res (100k) and hi res (150k) formats for viewing.
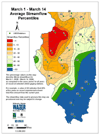
The percentage values on this map describe Illinois streamflows for March 1 - March 14, as compared to the same 14-day period for all years of record at selected USGS gaging stations. The streamflow data used to produce this map are provisional and may be subject to change.
Maps are available in lo res (100k) and hi res (150k) formats for viewing.
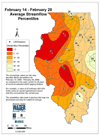
The percentage values on this map describe Illinois streamflows for February 14 - February 28, as compared to the same 14-day period for all years of record at selected USGS gaging stations. The streamflow data used to produce this map are provisional and may be subject to change.
Maps are available in lo res (100k) and hi res (150k) formats for viewing.
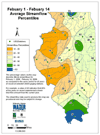
The percentage values on this map describe Illinois streamflows for February 1 - February 14, as compared to the same 14-day period for all years of record at selected USGS gaging stations. The streamflow data used to produce this map are provisional and may be subject to change.
Maps are available in lo res (100k) and hi res (150k) formats for viewing.
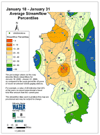
The percentage values on this map describe Illinois streamflows for January 18 - January 31, as compared to the same 14-day period for all years of record at selected USGS gaging stations. The streamflow data used to produce this map are provisional and may be subject to change.
Maps are available in lo res (100k) and hi res (150k) formats for viewing.
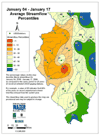
The percentage values on this map describe Illinois streamflows for January 4 - January 17, as compared to the same 14-day period for all years of record at selected USGS gaging stations. The streamflow data used to produce this map are provisional and may be subject to change.
Maps are available in lo res (100k) and hi res (150k) formats for viewing.
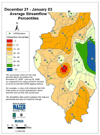
The percentage values on this map describe Illinois streamflows for December 21 - January 3, as compared to the same 14-day period for all years of record at selected USGS gaging stations. The streamflow data used to produce this map are provisional and may be subject to change.
Maps are available in lo res (100k) and hi res (150k) formats for viewing.
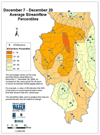
The percentage values on this map describe Illinois streamflows for December 7 - December 20, as compared to the same 14-day period for all years of record at selected USGS gaging stations. The streamflow data used to produce this map are provisional and may be subject to change.
Maps are available in lo res (100k) and hi res (150k) formats for viewing.
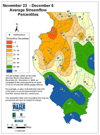
The percentage values on this map describe Illinois streamflows for November 23 - December 6, as compared to the same 14-day period for all years of record at selected USGS gaging stations. The streamflow data used to produce this map are provisional and may be subject to change.
Maps are available in lo res (100k) and hi res (150k) formats for viewing.
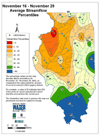
The percentage values on this map describe Illinois streamflows for November 16 - November 29, as compared to the same 14-day period for all years of record at selected USGS gaging stations. The streamflow data used to produce this map are provisional and may be subject to change.
Maps are available in lo res (100k) and hi res (150k) formats for viewing.
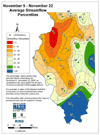
The percentage values on this map describe Illinois streamflows for November 9 - November 22, as compared to the same 14-day period for all years of record at selected USGS gaging stations. The streamflow data used to produce this map are provisional and may be subject to change.
Maps are available in lo res (100k) and hi res (150k) formats for viewing.
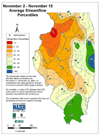
The percentage values on this map describe Illinois streamflows for November 2 - November 15, as compared to the same 14-day period for all years of record at selected USGS gaging stations. The streamflow data used to produce this map are provisional and may be subject to change.
Maps are available in lo res (100k) and hi res (150k) formats for viewing.
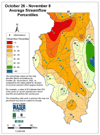
The percentage values on this map describe Illinois streamflows for October 26 - November 8, as compared to the same 14-day period for all years of record at selected USGS gaging stations. The streamflow data used to produce this map are provisional and may be subject to change.
Maps are available in lo res (100k) and hi res (150k) formats for viewing.
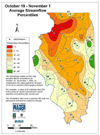
The percentage values on this map describe Illinois streamflows for October 19 - November 1, as compared to the same 14-day period for all years of record at selected USGS gaging stations. The streamflow data used to produce this map are provisional and may be subject to change.
Maps are available in lo res (100k) and hi res (150k) formats for viewing.
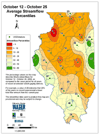
The percentage values on this map describe Illinois streamflows for October 12 - October 25, as compared to the same 14-day period for all years of record at selected USGS gaging stations. The streamflow data used to produce this map are provisional and may be subject to change.
Maps are available in lo res (100k) and hi res (150k) formats for viewing.
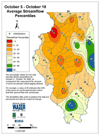
The percentage values on this map describe Illinois streamflows for October 5 - October 18, as compared to the same 14-day period for all years of record at selected USGS gaging stations. The streamflow data used to produce this map are provisional and may be subject to change.
Maps are available in lo res (100k) and hi res (150k) formats for viewing.
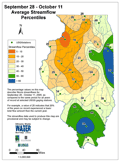
The percentage values on this map describe Illinois streamflows for September 28 - October 11, as compared to the same 14-day period for all years of record at selected USGS gaging stations. The streamflow data used to produce this map are provisional and may be subject to change.
Maps are available in lo res (100k) and hi res (150k) formats for viewing.
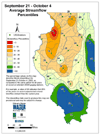
The percentage values on this map describe Illinois streamflows for September 21 - October 4, as compared to the same 14-day period for all years of record at selected USGS gaging stations. The streamflow data used to produce this map are provisional and may be subject to change.
Maps are available in lo res (100k) and hi res (150k) formats for viewing.
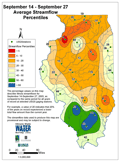
The percentage values on this map describe Illinois streamflows for September 14 - September 27, as compared to the same 14-day period for all years of record at selected USGS gaging stations. The streamflow data used to produce this map are provisional and may be subject to change.
Maps are available in lo res (100k) and hi res (150k) formats for viewing.
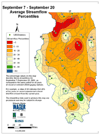
The percentage values on this map describe Illinois streamflows for September 7 - September 20, as compared to the same 14-day period for all years of record at selected USGS gaging stations. The streamflow data used to produce this map are provisional and may be subject to change.
Maps are available in lo res (100k) and hi res (150k) formats for viewing.
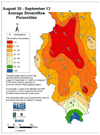
The percentage values on this map describe Illinois streamflows for August 30 - September 13, 2005, as compared to the same 14-day period for all years of record at selected USGS gaging stations. The streamflow data used to produce this map are provisional and may be subject to change.
Maps are available in lo res (100k) and hi res (150k) formats for viewing.
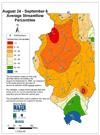
The percentage values on this map describe Illinois streamflows for August 24 - September 6, 2005, as compared to the same 14-day period for all years of record at selected USGS gaging stations. The streamflow data used to produce this map are provisional and may be subject to change.
Maps are available in lo res (100k) and hi res (150k) formats for viewing.
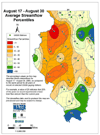
The percentage values on this map describe Illinois streamflows for August 17 - August 30, 2005, as compared to the same 14-day period for all years of record at selected USGS gaging stations. The streamflow data used to produce this map are provisional and may be subject to change.
Maps are available in lo res (100k) and hi res (150k) formats for viewing.
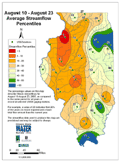
The percentage values on this map describe Illinois streamflows for August 10 - August 23, 2005, as compared to the same 14-day period for all years of record at selected USGS gaging stations. The streamflow data used to produce this map are provisional and may be subject to change.
Maps are available in lo res (100k) and hi res (150k) formats for viewing.
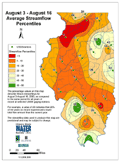
The percentage values on this map describe Illinois streamflows for August 3 - August 16, 2005, as compared to the same 14-day period for all years of record at selected USGS gaging stations. The streamflow data used to produce this map are provisional and may be subject to change.
Maps are available in lo res (100k) and hi res (150k) formats for viewing.
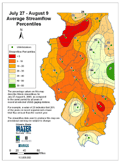
The percentage values on this map describe Illinois streamflows for July 27 - August 9, 2005, as compared to the same 14-day period for all years of record at selected USGS gaging stations. The streamflow data used to produce this map are provisional and may be subject to change.
Maps are available in lo res (100k) and hi res (150k) formats for viewing.
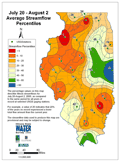
The percentage values on this map describe Illinois streamflows for July 20-August 2, 2005, as compared to the same 14-day period for all years of record at selected USGS gaging stations. The streamflow data used to produce this map are provisional and may be subject to change.
Maps are available in lo res (100k) and hi res (150k) formats for viewing.
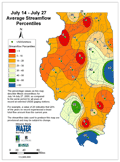
The percentage values on this map describe Illinois streamflows for July 14-July 27, 2005, as compared to the same 14-day period for all years of record at selected USGS gaging stations. The streamflow data used to produce this map are provisional and may be subject to change.
Maps are available in lo res (100k) and hi res (150k) formats for viewing.
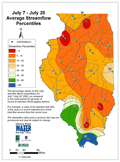
The percentage values on this map describe Illinois streamflows for July 7-July 20, 2005, as compared to the same 14-day period for all years of record at selected USGS gaging stations. The streamflow data used to produce this map are provisional and may be subject to change.
Maps are available in lo res (100k) and hi res (150k) formats for viewing.
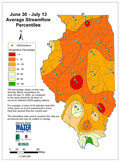
The percentage values on this map describe Illinois streamflows for June 30-July 13, 2005, as compared to the same 14-day period for all years of record at selected USGS gaging stations. The streamflow data used to produce this map are provisional and may be subject to change.
Maps are available in lo res (100k) and hi res (150k) formats for viewing.
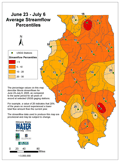
The percentage values on this map describe Illinois streamflows for June 23-July 6, 2005, as compared to the same 14-day period for all years of record at selected USGS gaging stations. The streamflow data used to produce this map are provisional and may be subject to change.
Maps are available in lo res (100k) and hi res (150k) formats for viewing.
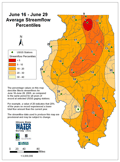
The percentage values on this map describe Illinois streamflows for June 16-June 29, 2005, as compared to the same 14-day period for all years of record at selected USGS gaging stations. The streamflow data used to produce this map are provisional and may be subject to change.
Maps are available in lo res (100k) and hi res (150k) formats for viewing.
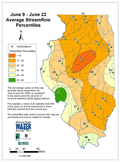
The percentage values on this map describe Illinois streamflows for June 9-June 22, 2005, as compared to the same 14-day period for all years of record at selected USGS gaging stations. The streamflow data used to produce this map are provisional and may be subject to change.
Maps are available in lo res (100k) and hi res (150k) formats for viewing.
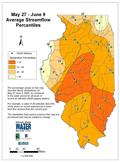
The percentage values on this map describe Illinois streamflows for May 27-June 9, 2005, as compared to the same 14-day period for all years of record at selected USGS gaging stations. The streamflow data used to produce this map are provisional and may be subject to change.
Maps are available in lo res (100k) and hi res (150k) formats for viewing.