 Soil
Soil
The most detailed Illinois GIS soil descriptions are STATSGO soil map units
composed of similar soil types. Each map unit may include up to 21 individual
soil types. Soil values used in this Web page are the weighted average values
of the soil types contained within the STATSGO map unit; soil pH and texture
are weighted averages of the surface soil layer only. The STATSGO map unit soil
pH, texture, and drainage values are compared to crop requirements to obtain
suitability scores for each soil characteristic.
Soil pH is
a measure of acidity (hydrogen ion concentration). The pH values range from 0
to 14: 0 is most acidic, 7 is neutral, and 14 is most basic (lowest hydrogen
ion concentration). Soil pH values range from ~3
to 10. Forest and bog soils of the humid
east tend to be acidic and grassland and desert soils of the west tend to be
basic.
Effect of pH on nutrient availability
 |
Extremes
of soil pH release substances from soils in amounts that can be toxic to
plants. Acid soils may dissolve toxic amounts of metals (such as aluminum and
manganese). Alkaline soils may accumulate salts and sodium carbonates in toxic
concentrations that can alter soil structure, thereby making it difficult for
roots to grow. Stunted root systems have trouble taking up adequate water and
nutrients. Toxic metals in acid soils, subsoil nutrient depletion, and subsoil
clay pans also stunt root growth.
Slightly acidic soils (pH ~6.5) are considered most
favorable for overall nutrient uptake. Such soils are also optimal for
nitrogen-fixing legumes and nitrogen-fixing soil bacteria. Some plants are
adapted to acidic or basic soils due to natural selection of species in these
conditions. Potatoes grow well in soils with pH <5.5. Blueberries and
cranberries grow well in even more acidic soils (<4.5) . Sugar beets, cotton,
kale, garden pea, and many grasses grow well in alkaline soil (>7.5).
Soil pH also affects the soil in other ways. For example,
soil microbe activity, particularly nitrogen-fixing bacteria may be reduced in
acid soil.
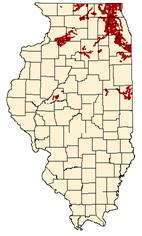
Agricultural soils of Illinois
tend to acidify to pH values more acidic than 6.5. This acidity is managed by
adding lime (carbonates of calcium and magnesium). Average soil pH values vary
from mildly alkaline (7.0-7.5) to strongly acid (5.2-5.5) in extreme southern Illinois.
| The Natural Resources Conservation Service has set standard soil pH classifications. |
| pH classifications |
pH values |
| Extremely acid |
< 4.5 |
| Very strongly acid |
4.5 to 5.0 |
| Strongly acid |
5.1 to 5.5 |
| Medium acid |
5.6 to 6.0 |
| Slightly acid |
6.1 to 6.5 |
| Neutral |
6.6 to 7.3 |
| Mildly alkaline |
7.4 to 7.8 |
| Moderately alkaline |
7.9 to 8.4 |
| Strongly alkaline |
8.5 to 9.0 |
| Very strongly alkaline |
> 9.0 |
|
 |
 |
| Average pH
|
|
|
DRAINAGE rate refers to the rapidity and extent that water is
removed from a soil by surface runoff, underground flow through the soil, and
evaporative loss. Drainage also refers to soil drainage status — the frequency
and duration with which soil is waterlogged. In Illinois’ climate, the drainage rate coincides with soil drainage status.
If drainage is very rapid, the soil is excessively drained. If drainage is very
slow, the soil suffers from excessive waterlogging and is very poorly drained.
Soil drainage extremes present the
same types of problems for crops that extremes of soil pH do. Excessively
drained soils do not provide most crops with adequate water and nutrients, and
the structure of the soil limits root growth. Additionally, excessively drained
soils tend to warm early and generally undergo marked temperature fluctuations.
Water and nutrient availability are also limited in poorly drained soils
because oxygen deficiency limits the ability of roots to take up adequate water
and nutrients. With waterlogging, putrefaction sets in. Putrefaction occurs
when partially decomposed organic matter accumulates, clogging soil pores and
blocking root growth and the drainage of water through soil. Putrefaction
produces toxic substances: reduced nitrogen, sulfur, metals, and organic
fermentation products. Furthermore, it produces methane, a gas that attacks the
atmosphere’s self-cleansing system. Additionally, poorly drained soils tend to
warm up slowly in the spring and reduce the length of crop growing seasons.
Illinois’ drainage problems are principally those of poor drainage.
Ditching and subsurface tiling typically improve drainage. With improved
drainage, excessive organic matter is destroyed due to decomposition by
oxidation rather than putrefaction. Root and soil fauna penetration of subsoil
improves soil drainage and structure. The soil’s large store of organic
nitrogen undergoes oxidation to water-soluble nitrate. With good drainage,
nitrate may drain into groundwater and surface water at rates detrimental to
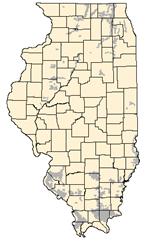
water quality. The map below depicts average drainage for Illinois soils. The sandy soils in Mason and Will counties are
unlike the majority of Illinois soils, which are moderately well to poorly drained.
| The NRCS assigns soils to one of the following eight
drainage classes: |
Excessively drained |  |
| Semi-excessively drained |
| Very well drained |
| Well drained |
| Moderately well drained |
| Semi-poorly drained |
| Very poorly drained |
| Poorly drained |
Texture describes the proportion of sand, silt, and
clay in a soil. The relative proportion and physical properties of these
separates (i.e., particles) affect drainage, water storage capacity, aeration,
permeability, and other soil properties. |
| |  | | Average Drainage |
|
|
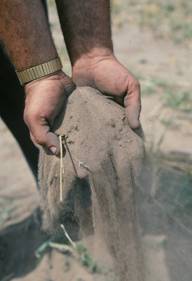
Sand, the largest sized particle (> 0.5 millimeters or
mm), has small surface area for its mass. This, in turn, prevents sand from
holding significant water or nutrients. Sand, therefore, reduces the amount of
a soil’s physical and chemical activity. Sand increases the spaces between
particles, letting air and water readily enter and exit the soil.
Clay, the smallest sized particle (< 0.002 mm), has the
greatest surface area. Clay particles have a millionfold more surface area per
mass than silt. Clay is capable of holding large amounts of water and nutrients
but may prevent the release of water for plant use.
Silt is intermediary between sand and clay in size, water
and nutrient retention, and chemical and physical activity. It has
approximately four times the surface area of sand. Soils with large proportions
of silt provide greater amounts of water for plant use than other soils.
In addition to sand, silt, and clay, soil is made up of
water, air, organic matter, and other larger mineral matter. The coarse
fragments of mineral matter are named by their size, shape, and composition.
Examples of these coarse fragments are gravel, stones, flagstone, and chert.
The amount of organic matter varies. As a general rule, the darker the soil,
the higher the organic matter (and productivity). Mucks and peat soils are examples of soils
extremely high in organic matter.
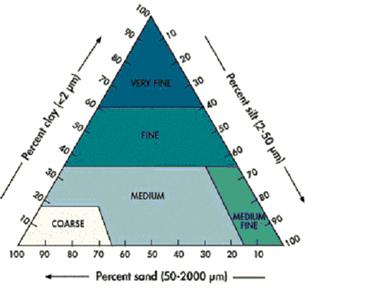
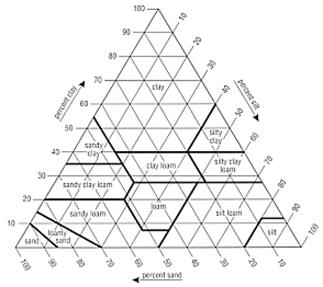
Any separate alone would not be a desirable soil. Blends of
these separates form soil textures, and some are ideal for plant growth. The
soil texture triangle is a method of simultaneously representing the percentage
of each separate in a soil. The first soil texture triangle is labeled with general
texture class names. The second soil texture triangle is labeled with the soil
texture class names used by the United States Department of Agriculture-Natural
Resource Conservation Service.
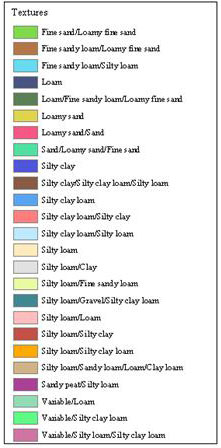 |
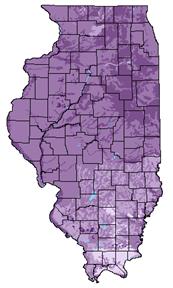
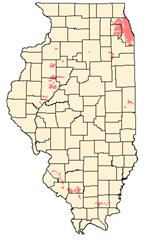
Predominate Soil Textures |
The map above identifies the predominant (>16% area) soil
textures within STATSGO map units.
Disturbed soils, such as urban areas and reclaimed
stripmines, occur in Illinois.
These soils are the result of removal and/or addition of soil or other
materials. The maps below highlight map
units that contain atypical soil types.
 |
 |
 |
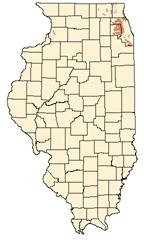 |
| Muck |
Coarse Fragment |
Disturbed Soils |
Sandy Peat |
Soil pH, drainage, and texture requirements are available
for many crops and were therefore used to create suitability maps. Other soil
properties with impacts on crop growth and development are soil depth, organic
matter content, permeability, cation exchange capacity, salinity, and
fertility. Information on the plant
requirement for these soil characteristics was limited to a few crops and
therefore were not included in this discussion.

|