Climate
 Weather
is the state of the atmosphere at a given time and is described by air
temperature, precipitation amount and type, air pressure, wind speed and
direction, solar radiation, and humidity. Climate, in contrast, is a long-term
characterization or averaging of these variables. Climate provides an expected
range of weather at a location and therefore insight as to how well a crop
might be expected to grow. Weather
is the state of the atmosphere at a given time and is described by air
temperature, precipitation amount and type, air pressure, wind speed and
direction, solar radiation, and humidity. Climate, in contrast, is a long-term
characterization or averaging of these variables. Climate provides an expected
range of weather at a location and therefore insight as to how well a crop
might be expected to grow.
Daily weather records, 1971-2000, from 86 sites were used to
characterize the climate of Illinois.
Air Temperature affects the amount of water a crop requires, and the
rate of physical and chemical reactions that determine a crop’s rate of growth
and development.
Water evaporates (transpires) through leaf openings
(stomates) that permit carbon dioxide to enter and oxygen to exit the plant. As
much as 99% of the water “used” by a plant simply travels though the plant,
entering the roots and exiting through the stomates. Increasing air
temperature, accompanied by reduced air humidity, generally increases
evapotranspiration. By definition, evapotranspiration is the water lost by
evaporation from the soil surface, and transpiration of water from a plant’s
leaves. When there is insufficient water in the soil to meet the
evapotranspiration demand, the plant wilts. Plants conserve water by closing
stomates when humidity is low. The threshold at which stomates close
varies among crops. When stomates close, transpiration is reduced as well as
the entry rate of carbon dioxide, which results in a reduction of the rate of
photosynthesis. Other water-conserving morphological and physiological
adaptations include modified leaves of cacti, evergreen needles, and Crassulacean Acid Metabolism (CAM)
photosynthesis.
Generally, physical processes (e.g., diffusion rates) and
chemical reactions that control life and growth increase with temperature. The
rate of chemical reactions and the enzyme activities that catalyze chemical
reactions function most efficiently at crop-specific optimum temperatures. The
basic plant processes of respiration and photosynthesis are examples of
temperature affecting chemical reactions (respiration) and physical reactions
(photosynthesis).
Respiration is the process of “burning” sugar to release
stored chemical energy that powers the cellular activities required to maintain
the health of a plant, and to increase the size of the plant. Respiration tends
to increase directly with temperature.
Photosynthesis, on the other hand, accumulates energy using
sunlight to transform carbon dioxide and water into sugar and oxygen; it is not
as directly related to temperature. The rate of photosynthesis in corn, for
example, plateaus at about 86°F (30°C). Although warmer
conditions increase the diffusion rate of water out of and carbon dioxide into
the leaves, the physical process of trapping light, a process that is not
sensitive to temperature changes, limits photosynthesis rates. Generally, solar
radiation intensity is more limiting than the diffusion rate in well-watered
plants. However, high air temperatures and low air humidity also may limit
photosynthesis by slowing the rate of carbon dioxide diffusion into the leaves
of water-stressed plants with closed stomates.
High air temperatures and low air humidity may limit
photosynthesis by triggering stomates to close, reducing the diffusion of
carbon dioxide into the leaves of water-stressed plants.
Raw materials and resulting products of photosynthesis are
the same for all plants. However, differences exist in the pathways that
produce the photosynthetic products. Plants use one of several pathways to link
and store carbon dioxide in photosynthesis. Briefly, “C3 plants” use the most
common and the least efficient method. The C3 plants generally originate from
temperate regions and photosynthesis is optimized at temperatures from 59-86°F
(15-30°C). Certain grasses (corn, sorghum and sugarcane) and other
crops (cotton) use the more efficient “C4” pathway of accumulating carbon
dioxide. The C4 plants generally originate from tropical regions, and
photosynthesis is optimal at temperatures from 68-95°F (20-35°C).
“CAM” plants, such as
pineapple, save water by collecting carbon dioxide during cool nights and
storing it until daylight when chloroplasts use sunlight to complete
photosynthesis.
Growth depends on the combined and coordinated chemical
reactions of photosynthesis and respiration and many other biochemical
reactions, each with its own optimum temperature. The combination of these
different optimum temperatures for the many biochemical reactions results in
crops having unique optimum temperatures for growth. Optimum temperatures
indicate the upper and lower temperature limits at which a crop grows best.
Absolute temperatures mark the temperatures at which growth ceases until
temperatures return to more favorable conditions, or the plant will die if the
temperatures remain outside the absolute temperature range for a long enough
period. Upper and lower optimum and absolute temperatures are called cardinal
temperatures and vary from crop to crop. For example, wheat, a C3 plant, will
flourish in low temperatures that suspend or retard growth in corn, a C4 plant.
Soil Temperature data are useful
in production management decisions. For example, the loss of nitrogen from
anhydrous ammonia through a process that converts nitrogen from an ammonia form
to nitrate (nitrification) is reduced by fall application of anhydrous ammonia
when soil temperatures are below 50°F (10°C). Spring
soil temperatures are helpful in determining the correct time to plant. Illinois
soil temperatures, and other weather data, are available at the Water and Atmospheric Resources Monitoring
(WARM) site.
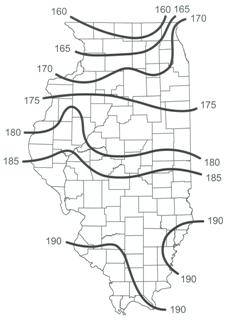 |
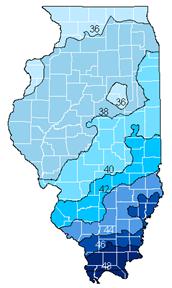
| Average Illinois growing days |
Growing Days define the number of days required to for a crop to
produce an economic yield or complete a life cycle. The number of days is
important but becomes more meaningful when it is related to temperature.
Growing days represent the required number of
days at or within a temperature regime. In this Web site, they represent the
number of days above freezing or within the temperature range defined by the
minimum absolute temperature. Freezing, 32°F (0°C) is
often considered to be the base or lower temperature limit when calculating
growing days. Base temperatures vary among crops, depending on plant minimum
temperature tolerance. The map at the right depicts the number of growing days
above freezing, based on daily minimum temperatures. Additional maps showing last spring frost and
first fall frost at various probability levels can be viewed in the climatology
chapter of the Illinois
Agronomy Handbook.
Growing degree days (GDDs) are often used to describe or
predict heat-driven biological activity such as plant and insect development.
Similar to heating or cooling days, GDDs are a way to express accumulated heat
within a defined temperature range. They represent the number of degrees the
daily average temperature is above a minimum temperature. For many crops, such
as corn and soybean, 50°F (10°C) is used as the minimum
temperature. The following formula is used for this calculation.
GDD = (Maximum Temperature (°F) + Minimum Temperature (°F) ) /2- 50 (°F)
The minimum GDD value for a day is 0. Temperatures below 50°F
are set to 50°F thus preventing negative values.
High temperatures can be detrimental and the formula is
sometimes improved by discounting temperatures that exceed a maximum value. For
example, the maximum value for corn is 86°F. Maximum temperature
values greater than 86°F are set to 86°F.
Winter Minimum Temperatures are a
major factor in determining the ability of biennials, perennials, and winter
annuals to survive at a given location. Most plants are more than 85
percent water; therefore, cold temperatures, especially temperatures at or
below freezing, present challenges to plants. Plant cells rely on the
properties of water to serve as an efficient means to move, store, and
rearrange chemicals. The properties of water change drastically at the freezing
point when it changes to the solid state. As water in and around a plant freezes,
it expands, tearing cell membranes and killing tissue. Frozen water in the soil cannot move into the
roots and becomes unavailable to the plant. Individual cells die as water
expands, and critical processes cease due to lack of available water.
The distribution of crops that live through the winter
season is limited by a region’s extreme cold temperature and the crops’ ability
to endure the cold. Some plant adaptations allow crops to avoid freezing
conditions. Annual plants survive cold temperatures as dormant dried seeds and
resume growth during more favorable seasons. Deciduous and herbaceous perennial
plants shed their leaves as cold weather approaches, conserving water and
energy required to maintain the leaves, and live on stored reserves.
Cold climate plants have adapted to freezing temperatures.
Evergreens have small leaves with little surface area and thick cuticles to
conserve water. Many plants contain antifreeze like carbohydrates or proteins
that lower the freezing temperature of water within the plant. Many perennial,
biennial, and winter annual crops avoid the coldest temperatures by timing
mechanisms that cause them to only grow during periods when the coldest
temperatures do not occur.
Cold Hardening describes the changes in a plant’s
composition and/or metabolic processes in preparation for withstanding cold
temperatures. Cold hardiness is often associated with a minimum temperature
value. This can be an inexact/unreliable number due to the interaction of cold
with crop genetics and other environmental requirements and conditions. For
example, a sudden rise in temperature can
cause a water demand that cannot be met by a plant in frozen soil. Plants
protected from sudden and extreme temperature changes by snow or straw may
survive lower temperatures than uncovered plants.
Dormancy is a resting phase when plant metabolic
activity and growth are negligible. Dormancy is triggered by increasing cold
temperatures and decreased day length, the same stimuli associated with leaf
loss in deciduous plants. Once dormancy has been established growth, can only
be re-initiated after the plant has experienced a required number of hours
(i.e., chill hours) at cool temperatures (i.e., 32-45°F; 0-8°C).
Chill hours are accumulated during the autumn and winter seasons.
This clever adaptation allows a plant to sense winter’s approach and to
schedule a resting phase during the coldest season. Growth resumes during more
favorable conditions in spring, but only after ample cold weather. Matching the
length of a crop’s chill hour requirement to the climate is critical. Selecting
crops with a very large chill hour requirement relative to the hours of cool
temperature at a location would not prevent plants from resuming active growth
in the spring; however, it would reduce the number of fertile flowers produced
by the plants. Crops, such as peaches, with short chill hour requirements, may
completed early in the cold season may break dormancy during a warm period
mid-winter, resulting in freeze damage when more typical cold temperatures
resume. Chill hour requirements vary within a crop. Apple trees, for example
may be adapted to different latitudes largely due to their chill hour
requirements. (See Application
of a Chilling Hour Climatology to Predict Fruit Crop growth in Illinois or How
to Tell When Your Fruit Crops are Ready to Start Growing in the Spring for
Illinois chill hour information.)
Vernalization is the cold requirement that must be
met before some plants will flower. The strategy is similar to dormancy in that
vernalization is a timing mechanism that delays flowering until favorable
conditions occur. Winter wheat grown in too warm a climate may not accumulate
sufficient vernalization days (days meeting its cold requirement) and
will fail to flower.
Regardless of any of these timing mechanisms, if the crop is
unable to endure an area’s coldest temperatures, it is not suited to the area.
For example, even though pecan trees drop their leaves and enter dormancy, they
cannot endure the cold temperatures associated with northern Illinois.
The following map shows the annual minimum temperatures at
the 0.25 probability level. Colder temperatures would be expected no more than
one in four years.
 | 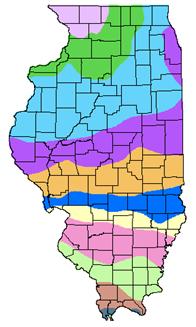 |
| Coldest temperature expected in Illinois three years out of four |
Precipitation in liquid form (rain) or frozen form (snow, hail, etc.) provides the
water needed for crops to grow. Realizing that 85% or more of a plant may be
water, it is easy to understand the importance of rainfall in crop growth and
development. Drought -- the condition when precipitation fails to meet crop
needs -- and floods -- excessive precipitation -- can be disastrous.
An area’s precipitation often is reported as an annual
average. This statistic, although helpful, is incomplete when comparing an
area’s precipitation to crop water needs. If 35 inches of rain falls during a
period when the crop is not growing, without any additional rainfall, the
annual average precipitation would be 35 inches. Although technically meeting
the annual rainfall requirement for many common crops, this 35 inches of rain
likely would not meet the crop’s water demand.
A crop’s water requirement changes during its life
cycle. For most crops, water requirements are modest during early growth. Soil
water content during germination and early growth is critical. Once the seed
coat ruptures and the radicle (root) and plumule (shoot) emerge, the plant
cannot return to seed dormancy. If the germinating seed does not receive ample
water, it will die. Too much water will displace air containing needed oxygen
in the soil, and the plant will suffocate. Water needs increase with increased
growth and leaf area. For the many crops harvested as fruits or seeds, meeting
water needs during reproduction and grain fill is critical.
Causal organisms associated with plant diseases also have
specific environmental needs, some of which are related to precipitation. High
humidity, flooding, and drought may promote the development of specific
infectious agents and the spread of their associated diseases.
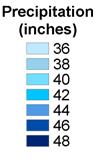 |
 |
The
map at the right shows the average annual precipitation in Illinois.
The general pattern is increasing annual rainfall from 36 inches (914
millimeters or mm) in the northwest corner of the state to 48 inches (1219 mm)
in the southeast.
Light in the form of sunshine
(solar radiation) is the source of energy for all life on earth. The majority
of life on earth relies on green plants to convert sunlight into stored
chemical energy. It is not surprising that the intensity, quality, and duration
of light greatly influence crop growth.
Plant tissue and, subsequently, yield is accumulated stored
chemical energy (e.g., starch, oil, sugar, and lignified tissue). The stored
energy is from sunlight. Most of our traditional crops are adapted to live in
full sunlight, collecting as much sunlight as possible. The C4 plants are
generally more productive than C3 plants in intense sunlight. In higher
latitudes, where sunlight is less intense, this advantage is reversed.
Some crops, such as ginseng, are adapted to grow in a shady
environment. Ginseng requires 80% shade and is cultivated in forests or
artificial shade conditions. Such crops are unlikely to produce large biomass
and are usually valued for some specific quality.
The quality or color of light is important. Chlorophyll
(chlorophyll a and chlorophyll b) is green and thus reflects
green light. Photosynthesis uses primarily blue and near red light to fix
carbon dioxide. A plant grown in only green light would starve. Other
photosensitive chemicals, such as carotenoids, aid the plant in photosynthesis
and in sensing and responding to light.
Photoperiodism is a
term that describes influence of light on a plant’s ability to
flower. The flowering process is one of many other
processes, in addition to photosynthesis, initiated and/or stopped by light.
For example, plants sense and grow towards a light source. Flowering is
influenced by the hours of light available in a 24-hour period. Day-length
sensitive plants flower in response to the length of light or dark
periods.Day-length sensitive plants are
classified into three groups; short day plants, long day plants, or day neutral
plants. Flowering is initiated in short day plants when a critical night length
is exceeded. Long day plants flower when night length is less than a critical
length. Flowering in day neutral plants is independent of day and night length.
Day-length sensitive plants flower so that reproduction
coincides with advantageous climatic conditions. The chart below shows how the latitude and
time of year affect day length. Day length remains constant (12 hours) at the
Equator and increases with increasing latitude during the summer. Day length is
at its maximum at the beginning of summer (June 21 in the Northern Hemisphere,
December 21 in the Southern Hemisphere). Day length at the North Pole and South
Pole on the summer solstice is 24 hours. Day and night lengths are 12 hours
worldwide on the spring and fall equinoxes.
Because of the relationship between day length and latitude,
flowering is delayed when short day plants are planted in higher latitudes.
Moving a short day plant to lower latitudes will hasten flowering. Growing a
long day plant at lower latitudes may prevent flowering entirely.
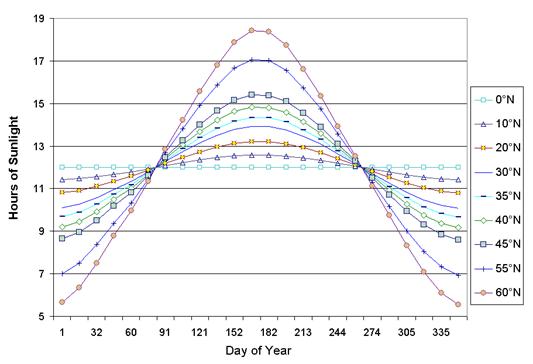
Day length throughout the year at different latitudes

|